Miami Dade County Investment Properties for Sale
Browse homes for sale and investment properties in Miami Dade County. Refine your search by price, property type, or more.
Best cash flowing properties in Miami Dade County

Active
$485,000
3
bds
|
2
ba
|
1,139
sqft
|
built
1948
2632 NE 214th St, Miami, FL 33180
$-180
Cash flow
-1.9%
Cash-on-Cash Return
5.7%
Cap rate
0.7%
Rent to Value Ratio

Active
$299,000
2
bds
|
1
ba
|
866
sqft
|
built
1971
2496 SW 17th Ave, Miami, FL 33145
$-310
Cash flow
-5.4%
Cash-on-Cash Return
4.9%
Cap rate
0.8%
Rent to Value Ratio
10,000 out of 11,974 properties for sale in Miami Dade County
Limited Results Shown
Create a free account, or log in to reveal all property listings and enjoy the complete experience.
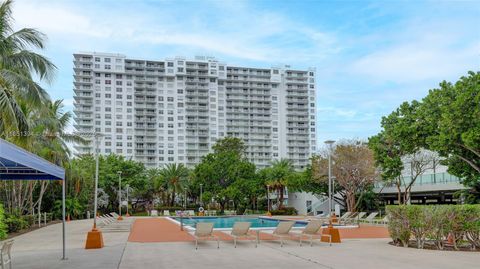
Active
$570,000
3
bds
|
2
ba
|
1,350
sqft
|
built
1994
19877 E Country Club Dr, Aventura, FL 33180
$-1,800
Cash flow
-16.5%
Cash-on-Cash Return
2.4%
Cap rate
0.7%
Rent to Value Ratio
Active
$499,000
3
bds
|
2
ba
|
1,386
sqft
|
built
1957
410 NE 172nd St, North Miami Beach, FL 33162
$-938
Cash flow
-9.8%
Cash-on-Cash Return
3.9%
Cap rate
0.6%
Rent to Value Ratio
Active
$230,000
2
bds
|
2
ba
|
1,112
sqft
|
built
1970
2025 NE 164th St, North Miami Beach, FL 33162
$-328
Cash flow
-7.4%
Cash-on-Cash Return
4.4%
Cap rate
1.0%
Rent to Value Ratio

Active
$588,999
4
bds
|
3
ba
|
1,702
sqft
|
built
1986
14725 SW 90th Ter, Miami, FL 33196
$-999
Cash flow
-8.8%
Cash-on-Cash Return
4.1%
Cap rate
0.7%
Rent to Value Ratio
Active
$225,000
1
bds
|
2
ba
|
741
sqft
|
built
1972
3301 N Country Club Dr, Miami, FL 33180
$-596
Cash flow
-13.8%
Cash-on-Cash Return
3.0%
Cap rate
0.9%
Rent to Value Ratio

Active
$765,000
4
bds
|
3
ba
|
1,895
sqft
|
built
2017
10263 NW 72nd St, Doral, FL 33178
$-1,703
Cash flow
-11.6%
Cash-on-Cash Return
3.5%
Cap rate
0.7%
Rent to Value Ratio
Active
$1,799,000
2
bds
|
3
ba
|
1,740
sqft
|
built
2002
9595 Collins Ave, Surfside, FL 33154
$-8,331
Cash flow
-24.2%
Cash-on-Cash Return
0.6%
Cap rate
0.4%
Rent to Value Ratio
Active
$1,600,000
6
bds
|
4
ba
|
4,523
sqft
|
built
1981
9931 NW 130th St, Hialeah Gardens, FL 33018
$-4,880
Cash flow
-15.9%
Cash-on-Cash Return
2.5%
Cap rate
0.4%
Rent to Value Ratio

Active
$639,900
4
bds
|
2
ba
|
1,657
sqft
|
built
1990
13552 SW 179th St, Miami, FL 33177
$-1,534
Cash flow
-12.5%
Cash-on-Cash Return
3.3%
Cap rate
0.5%
Rent to Value Ratio
Active
$355,000
1
bds
|
1
ba
|
735
sqft
|
built
1990
770 Claughton Island Dr, Miami, FL 33131
$-1,681
Cash flow
-24.7%
Cash-on-Cash Return
0.5%
Cap rate
0.7%
Rent to Value Ratio
Active
$430,000
3
bds
|
2
ba
|
1,404
sqft
|
built
1981
267 NE 201st Ter, Miami, FL 33179
$-587
Cash flow
-7.1%
Cash-on-Cash Return
4.5%
Cap rate
0.7%
Rent to Value Ratio

Active
$355,000
1
bds
|
2
ba
|
1,005
sqft
|
built
1972
19380 Collins Ave, Sunny Isles Beach, FL 33160
$-1,466
Cash flow
-21.5%
Cash-on-Cash Return
1.2%
Cap rate
0.6%
Rent to Value Ratio

Active
$485,000
2
bds
|
3
ba
|
1,113
sqft
|
built
2006
690 SW 1st Ct, Miami, FL 33130
$-2,056
Cash flow
-22.1%
Cash-on-Cash Return
1.1%
Cap rate
0.7%
Rent to Value Ratio

Active
$364,000
2
bds
|
1
ba
|
1,017
sqft
|
built
1979
510 W Park Dr, Miami, FL 33172
$-642
Cash flow
-9.2%
Cash-on-Cash Return
4.0%
Cap rate
0.7%
Rent to Value Ratio
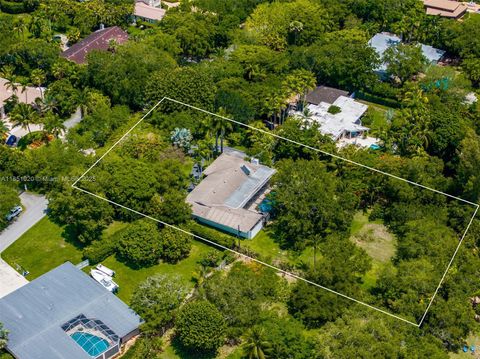
Active
$798,017
4
bds
|
2
ba
|
1,729
sqft
|
built
1947
5410 SW 2nd St, Coral Gables, FL 33134
$-2,365
Cash flow
-15.5%
Cash-on-Cash Return
2.6%
Cap rate
0.4%
Rent to Value Ratio
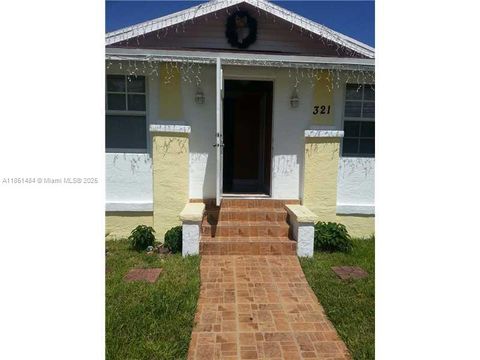
Active
$895,000
2
bds
|
1
ba
|
1,086
sqft
|
built
1923
321 NW 13th Ave, Miami, FL 33125
$-2,949
Cash flow
-17.2%
Cash-on-Cash Return
2.2%
Cap rate
0.3%
Rent to Value Ratio
Active
$450,000
3
bds
|
2
ba
|
1,190
sqft
|
built
1995
7692 NW 178th Ter, Hialeah, FL 33015
$-530
Cash flow
-6.1%
Cash-on-Cash Return
4.7%
Cap rate
0.6%
Rent to Value Ratio

Active
$495,000
3
bds
|
2
ba
|
1,143
sqft
|
built
1985
3571 Magellan Cir, Aventura, FL 33180
$-1,184
Cash flow
-12.5%
Cash-on-Cash Return
3.3%
Cap rate
0.8%
Rent to Value Ratio
Active
$399,900
2
bds
|
2
ba
|
1,693
sqft
|
built
1974
2851 NE 183rd St, Aventura, FL 33160
$-2,016
Cash flow
-26.3%
Cash-on-Cash Return
0.1%
Cap rate
0.7%
Rent to Value Ratio
Active
$350,000
3
bds
|
2
ba
|
1,190
sqft
|
built
1971
9125 SW 77th Ave, Miami, FL 33156
$-670
Cash flow
-10.0%
Cash-on-Cash Return
3.9%
Cap rate
0.8%
Rent to Value Ratio
Active
$1,330,000
2
bds
|
2
ba
|
955
sqft
|
built
2023
700 NE 26th Ter, Miami, FL 33137
$-4,628
Cash flow
-18.2%
Cash-on-Cash Return
2.0%
Cap rate
0.5%
Rent to Value Ratio
Active
$3,400,000
3
bds
|
3
ba
|
2,656
sqft
|
built
2008
4050 Hardie Ave, Miami, FL 33133
$-14,069
Cash flow
-21.6%
Cash-on-Cash Return
1.2%
Cap rate
0.3%
Rent to Value Ratio
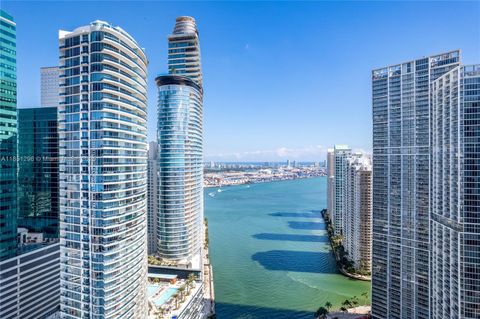
Active
$539,900
1
bds
|
2
ba
|
777
sqft
|
built
2014
1300 Brickell Bay Dr, Miami, FL 33131
$-974
Cash flow
-9.4%
Cash-on-Cash Return
4.0%
Cap rate
0.8%
Rent to Value Ratio
Active
$405,000
4
bds
|
4
ba
|
1,434
sqft
|
built
2021
25876 SW 139th Path, Homestead, FL 33032
$-809
Cash flow
-10.4%
Cash-on-Cash Return
3.8%
Cap rate
0.7%
Rent to Value Ratio
Active
$695,000
1
bds
|
1
ba
|
1,025
sqft
|
built
1941
6256 SW 32nd St, Miami, FL 33155
$-2,002
Cash flow
-15.0%
Cash-on-Cash Return
2.7%
Cap rate
0.5%
Rent to Value Ratio
Active
$625,000
4
bds
|
0
ba
|
1,560
sqft
|
built
1948
1521 NE 131st St, North Miami, FL 33161
$-2,035
Cash flow
-17.0%
Cash-on-Cash Return
2.2%
Cap rate
0.4%
Rent to Value Ratio
Active
$685,000
3
bds
|
3
ba
|
1,898
sqft
|
built
1995
5224 NW 103rd Ave, Doral, FL 33178
$-1,628
Cash flow
-12.4%
Cash-on-Cash Return
3.3%
Cap rate
0.6%
Rent to Value Ratio
Active
$3,250,000
4
bds
|
3
ba
|
2,747
sqft
|
built
1969
12365 SW 60th Ct, Pinecrest, FL 33156
$-13,553
Cash flow
-21.8%
Cash-on-Cash Return
1.1%
Cap rate
0.2%
Rent to Value Ratio

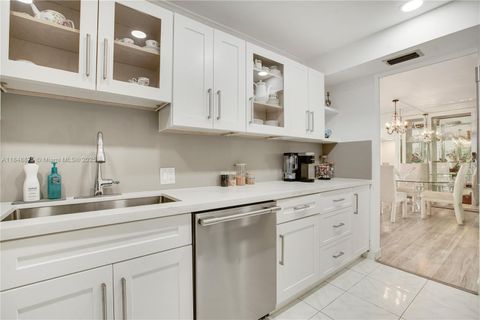
Active
$585,000
1
bds
|
1
ba
|
731
sqft
|
built
1960
1500 Bay Rd, Miami Beach, FL 33139
$-2,296
Cash flow
-20.5%
Cash-on-Cash Return
1.4%
Cap rate
0.6%
Rent to Value Ratio

Active
$649,000
3
bds
|
2
ba
|
1,766
sqft
|
built
1964
19630 Sterling Dr, Cutler Bay, FL 33157
$-1,337
Cash flow
-10.7%
Cash-on-Cash Return
3.7%
Cap rate
0.5%
Rent to Value Ratio
Active
$1,199,000
2
bds
|
3
ba
|
1,500
sqft
|
built
2008
200 Biscayne Boulevard Way, Miami, FL 33131
$-5,368
Cash flow
-23.4%
Cash-on-Cash Return
0.8%
Cap rate
0.5%
Rent to Value Ratio
Active
$384,900
2
bds
|
2
ba
|
1,313
sqft
|
built
1975
20301 W Country Club Dr, Aventura, FL 33180
$-1,732
Cash flow
-23.5%
Cash-on-Cash Return
0.7%
Cap rate
0.8%
Rent to Value Ratio

Active
$320,000
2
bds
|
2
ba
|
990
sqft
|
built
1972
9460 Fontainebleau Blvd, Miami, FL 33172
$-707
Cash flow
-11.5%
Cash-on-Cash Return
3.5%
Cap rate
0.8%
Rent to Value Ratio
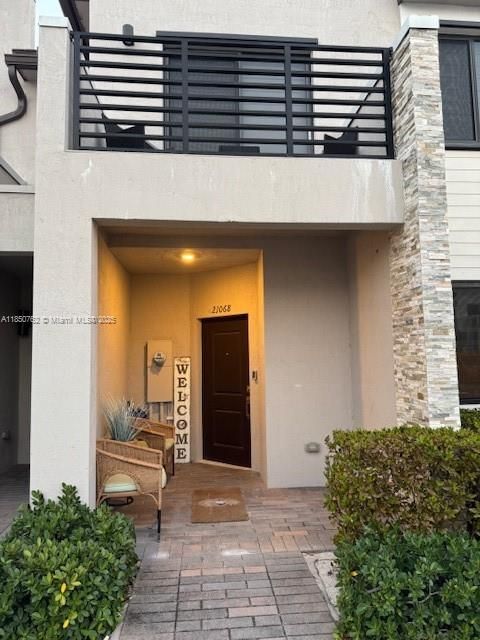
Active
$515,000
3
bds
|
4
ba
|
1,662
sqft
|
built
2021
21068 NE 8th Ave, Miami, FL 33179
$-1,427
Cash flow
-14.5%
Cash-on-Cash Return
2.8%
Cap rate
0.6%
Rent to Value Ratio
Active
$1,300,000
5
bds
|
4
ba
|
2,337
sqft
|
built
2005
11 NE 151st St, Miami, FL 33162
$-4,486
Cash flow
-18.0%
Cash-on-Cash Return
2.0%
Cap rate
0.3%
Rent to Value Ratio

Active
$295,000
1
bds
|
2
ba
|
768
sqft
|
built
1969
1340 Lincoln Rd, Miami Beach, FL 33139
$-633
Cash flow
-11.2%
Cash-on-Cash Return
3.6%
Cap rate
0.9%
Rent to Value Ratio

Active
$490,000
1
bds
|
1
ba
|
837
sqft
|
built
1965
1200 West Ave, Miami Beach, FL 33139
$-1,539
Cash flow
-16.4%
Cash-on-Cash Return
2.4%
Cap rate
0.7%
Rent to Value Ratio

Active
$2,400,000
5
bds
|
6
ba
|
5,504
sqft
|
built
2021
8173 NW 47th Ter, Doral, FL 33166
$-10,675
Cash flow
-23.2%
Cash-on-Cash Return
0.8%
Cap rate
0.3%
Rent to Value Ratio