Miami Dade County Investment Properties for Sale
Browse homes for sale and investment properties in Miami Dade County. Refine your search by price, property type, or more.
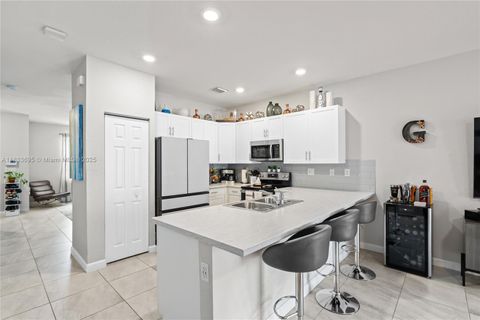
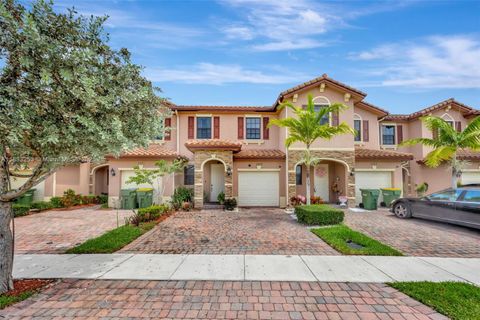
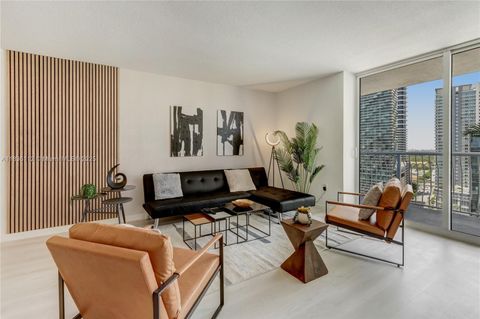
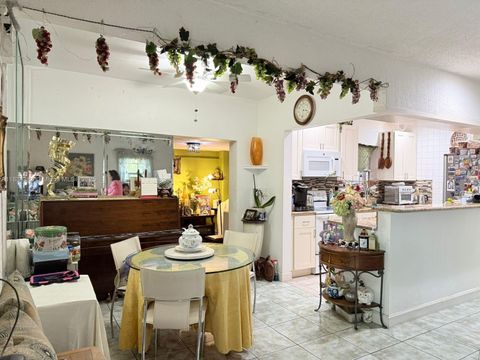
Best cash flowing properties in Miami Dade County
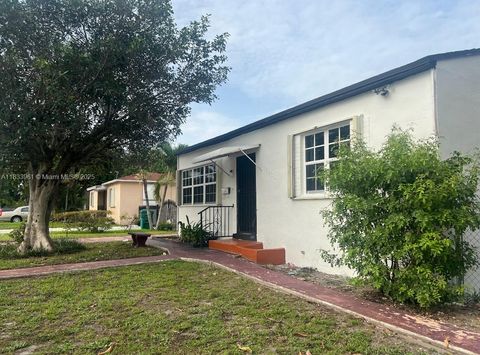
Active
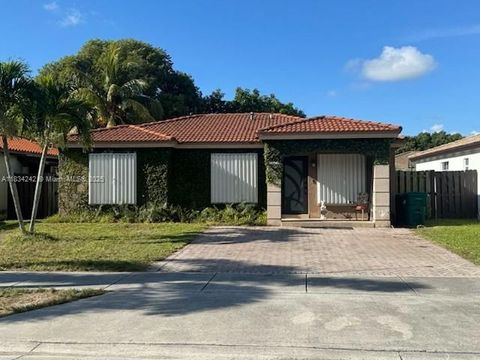
$265,000
2
bds
|
3
ba
|
1,260
sqft
|
built
1979
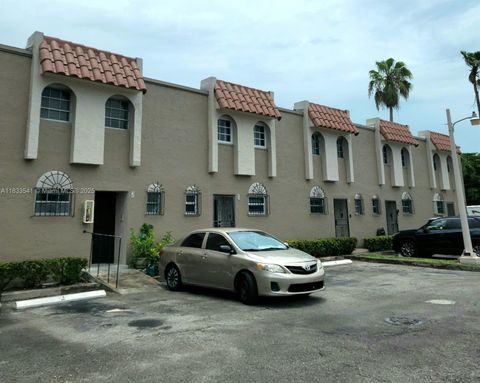
11 Olive Dr, Hialeah, FL 33010
$-177
Cash flow
-3.5%
Cash-on-Cash Return
5.3%
Cap rate
0.9%
Rent to Value Ratio
Active
$174,900
bds
|
1
ba
|
560
sqft
|
built
1967
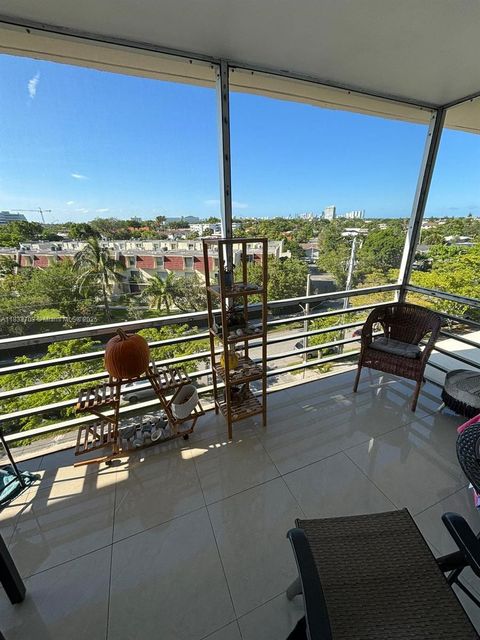
1750 NE 115th St, Miami, FL 33181
$-360
Cash flow
-10.7%
Cash-on-Cash Return
3.7%
Cap rate
1.1%
Rent to Value Ratio
10,000 out of 12,024 properties for sale in Miami Dade County
Limited Results Shown
Create a free account, or log in to reveal all property listings and enjoy the complete experience.
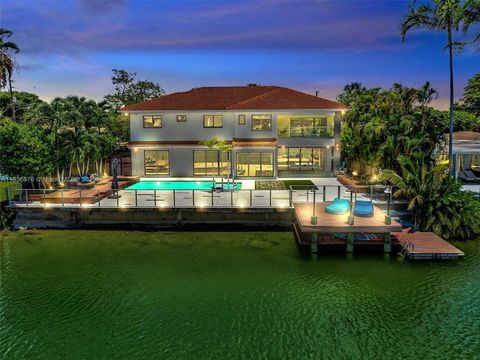
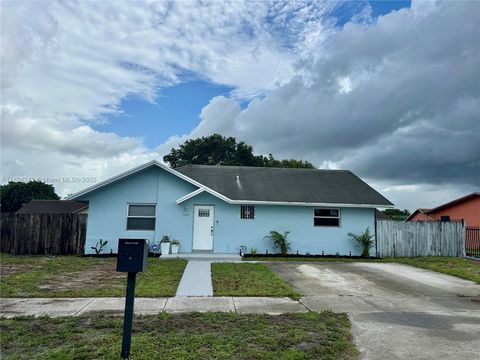
Active
$529,000
3
bds
|
1
ba
|
1,131
sqft
|
built
1949
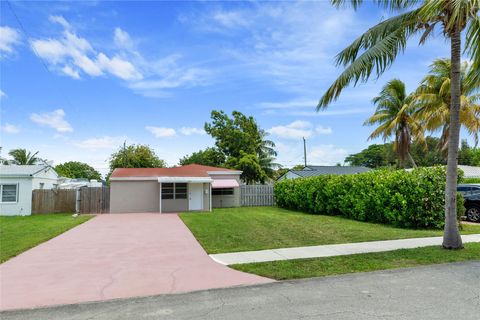
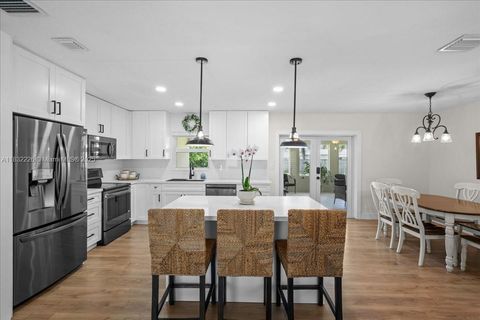
2071 NE 180th St, North Miami Beach, FL 33162
$-1,081
Cash flow
-10.7%
Cash-on-Cash Return
3.7%
Cap rate
0.6%
Rent to Value Ratio
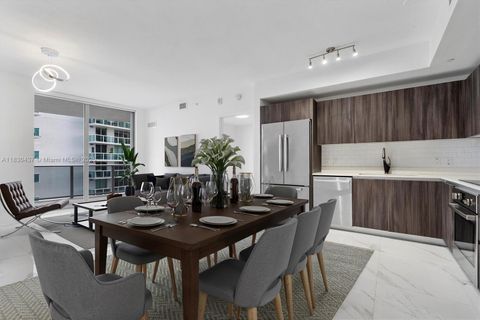
Active
$845,000
4
bds
|
3
ba
|
2,235
sqft
|
built
1971
9360 SW 185th St, Cutler Bay, FL 33157
$-2,127
Cash flow
-13.1%
Cash-on-Cash Return
3.1%
Cap rate
0.4%
Rent to Value Ratio
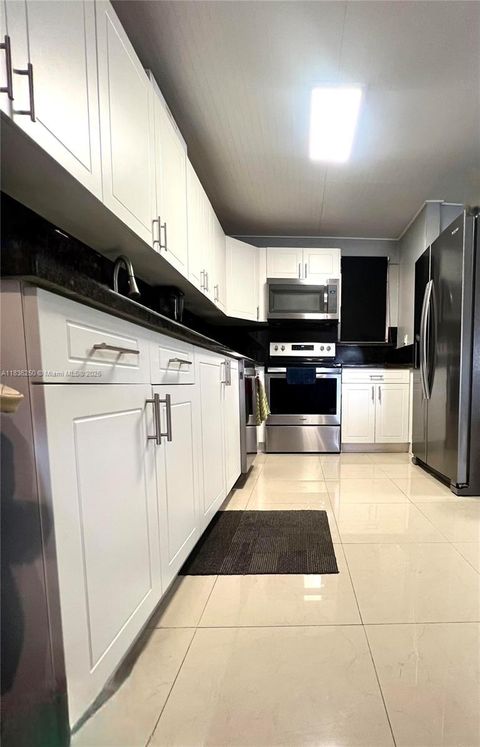
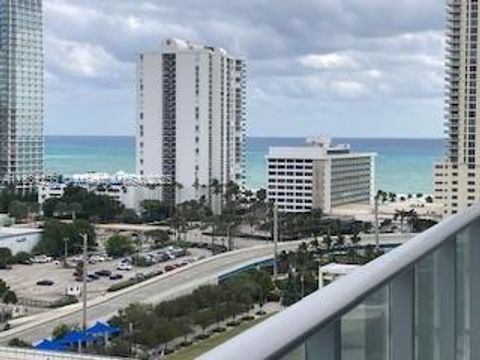
Active
$699,000
1
bds
|
1
ba
|
895
sqft
|
built
2004
1331 Brickell Bay Dr, Miami, FL 33131
$-3,315
Cash flow
-24.7%
Cash-on-Cash Return
0.5%
Cap rate
0.6%
Rent to Value Ratio
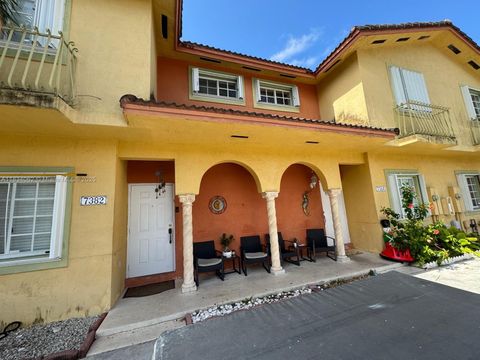
Active
$350,000
2
bds
|
3
ba
|
1,050
sqft
|
built
1999
7382 SW 152nd Ave, Miami, FL 33193
$-800
Cash flow
-11.9%
Cash-on-Cash Return
3.4%
Cap rate
0.7%
Rent to Value Ratio
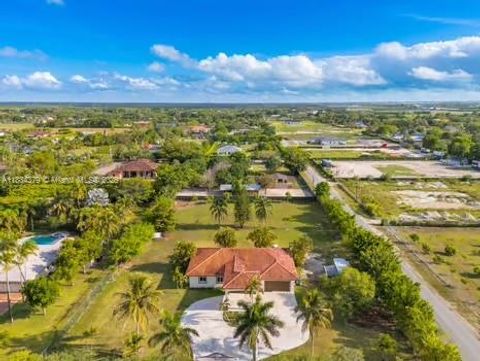
Active
$1,595,000
5
bds
|
4
ba
|
3,094
sqft
|
built
2004
19520 SW 206th St, Miami, FL 33187
$-2,548
Cash flow
-8.3%
Cash-on-Cash Return
4.2%
Cap rate
0.6%
Rent to Value Ratio
Active
$559,000
4
bds
|
2
ba
|
1,083
sqft
|
built
1953
22020 SW 115th Ct, Miami, FL 33170
$-1,807
Cash flow
-16.9%
Cash-on-Cash Return
2.3%
Cap rate
0.4%
Rent to Value Ratio
Active
$499,990
3
bds
|
3
ba
|
1,540
sqft
|
built
2018
10468 W 33rd Ln, Hialeah, FL 33018
$-1,114
Cash flow
-11.6%
Cash-on-Cash Return
3.5%
Cap rate
0.6%
Rent to Value Ratio
Active
$380,000
3
bds
|
3
ba
|
1,566
sqft
|
built
2017
3777 SE 1st St, Homestead, FL 33033
$-1,103
Cash flow
-15.1%
Cash-on-Cash Return
2.7%
Cap rate
0.7%
Rent to Value Ratio
Active
$820,000
3
bds
|
2
ba
|
1,232
sqft
|
built
2004
1200 Brickell Bay Dr, Miami, FL 33131
$-2,743
Cash flow
-17.5%
Cash-on-Cash Return
2.1%
Cap rate
0.5%
Rent to Value Ratio
Active
$520,000
2
bds
|
1
ba
|
1,294
sqft
|
built
1956
1535 NE 171st St, North Miami Beach, FL 33162
$-851
Cash flow
-8.5%
Cash-on-Cash Return
4.2%
Cap rate
0.6%
Rent to Value Ratio
Active
$750,000
2
bds
|
2
ba
|
1,464
sqft
|
built
1986
1717 N Bayshore Dr, Miami, FL 33132
$-2,417
Cash flow
-16.8%
Cash-on-Cash Return
2.3%
Cap rate
0.7%
Rent to Value Ratio
Active
$435,000
1
bds
|
2
ba
|
1,197
sqft
|
built
2008
350 S Miami Ave, Miami, FL 33130
$-1,950
Cash flow
-23.4%
Cash-on-Cash Return
0.8%
Cap rate
0.7%
Rent to Value Ratio

Active
$1,199,000
2
bds
|
2
ba
|
1,645
sqft
|
built
2018
455 NE 39th St, Miami, FL 33137
$-3,292
Cash flow
-14.3%
Cash-on-Cash Return
2.9%
Cap rate
0.6%
Rent to Value Ratio
Active
$500,000
3
bds
|
2
ba
|
1,308
sqft
|
built
1959
18900 NW 19th Ave, Miami Gardens, FL 33056
$-975
Cash flow
-10.2%
Cash-on-Cash Return
3.8%
Cap rate
0.6%
Rent to Value Ratio
Active
$2,790,000
2
bds
|
3
ba
|
1,487
sqft
|
built
2009
17121 Collins Ave, Sunny Isles Beach, FL 33160
$-13,005
Cash flow
-24.3%
Cash-on-Cash Return
0.6%
Cap rate
0.3%
Rent to Value Ratio
Active
$1,380,000
1
bds
|
2
ba
|
1,063
sqft
|
built
2008
4391 Collins Ave, Miami Beach, FL 33140
$-5,847
Cash flow
-22.1%
Cash-on-Cash Return
1.1%
Cap rate
0.4%
Rent to Value Ratio
Active
$569,000
2
bds
|
2
ba
|
1,266
sqft
|
built
1969
1020 Meridian Ave, Miami Beach, FL 33139
$-1,652
Cash flow
-15.1%
Cash-on-Cash Return
2.7%
Cap rate
0.7%
Rent to Value Ratio

Active
$734,900
2
bds
|
2
ba
|
1,506
sqft
|
built
1965
770 NE 69th St, Miami, FL 33138
$-3,756
Cash flow
-26.7%
Cash-on-Cash Return
0.0%
Cap rate
0.6%
Rent to Value Ratio
Active
$360,000
2
bds
|
2
ba
|
895
sqft
|
built
1972
1455 West Ave, Miami Beach, FL 33139
$-793
Cash flow
-11.5%
Cash-on-Cash Return
3.5%
Cap rate
0.9%
Rent to Value Ratio
Active
$1,099,000
3
bds
|
2
ba
|
1,648
sqft
|
built
2009
150 Sunny Isles Blvd, Sunny Isles Beach, FL 33160
$-3,138
Cash flow
-14.9%
Cash-on-Cash Return
2.7%
Cap rate
0.6%
Rent to Value Ratio
Active
$395,000
3
bds
|
1
ba
|
1,022
sqft
|
built
1949
8921 NW 17th Ave, Miami, FL 33147
$-553
Cash flow
-7.3%
Cash-on-Cash Return
4.5%
Cap rate
0.7%
Rent to Value Ratio
Active
$3,250,000
6
bds
|
6
ba
|
4,444
sqft
|
built
1995
2320 NE 211th St, Miami, FL 33180
$-12,919
Cash flow
-20.7%
Cash-on-Cash Return
1.4%
Cap rate
0.2%
Rent to Value Ratio
Active
$525,000
1
bds
|
2
ba
|
759
sqft
|
built
2018
488 NE 18th St, Miami, FL 33132
$-1,346
Cash flow
-13.4%
Cash-on-Cash Return
3.1%
Cap rate
0.8%
Rent to Value Ratio

Active
$675,000
2
bds
|
2
ba
|
1,084
sqft
|
built
2018
501 NE 31st St, Miami, FL 33137
$-2,838
Cash flow
-21.9%
Cash-on-Cash Return
1.1%
Cap rate
0.7%
Rent to Value Ratio

Active
$184,500
0
bds
|
1
ba
|
416
sqft
|
built
1947
503 75th St, Miami Beach, FL 33141
$-385
Cash flow
-10.9%
Cash-on-Cash Return
3.6%
Cap rate
0.9%
Rent to Value Ratio
Active
$325,000
3
bds
|
2
ba
|
1,309
sqft
|
built
1973
1810 W 56th St, Hialeah, FL 33012
$-405
Cash flow
-6.5%
Cash-on-Cash Return
4.7%
Cap rate
0.9%
Rent to Value Ratio
Active
$520,000
3
bds
|
2
ba
|
1,183
sqft
|
built
2004
13874 SW 256th Ter, Homestead, FL 33032
$-884
Cash flow
-8.9%
Cash-on-Cash Return
4.1%
Cap rate
0.6%
Rent to Value Ratio
Active
$529,900
3
bds
|
2
ba
|
1,188
sqft
|
built
1989
3521 NW 193rd St, Miami Gardens, FL 33056
$-840
Cash flow
-8.3%
Cash-on-Cash Return
4.2%
Cap rate
0.6%
Rent to Value Ratio

Active
$559,000
3
bds
|
2
ba
|
1,328
sqft
|
built
1983
20000 SW 114th Ave, Miami, FL 33189
$-831
Cash flow
-7.8%
Cash-on-Cash Return
4.4%
Cap rate
0.6%
Rent to Value Ratio
Active
$1,549,000
3
bds
|
4
ba
|
1,892
sqft
|
built
2019
300 Sunny Isles Blvd, Sunny Isles Beach, FL 33160
$-5,656
Cash flow
-19.1%
Cash-on-Cash Return
1.8%
Cap rate
0.5%
Rent to Value Ratio
Active
$1,100,000
4
bds
|
3
ba
|
0
sqft
|
built
2006
20890 SW 240th St, Homestead, FL 33031
$-2,459
Cash flow
-11.7%
Cash-on-Cash Return
3.5%
Cap rate
0.5%
Rent to Value Ratio
Active
$699,000
2
bds
|
2
ba
|
1,013
sqft
|
built
2008
79 SW 12th St, Miami, FL 33130
$-2,170
Cash flow
-16.2%
Cash-on-Cash Return
2.4%
Cap rate
0.6%
Rent to Value Ratio
Active
$899,900
3
bds
|
3
ba
|
2,128
sqft
|
built
1986
5440 SW 70th Pl N, Miami, FL 33155
$-2,716
Cash flow
-15.7%
Cash-on-Cash Return
2.5%
Cap rate
0.4%
Rent to Value Ratio
Active
$2,650,000
3
bds
|
3
ba
|
2,424
sqft
|
built
1980
2 Grove Isle Dr, Miami, FL 33133
$-8,042
Cash flow
-15.8%
Cash-on-Cash Return
2.5%
Cap rate
0.4%
Rent to Value Ratio
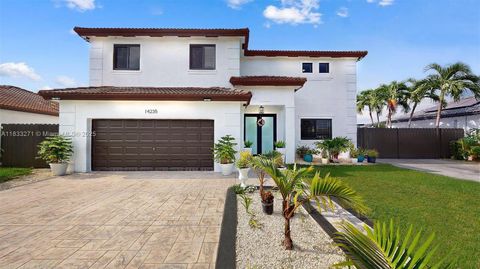
Active
$710,000
5
bds
|
3
ba
|
2,862
sqft
|
built
2004
14235 SW 294th St, Homestead, FL 33033
$-1,008
Cash flow
-7.4%
Cash-on-Cash Return
4.4%
Cap rate
0.7%
Rent to Value Ratio
Active
$685,000
2
bds
|
2
ba
|
1,200
sqft
|
built
2001
1155 Brickell Bay Dr, Miami, FL 33131
$-2,746
Cash flow
-20.9%
Cash-on-Cash Return
1.3%
Cap rate
0.6%
Rent to Value Ratio
Active
$14,900,000
7
bds
|
8
ba
|
6,169
sqft
|
built
2016
124 Park Dr, Bal Harbour, FL 33154
$-77,212
Cash flow
-27.0%
Cash-on-Cash Return
-0.1%
Cap rate
0.1%
Rent to Value Ratio

Active
$535,000
2
bds
|
2
ba
|
1,105
sqft
|
built
1950
110 SW 64th Ct, Miami, FL 33144
$-1,642
Cash flow
-16.0%
Cash-on-Cash Return
2.5%
Cap rate
0.5%
Rent to Value Ratio