Pinellas County Investment Properties for Sale
Browse homes for sale and investment properties in Pinellas County. Refine your search by price, property type, or more.
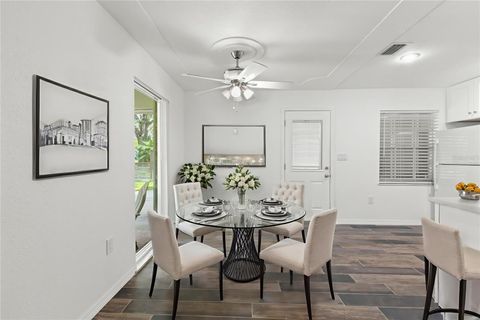
Best cash flowing properties in Pinellas County
Active
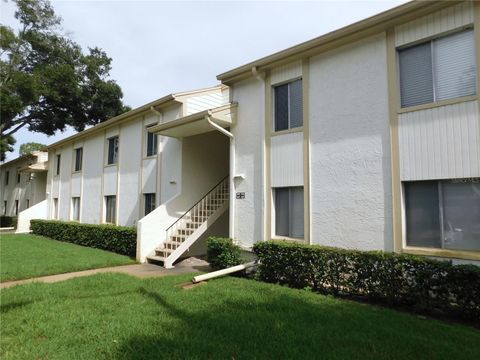
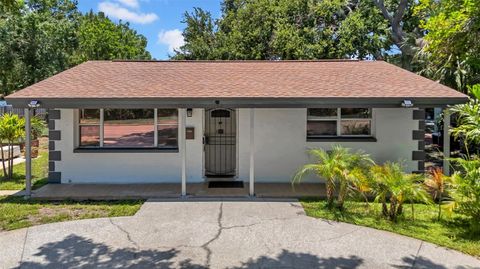
$189,999
2
bds
|
2
ba
|
1,054
sqft
|
built
1980
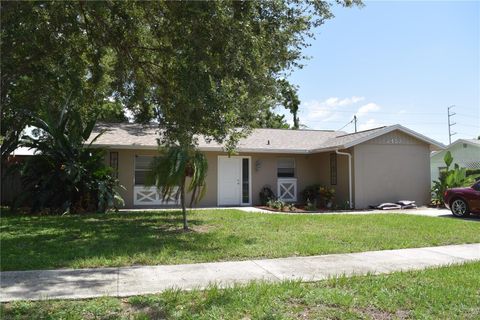
105 Palmetto Ct, Oldsmar, FL 34677
$331
Cash flow
9.1%
Cash-on-Cash Return
8.2%
Cap rate
1.2%
Rent to Value Ratio
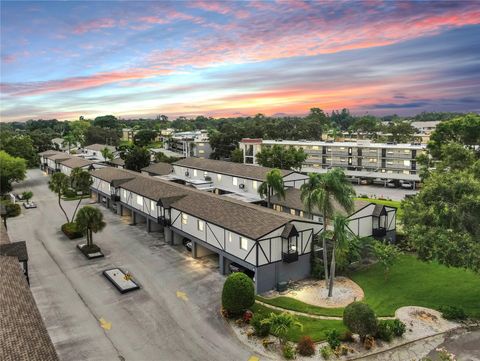
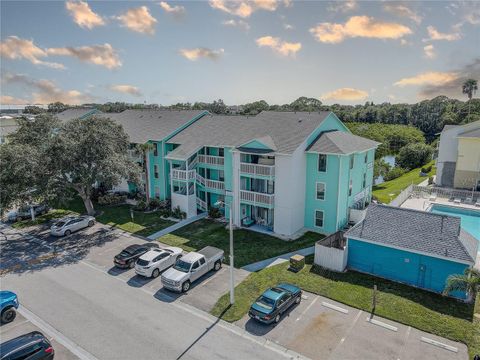
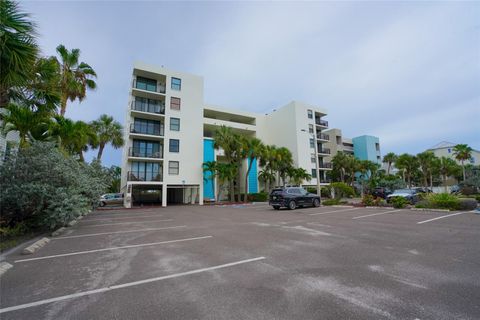
Active
$189,900
2
bds
|
2
ba
|
865
sqft
|
built
1974
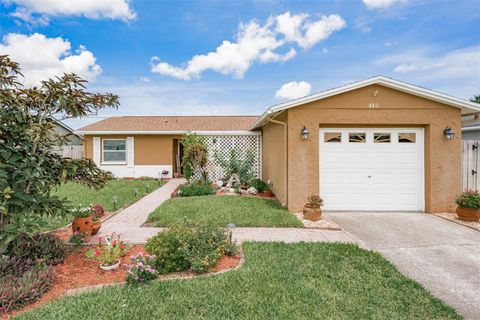
1146 King Arthur Ct, Dunedin, FL 34698
$173
Cash flow
4.8%
Cash-on-Cash Return
7.2%
Cap rate
1.1%
Rent to Value Ratio
1,995 out of 2,636 properties for sale in Pinellas County
Limited Results Shown
Create a free account, or log in to reveal all property listings and enjoy the complete experience.
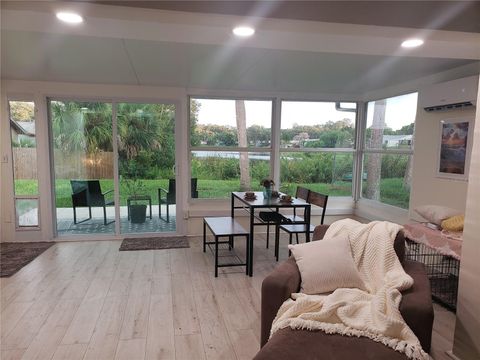
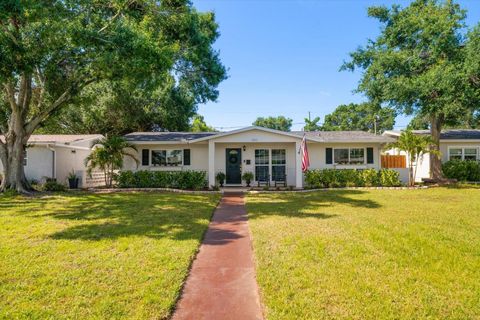
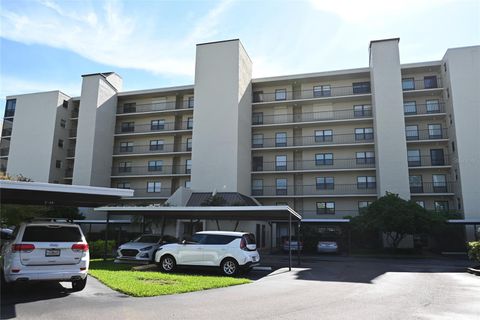
Active
$520,000
4
bds
|
2
ba
|
1,985
sqft
|
built
1979
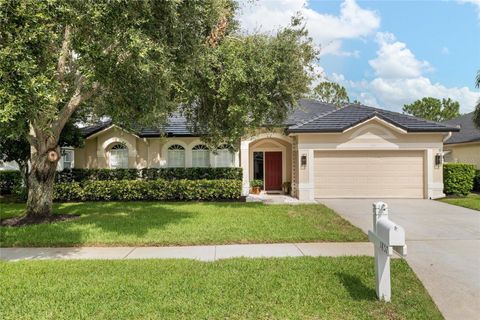
1737 Solon Ave, Dunedin, FL 34698
$-1,073
Cash flow
-10.8%
Cash-on-Cash Return
3.7%
Cap rate
0.5%
Rent to Value Ratio
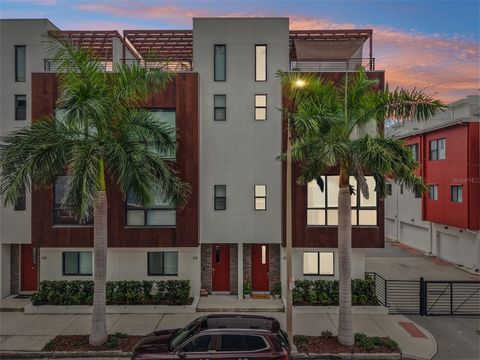
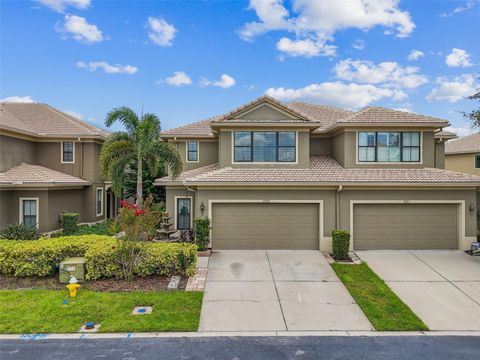
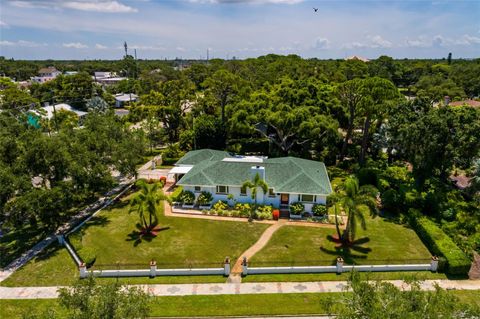
Active
$939,000
3
bds
|
4
ba
|
2,089
sqft
|
built
2017
811 Arlington Ave N, Saint Petersburg, FL 33701
$-2,874
Cash flow
-16.0%
Cash-on-Cash Return
2.5%
Cap rate
0.5%
Rent to Value Ratio
Active
$639,000
3
bds
|
2
ba
|
1,632
sqft
|
built
1984
818 Eunice Dr, Tarpon Springs, FL 34689
$-1,508
Cash flow
-12.3%
Cash-on-Cash Return
3.3%
Cap rate
0.5%
Rent to Value Ratio
Active
$499,900
3
bds
|
2
ba
|
1,576
sqft
|
built
2020
960 Starkey Rd, Largo, FL 33771
$-1,459
Cash flow
-15.2%
Cash-on-Cash Return
2.6%
Cap rate
0.6%
Rent to Value Ratio
Active
$499,000
2
bds
|
2
ba
|
2,040
sqft
|
built
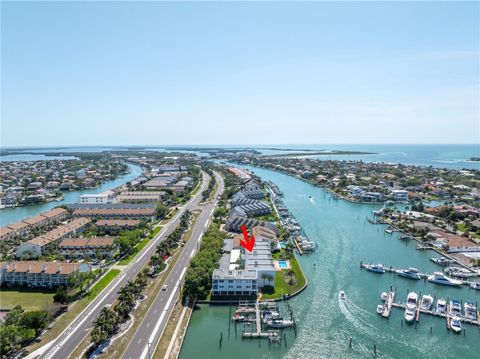
2006
7901 Seminole Blvd, Seminole, FL 33772
$-827
Cash flow
-8.6%
Cash-on-Cash Return
4.2%
Cap rate
0.6%
Rent to Value Ratio
Active
$2,399,000
7
bds
|
5
ba
|
4,401
sqft
|
built
2021
439 Bayview Dr NE, Saint Petersburg, FL 33704
$-11,035
Cash flow
-24.0%
Cash-on-Cash Return
0.6%
Cap rate
0.2%
Rent to Value Ratio
Active
$340,000
2
bds
|
3
ba
|
1,400
sqft
|
built
2009
558 Harbor Ridge Dr, Palm Harbor, FL 34683
$-675
Cash flow
-10.4%
Cash-on-Cash Return
3.8%
Cap rate
0.7%
Rent to Value Ratio
Active
$789,000
2
bds
|
2
ba
|
1,400
sqft
|
built
1982
18400 Gulf Blvd, Indian Shores, FL 33785
$-1,961
Cash flow
-13.0%
Cash-on-Cash Return
3.2%
Cap rate
0.5%
Rent to Value Ratio
Active
$165,000
2
bds
|
1
ba
|
660
sqft
|
built
1951
3715 49th Ave N, Saint Petersburg, FL 33714
$46
Cash flow
1.5%
Cash-on-Cash Return
6.5%
Cap rate
1.0%
Rent to Value Ratio
Active
$1,125,000
3
bds
|
3
ba
|
1,450
sqft
|
built
1982
17450 Gulf Blvd, Redington Shores, FL 33708
$-4,481
Cash flow
-20.8%
Cash-on-Cash Return
1.4%
Cap rate
0.3%
Rent to Value Ratio
Active
$295,000
2
bds
|
1
ba
|
759
sqft
|
built
1962
762 77th Ave N, Saint Petersburg, FL 33702
$-395
Cash flow
-7.0%
Cash-on-Cash Return
4.5%
Cap rate
0.6%
Rent to Value Ratio
Active
$264,900
3
bds
|
2
ba
|
1,128
sqft
|
built
1985
455 Alt 19 S, Palm Harbor, FL 34683
$-304
Cash flow
-6.0%
Cash-on-Cash Return
4.8%
Cap rate
0.8%
Rent to Value Ratio
Active
$369,000
2
bds
|
1
ba
|
1,145
sqft
|
built
1955
652 42nd Ave NE, Saint Petersburg, FL 33703
$-578
Cash flow
-8.2%
Cash-on-Cash Return
4.3%
Cap rate
0.6%
Rent to Value Ratio
Active
$499,999
4
bds
|
4
ba
|
2,670
sqft
|
built
2013
7929 Tasso Ct, Seminole, FL 33777
$-1,087
Cash flow
-11.3%
Cash-on-Cash Return
3.5%
Cap rate
0.8%
Rent to Value Ratio
Active
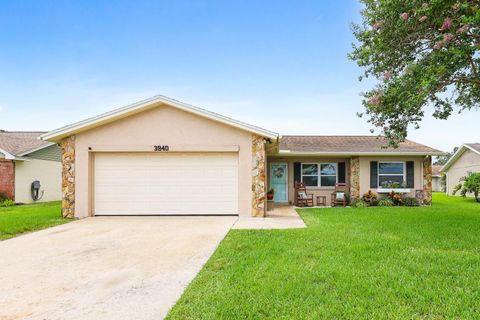
$385,000
2
bds
|
2
ba
|
1,244
sqft
|
built
1985
3940 108th Ave N, Clearwater, FL 33762
$-845
Cash flow
-11.5%
Cash-on-Cash Return
3.5%
Cap rate
0.6%
Rent to Value Ratio
Active
$540,000
4
bds
|
3
ba
|
2,018
sqft
|
built
1966
7398 Windsor Ln, Clearwater, FL 33764
$-980
Cash flow
-9.5%
Cash-on-Cash Return
4.0%
Cap rate
0.5%
Rent to Value Ratio
Active
$450,000
4
bds
|
2
ba
|
2,058
sqft
|
built
2001
1877 Wood Brook St, Tarpon Springs, FL 34689
$-725
Cash flow
-8.4%
Cash-on-Cash Return
4.2%
Cap rate
0.7%
Rent to Value Ratio
Active
$1,595,999
5
bds
|
6
ba
|
4,206
sqft
|
built
1958
1020 Charles St, Clearwater, FL 33755
$-3,733
Cash flow
-12.2%
Cash-on-Cash Return
3.3%
Cap rate
0.5%
Rent to Value Ratio
Active
$374,900
3
bds
|
2
ba
|
1,075
sqft
|
built
1965
8431 Riverside Dr NE, Saint Petersburg, FL 33702
$-349
Cash flow
-4.9%
Cash-on-Cash Return
5.0%
Cap rate
0.8%
Rent to Value Ratio
Active
$699,000
2
bds
|
2
ba
|
1,100
sqft
|
built
1981
19931 Gulf Blvd, Indian Shores, FL 33785
$-1,865
Cash flow
-13.9%
Cash-on-Cash Return
2.9%
Cap rate
0.5%
Rent to Value Ratio
Active
$225,000
2
bds
|
2
ba
|
1,070
sqft
|
built
1980
2800 Cove Cay Dr, Clearwater, FL 33760
$-99
Cash flow
-2.3%
Cash-on-Cash Return
5.6%
Cap rate
0.9%
Rent to Value Ratio
Active
$759,000
3
bds
|
2
ba
|
1,886
sqft
|
built
1948
100 Park St S, Saint Petersburg, FL 33707
$-1,889
Cash flow
-13.0%
Cash-on-Cash Return
3.2%
Cap rate
0.4%
Rent to Value Ratio
Active
$530,000
2
bds
|
2
ba
|
1,140
sqft
|
built
1980
340 Pinellas Bayway S, Tierra Verde, FL 33715
$-2,474
Cash flow
-24.4%
Cash-on-Cash Return
0.5%
Cap rate
0.7%
Rent to Value Ratio
Active
$345,000
4
bds
|
1
ba
|
1,345
sqft
|
built
1975
2453 Raymont Dr, Clearwater, FL 33763
$-240
Cash flow
-3.6%
Cash-on-Cash Return
5.3%
Cap rate
0.7%
Rent to Value Ratio
Active
$799,000
3
bds
|
2
ba
|
1,985
sqft
|
built
1999
1857 Riveredge Dr, Tarpon Springs, FL 34689
$-2,686
Cash flow
-17.5%
Cash-on-Cash Return
2.1%
Cap rate
0.4%
Rent to Value Ratio
Active
$397,500
3
bds
|
2
ba
|
1,128
sqft
|
built
1979
6411 Elmhurst Ct, Pinellas Park, FL 33782
$-607
Cash flow
-8.0%
Cash-on-Cash Return
4.3%
Cap rate
0.6%
Rent to Value Ratio
Active
$1,399,000
3
bds
|
2
ba
|
1,855
sqft
|
built
1962
600 115th Ave, Treasure Island, FL 33706
$-4,097
Cash flow
-15.3%
Cash-on-Cash Return
2.6%
Cap rate
0.4%
Rent to Value Ratio
Active
$510,000
4
bds
|
2
ba
|
1,671
sqft
|
built
1979
10302 Oakhaven Dr, Pinellas Park, FL 33782
$-716
Cash flow
-7.3%
Cash-on-Cash Return
4.5%
Cap rate
0.7%
Rent to Value Ratio
Active
$499,000
4
bds
|
2
ba
|
1,628
sqft
|
built
1972
2908 Edenwood St, Clearwater, FL 33759
$-918
Cash flow
-9.6%
Cash-on-Cash Return
3.9%
Cap rate
0.5%
Rent to Value Ratio

Active
$385,000
3
bds
|
2
ba
|
806
sqft
|
built
1946
13707 Plymouth St, Madeira Beach, FL 33708
$-733
Cash flow
-9.9%
Cash-on-Cash Return
3.9%
Cap rate
0.6%
Rent to Value Ratio
Active
$535,000
3
bds
|
2
ba
|
1,748
sqft
|
built
1985
3104 Hillside Ln, Safety Harbor, FL 34695
$-1,058
Cash flow
-10.3%
Cash-on-Cash Return
3.8%
Cap rate
0.6%
Rent to Value Ratio
Active
$409,900
3
bds
|
1
ba
|
1,308
sqft
|
built
1955
707 63rd Ave S, Saint Petersburg, FL 33705
$-551
Cash flow
-7.0%
Cash-on-Cash Return
4.5%
Cap rate
0.7%
Rent to Value Ratio
Active
$349,000
2
bds
|
1
ba
|
1,040
sqft
|
built
1939
1900 20th Ave N, Saint Petersburg, FL 33713
$-160
Cash flow
-2.4%
Cash-on-Cash Return
5.6%
Cap rate
0.8%
Rent to Value Ratio
Active
$338,000
2
bds
|
1
ba
|
846
sqft
|
built
1969
1024 San Marco Dr, Largo, FL 33770
$-748
Cash flow
-11.5%
Cash-on-Cash Return
3.5%
Cap rate
0.5%
Rent to Value Ratio
Active
$625,000
4
bds
|
2
ba
|
1,991
sqft
|
built
1973
13344 Sorrento Dr, Largo, FL 33774
$-209
Cash flow
-1.7%
Cash-on-Cash Return
5.7%
Cap rate
0.7%
Rent to Value Ratio
Active
$660,000
3
bds
|
2
ba
|
2,713
sqft
|
built
1960
1712 Robin Hood Ln, Clearwater, FL 33764
$-1,452
Cash flow
-11.5%
Cash-on-Cash Return
3.5%
Cap rate
0.5%
Rent to Value Ratio
Active
$634,900
2
bds
|
2
ba
|
1,100
sqft
|
built
1973
19610 Gulf Blvd, Indian Shores, FL 33785
$-1,372
Cash flow
-11.3%
Cash-on-Cash Return
3.6%
Cap rate
0.6%
Rent to Value Ratio
Active
$525,000
2
bds
|
1
ba
|
898
sqft
|
built
1956
508 Dartmouth Ave E, Oldsmar, FL 34677
$-937
Cash flow
-9.3%
Cash-on-Cash Return
4.0%
Cap rate
0.5%
Rent to Value Ratio