Pinellas County Investment Properties for Sale
Browse homes for sale and investment properties in Pinellas County. Refine your search by price, property type, or more.
Best cash flowing properties in Pinellas County

Active
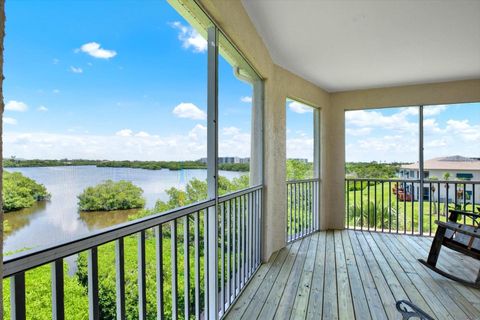
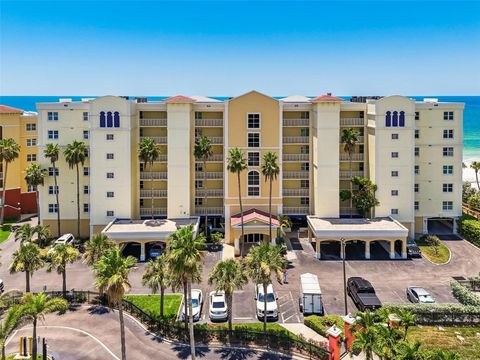
$399,999
2
bds
|
2
ba
|
1,265
sqft
|
built
1983
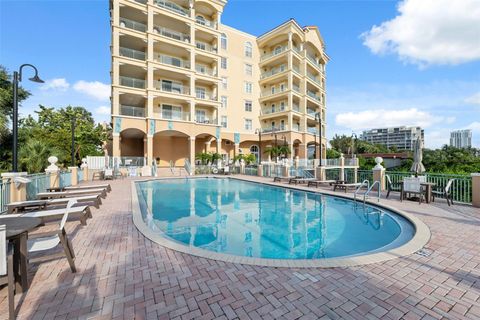
19111 Vista Bay Dr, Indian Shores, FL 33785
$60
Cash flow
0.8%
Cash-on-Cash Return
6.3%
Cap rate
0.9%
Rent to Value Ratio
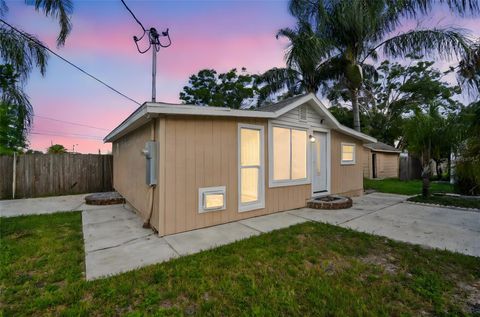
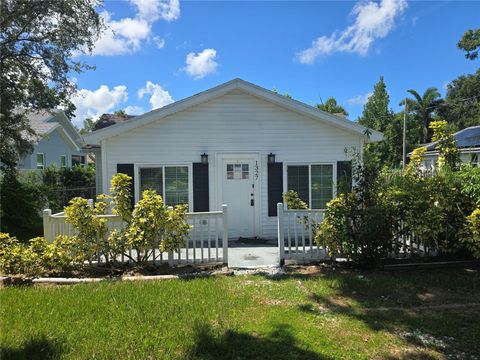
Active
$265,000
2
bds
|
1
ba
|
848
sqft
|
built
1928
711 Smith St, Clearwater, FL 33756
$-206
Cash flow
-4.1%
Cash-on-Cash Return
5.2%
Cap rate
0.8%
Rent to Value Ratio
3,843 out of 5,007 properties for sale in Pinellas County
Limited Results Shown
Create a free account, or log in to reveal all property listings and enjoy the complete experience.
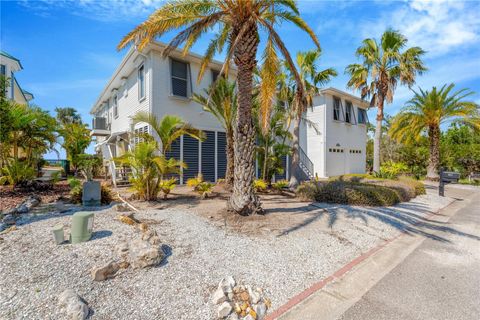
Active
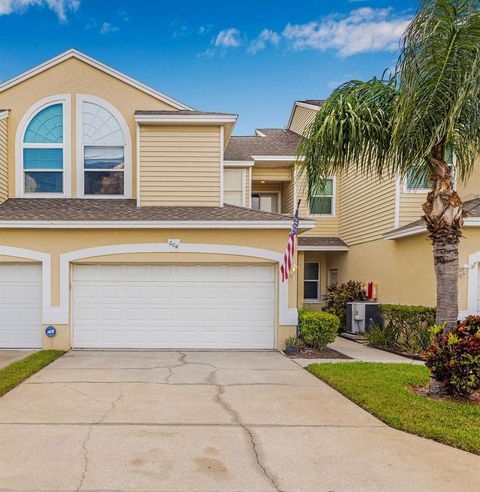
$450,000
2
bds
|
4
ba
|
1,595
sqft
|
built
2000
3107 Oyster Bayou Way, Clearwater, FL 33759
$-935
Cash flow
-10.8%
Cash-on-Cash Return
3.7%
Cap rate
0.7%
Rent to Value Ratio

Active
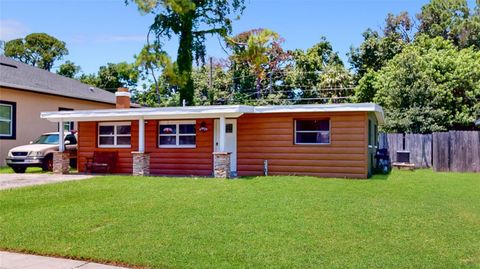
$375,000
2
bds
|
2
ba
|
1,258
sqft
|
built
1958
4744 11th Ave N, Saint Petersburg, FL 33713
$-1,036
Cash flow
-14.4%
Cash-on-Cash Return
2.8%
Cap rate
0.5%
Rent to Value Ratio
Active
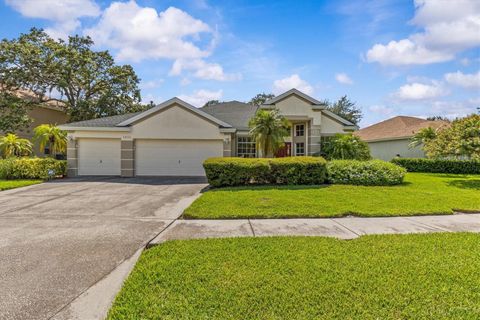
$1,299,000
4
bds
|
3
ba
|
3,348
sqft
|
built
1984
2418 Summerwood Ct, Dunedin, FL 34698
$-4,058
Cash flow
-16.3%
Cash-on-Cash Return
2.4%
Cap rate
0.3%
Rent to Value Ratio
Active
$509,000
3
bds
|
4
ba
|
2,098
sqft
|
built
1952
4964 44th Ave N, Saint Petersburg, FL 33709
$-1,251
Cash flow
-12.8%
Cash-on-Cash Return
3.2%
Cap rate
0.6%
Rent to Value Ratio

Active
$415,000
2
bds
|
3
ba
|
1,481
sqft
|
built
1974
1317 Ranchwood Dr E, Dunedin, FL 34698
$-829
Cash flow
-10.4%
Cash-on-Cash Return
3.8%
Cap rate
0.6%
Rent to Value Ratio
Active
$674,900
3
bds
|
3
ba
|
2,755
sqft
|
built
2002
6565 99th Way N, Saint Petersburg, FL 33708
$-1,372
Cash flow
-10.6%
Cash-on-Cash Return
3.7%
Cap rate
0.5%
Rent to Value Ratio

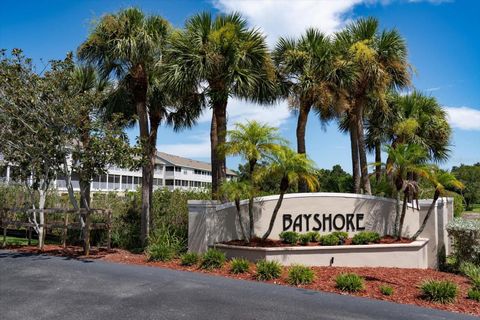
Active
$685,000
3
bds
|
2
ba
|
2,132
sqft
|
built
1978
8135 Bayshore Dr, Seminole, FL 33776
$-1,137
Cash flow
-8.7%
Cash-on-Cash Return
4.2%
Cap rate
0.6%
Rent to Value Ratio

Active
$675,000
4
bds
|
3
ba
|
2,808
sqft
|
built
1964
1596 81st Ave N, Saint Petersburg, FL 33702
$-1,048
Cash flow
-8.1%
Cash-on-Cash Return
4.3%
Cap rate
0.6%
Rent to Value Ratio
Active
$357,000
3
bds
|
3
ba
|
1,792
sqft
|
built
1996
1050 Starkey Rd, Largo, FL 33771
$-787
Cash flow
-11.5%
Cash-on-Cash Return
3.5%
Cap rate
0.7%
Rent to Value Ratio
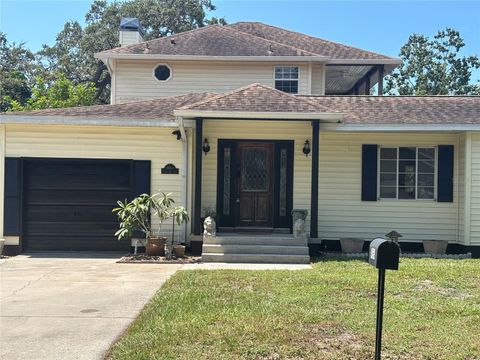
Active
$525,000
4
bds
|
3
ba
|
2,442
sqft
|
built
1998
1852 Longview Ln, Tarpon Springs, FL 34689
$-575
Cash flow
-5.7%
Cash-on-Cash Return
4.8%
Cap rate
0.7%
Rent to Value Ratio
Active
$299,900
2
bds
|
1
ba
|
888
sqft
|
built
1959
5681 94th Ter N, Pinellas Park, FL 33782
$-217
Cash flow
-3.8%
Cash-on-Cash Return
5.3%
Cap rate
0.7%
Rent to Value Ratio
Active
$465,000
2
bds
|
2
ba
|
1,319
sqft
|
built
1966
502 E Lake Dr, Largo, FL 33771
$-877
Cash flow
-9.8%
Cash-on-Cash Return
3.9%
Cap rate
0.6%
Rent to Value Ratio
Active
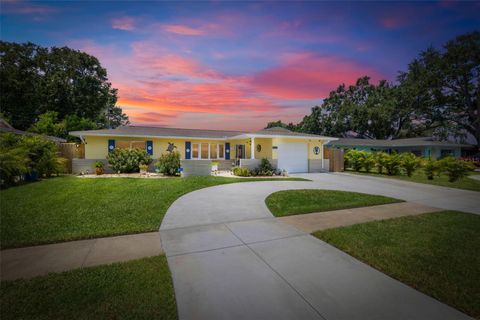
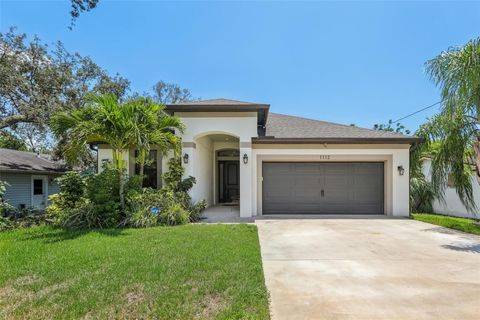
$579,000
3
bds
|
2
ba
|
1,636
sqft
|
built
2019
1112 E Boyer St, Tarpon Springs, FL 34689
$-1,267
Cash flow
-11.4%
Cash-on-Cash Return
3.5%
Cap rate
0.5%
Rent to Value Ratio
Active
$1,899,000
4
bds
|
4
ba
|
3,516
sqft
|
built
1968
7 Rosery Ln, Belleair, FL 33756
$-5,539
Cash flow
-15.2%
Cash-on-Cash Return
2.6%
Cap rate
0.4%
Rent to Value Ratio
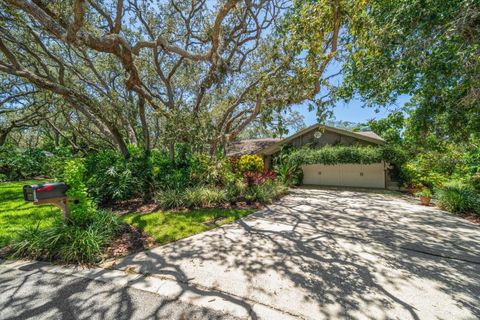
Active
$844,988
3
bds
|
2
ba
|
1,740
sqft
|
built
1979
118 Lake Shore Dr E, Palm Harbor, FL 34684
$-1,831
Cash flow
-11.3%
Cash-on-Cash Return
3.5%
Cap rate
0.5%
Rent to Value Ratio

Active
$320,000
2
bds
|
1
ba
|
804
sqft
|
built
1956
2596 38th Ave N, Saint Petersburg, FL 33713
$-382
Cash flow
-6.2%
Cash-on-Cash Return
4.7%
Cap rate
0.7%
Rent to Value Ratio
Active
$425,000
3
bds
|
2
ba
|
1,352
sqft
|
built
1982
2314 Landon Ter, Palm Harbor, FL 34683
$-728
Cash flow
-8.9%
Cash-on-Cash Return
4.1%
Cap rate
0.7%
Rent to Value Ratio

Active
$599,999
4
bds
|
4
ba
|
1,655
sqft
|
built
1925
1021 26th St N, Saint Petersburg, FL 33713
$-1,255
Cash flow
-10.9%
Cash-on-Cash Return
3.6%
Cap rate
0.5%
Rent to Value Ratio
Active
$949,000
3
bds
|
2
ba
|
2,126
sqft
|
built
1964
1110 2nd Ave S, Saint Petersburg, FL 33715
$-1,900
Cash flow
-10.4%
Cash-on-Cash Return
3.7%
Cap rate
0.6%
Rent to Value Ratio

Active
$575,000
4
bds
|
2
ba
|
1,763
sqft
|
built
1975
1688 Eden Ct, Clearwater, FL 33756
$-985
Cash flow
-8.9%
Cash-on-Cash Return
4.1%
Cap rate
0.5%
Rent to Value Ratio
Active
$1,900,000
5
bds
|
7
ba
|
5,082
sqft
|
built
2009
2555 Bryan Ln, Tarpon Springs, FL 34688
$-4,873
Cash flow
-13.4%
Cash-on-Cash Return
3.1%
Cap rate
0.5%
Rent to Value Ratio
Active
$800,000
4
bds
|
3
ba
|
2,695
sqft
|
built
1994
436 Lafayette Blvd, Oldsmar, FL 34677
$-2,227
Cash flow
-14.5%
Cash-on-Cash Return
2.8%
Cap rate
0.5%
Rent to Value Ratio

Active
$495,000
3
bds
|
2
ba
|
1,772
sqft
|
built
1973
12880 90th Ave, Seminole, FL 33776
$-522
Cash flow
-5.5%
Cash-on-Cash Return
4.9%
Cap rate
0.6%
Rent to Value Ratio
Active
$2,300,000
3
bds
|
2
ba
|
2,227
sqft
|
built
2000
16750 Gulf Blvd, North Redington Beach, FL 33708
$-11,152
Cash flow
-25.3%
Cash-on-Cash Return
0.3%
Cap rate
0.2%
Rent to Value Ratio
Active
$535,000
4
bds
|
3
ba
|
1,805
sqft
|
built
1959
1316 Dorothy Dr, Clearwater, FL 33764
$-611
Cash flow
-6.0%
Cash-on-Cash Return
4.8%
Cap rate
0.7%
Rent to Value Ratio

Active
$425,000
3
bds
|
2
ba
|
1,450
sqft
|
built
1958
1041 Jackson St, Largo, FL 33770
$-448
Cash flow
-5.5%
Cash-on-Cash Return
4.9%
Cap rate
0.7%
Rent to Value Ratio

Active
$1,424,000
4
bds
|
3
ba
|
2,600
sqft
|
built
1989
4673 Alisa Cir NE, Saint Petersburg, FL 33703
$-4,243
Cash flow
-15.5%
Cash-on-Cash Return
2.6%
Cap rate
0.5%
Rent to Value Ratio
Active
$2,100,000
4
bds
|
4
ba
|
2,990
sqft
|
built
2003
511 Seaview Dr, Tarpon Springs, FL 34689
$-8,304
Cash flow
-20.6%
Cash-on-Cash Return
1.4%
Cap rate
0.3%
Rent to Value Ratio

Active
$450,000
3
bds
|
2
ba
|
1,280
sqft
|
built
1967
347 Country Club Dr, Oldsmar, FL 34677
$-706
Cash flow
-8.2%
Cash-on-Cash Return
4.3%
Cap rate
0.6%
Rent to Value Ratio

Active
$400,000
2
bds
|
2
ba
|
988
sqft
|
built
1965
106 Avery Ave, Crystal Beach, FL 34681
$-950
Cash flow
-12.4%
Cash-on-Cash Return
3.3%
Cap rate
0.6%
Rent to Value Ratio
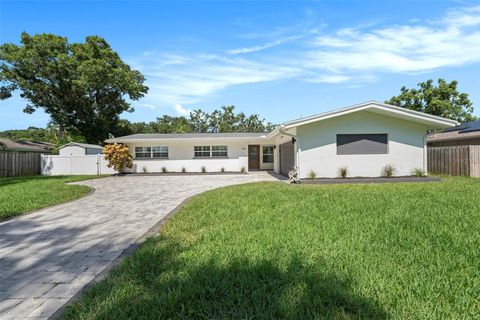
Active
$345,000
3
bds
|
2
ba
|
1,312
sqft
|
built
1925
1327 Georgia Ave, Dunedin, FL 34698
$-272
Cash flow
-4.1%
Cash-on-Cash Return
5.2%
Cap rate
0.8%
Rent to Value Ratio
Active
$680,000
2
bds
|
2
ba
|
1,593
sqft
|
built
2004
700 N Osceola Ave, Clearwater, FL 33755
$-2,038
Cash flow
-15.6%
Cash-on-Cash Return
2.6%
Cap rate
0.5%
Rent to Value Ratio
Active
$425,000
2
bds
|
1
ba
|
825
sqft
|
built
1979
5266 Beach Dr SE, Saint Petersburg, FL 33705
$-747
Cash flow
-9.2%
Cash-on-Cash Return
4.0%
Cap rate
0.7%
Rent to Value Ratio

Active
$332,000
3
bds
|
3
ba
|
1,793
sqft
|
built
2005
408 Bayou Village Dr, Tarpon Springs, FL 34689
$-478
Cash flow
-7.5%
Cash-on-Cash Return
4.4%
Cap rate
0.8%
Rent to Value Ratio
Active
$610,000
3
bds
|
2
ba
|
1,836
sqft
|
built
2020
960 Starkey Rd, Largo, FL 33771
$-1,669
Cash flow
-14.3%
Cash-on-Cash Return
2.9%
Cap rate
0.6%
Rent to Value Ratio
Active
$4,500,000
5
bds
|
0
ba
|
3,090
sqft
|
built
1932
516 Gulf Blvd, Indian Rocks Beach, FL 33785
$-22,666
Cash flow
-26.3%
Cash-on-Cash Return
0.1%
Cap rate
0.1%
Rent to Value Ratio
Active
$299,000
2
bds
|
1
ba
|
748
sqft
|
built
1956
326 50th Ave N, Saint Petersburg, FL 33703
$-530
Cash flow
-9.2%
Cash-on-Cash Return
4.0%
Cap rate
0.7%
Rent to Value Ratio

Active
$415,000
3
bds
|
2
ba
|
1,272
sqft
|
built
1965
1751 El Trinidad Dr E, Clearwater, FL 33759
$-506
Cash flow
-6.4%
Cash-on-Cash Return
4.7%
Cap rate
0.7%
Rent to Value Ratio