Pinellas County Investment Properties for Sale
Browse homes for sale and investment properties in Pinellas County. Refine your search by price, property type, or more.
Best cash flowing properties in Pinellas County
Active
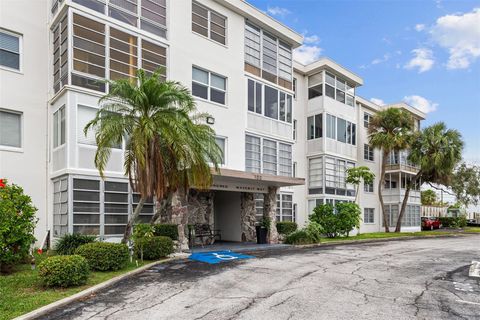
$179,000
2
bds
|
2
ba
|
830
sqft
|
built
1971
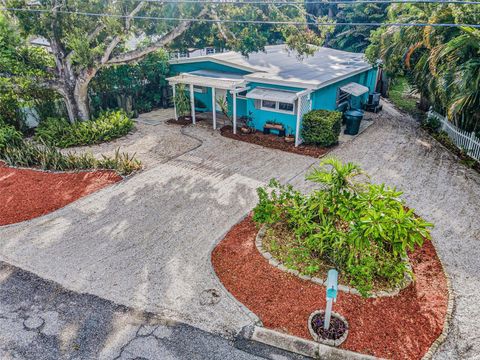
100 Waverly Way, Clearwater, FL 33756
$67
Cash flow
2.0%
Cash-on-Cash Return
6.6%
Cap rate
1.0%
Rent to Value Ratio

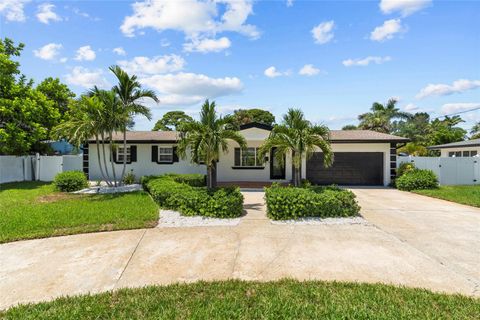
Active
$224,999
2
bds
|
2
ba
|
1,865
sqft
|
built
1920
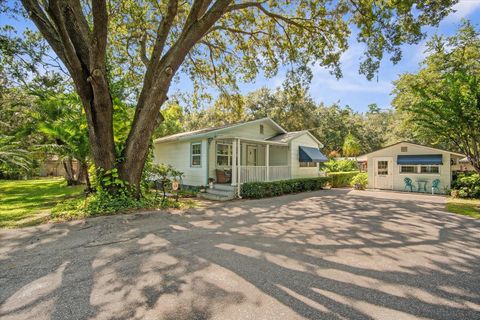
2355 Trelain Dr S, Saint Petersburg, FL 33712
$62
Cash flow
1.4%
Cash-on-Cash Return
6.5%
Cap rate
1.1%
Rent to Value Ratio
3,831 out of 4,992 properties for sale in Pinellas County
Limited Results Shown
Create a free account, or log in to reveal all property listings and enjoy the complete experience.
Active
$885,000
3
bds
|
2
ba
|
2,210
sqft
|
built
1957
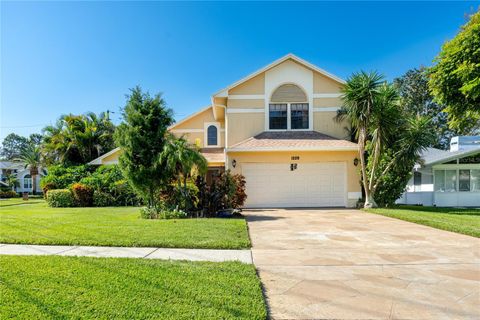
4440 Huntington St NE, Saint Petersburg, FL 33703
$-2,284
Cash flow
-13.5%
Cash-on-Cash Return
3.0%
Cap rate
0.5%
Rent to Value Ratio

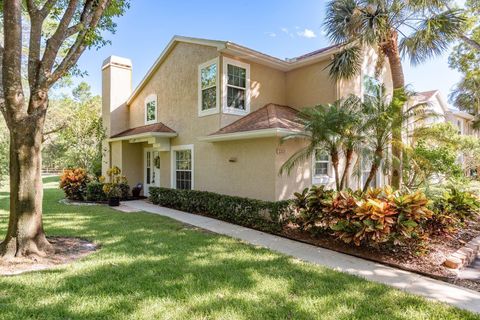
Active
$245,000
2
bds
|
2
ba
|
1,030
sqft
|
built
1984
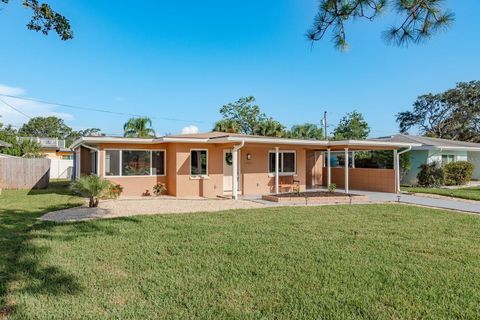
2165 Corbin Pl, Palm Harbor, FL 34683
$-369
Cash flow
-7.9%
Cash-on-Cash Return
4.3%
Cap rate
0.8%
Rent to Value Ratio

Active
$499,900
2
bds
|
1
ba
|
920
sqft
|
built
1980
2109 Gulf Blvd, Indian Rocks Beach, FL 33785
$-792
Cash flow
-8.3%
Cash-on-Cash Return
4.2%
Cap rate
0.6%
Rent to Value Ratio
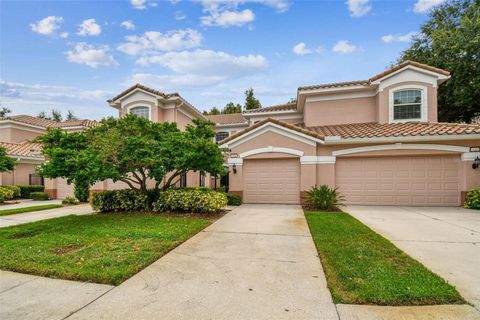
Active
$320,000
2
bds
|
3
ba
|
1,435
sqft
|
built
1994
2203 Andover Cir, Palm Harbor, FL 34683
$-659
Cash flow
-10.7%
Cash-on-Cash Return
3.7%
Cap rate
0.7%
Rent to Value Ratio
Active
$430,000
3
bds
|
2
ba
|
1,638
sqft
|
built
2007
826 Lantern Way, Clearwater, FL 33765
$-896
Cash flow
-10.9%
Cash-on-Cash Return
3.6%
Cap rate
0.5%
Rent to Value Ratio
Active
$850,000
2
bds
|
2
ba
|
917
sqft
|
built
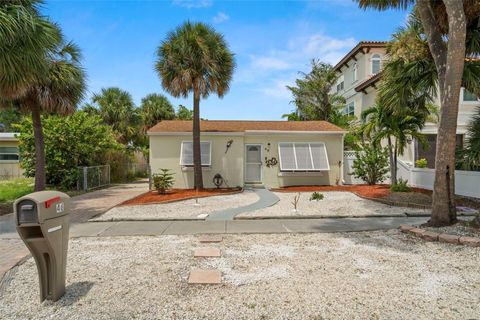
1951
46 Kipling Plz, Clearwater, FL 33767
$-3,259
Cash flow
-20.0%
Cash-on-Cash Return
1.5%
Cap rate
0.3%
Rent to Value Ratio
Active
$235,000
2
bds
|
2
ba
|
910
sqft
|
built
1990
3001 58th Ave S, Saint Petersburg, FL 33712
$-151
Cash flow
-3.4%
Cash-on-Cash Return
5.4%
Cap rate
0.9%
Rent to Value Ratio
Active
$950,000
3
bds
|
3
ba
|
1,833
sqft
|
built
1998
4993 Bacopa Ln S, Saint Petersburg, FL 33715
$-2,791
Cash flow
-15.3%
Cash-on-Cash Return
2.6%
Cap rate
0.4%
Rent to Value Ratio
Active
$585,000
2
bds
|
2
ba
|
1,286
sqft
|
built
1959
1696 Velma Dr S, Largo, FL 33770
$-1,288
Cash flow
-11.5%
Cash-on-Cash Return
3.5%
Cap rate
0.6%
Rent to Value Ratio
Active
$785,000
3
bds
|
2
ba
|
2,108
sqft
|
built
2001
530 Somerhill Dr NE, Saint Petersburg, FL 33716
$-1,970
Cash flow
-13.1%
Cash-on-Cash Return
3.1%
Cap rate
0.5%
Rent to Value Ratio
Active
$109,500
1
bds
|
1
ba
|
500
sqft
|
built
1988
11901 4th St N, Saint Petersburg, FL 33716
$23
Cash flow
1.1%
Cash-on-Cash Return
6.4%
Cap rate
1.3%
Rent to Value Ratio

Active
$799,900
4
bds
|
2
ba
|
2,587
sqft
|
built
1969
11119 Cherokee Dr, Saint Petersburg, FL 33708
$-2,388
Cash flow
-15.6%
Cash-on-Cash Return
2.6%
Cap rate
0.4%
Rent to Value Ratio
Active
$875,000
7
bds
|
3
ba
|
1,568
sqft
|
built
1937
11625 131st St, Largo, FL 33774
$-2,998
Cash flow
-17.9%
Cash-on-Cash Return
2.0%
Cap rate
0.3%
Rent to Value Ratio

Active
$820,000
3
bds
|
2
ba
|
1,561
sqft
|
built
1963
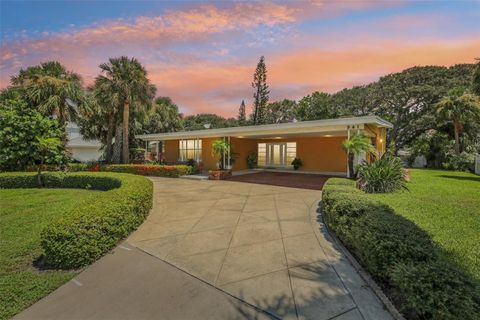
3790 Beach Dr SE, Saint Petersburg, FL 33705
$-1,681
Cash flow
-10.7%
Cash-on-Cash Return
3.7%
Cap rate
0.6%
Rent to Value Ratio
Active
$1,095,000
3
bds
|
2
ba
|
1,738
sqft
|
built
2019
706 Bayway Blvd, Clearwater, FL 33767
$-2,895
Cash flow
-13.8%
Cash-on-Cash Return
3.0%
Cap rate
0.6%
Rent to Value Ratio
Active
$460,000
3
bds
|
2
ba
|
1,164
sqft
|
built
1958
1115 Conant Ave, Safety Harbor, FL 34695
$-1,067
Cash flow
-12.1%
Cash-on-Cash Return
3.4%
Cap rate
0.5%
Rent to Value Ratio
Active
$725,000
3
bds
|
2
ba
|
1,540
sqft
|
built
1945
3790 Keystone Rd, Tarpon Springs, FL 34688
$-2,296
Cash flow
-16.5%
Cash-on-Cash Return
2.3%
Cap rate
0.4%
Rent to Value Ratio
Active
$709,000
3
bds
|
3
ba
|
2,398
sqft
|
built
1988
1229 Holiday Dr, Tarpon Springs, FL 34689
$-1,595
Cash flow
-11.7%
Cash-on-Cash Return
3.4%
Cap rate
0.5%
Rent to Value Ratio
Active
$520,000
3
bds
|
2
ba
|
1,479
sqft
|
built
1957
2480 Del Rio Way, Dunedin, FL 34698
$-1,018
Cash flow
-10.2%
Cash-on-Cash Return
3.8%
Cap rate
0.5%
Rent to Value Ratio

Active
$625,000
2
bds
|
2
ba
|
1,309
sqft
|
built
2007
226 5th Ave N, Saint Petersburg, FL 33701
$-734
Cash flow
-6.1%
Cash-on-Cash Return
4.7%
Cap rate
0.7%
Rent to Value Ratio
Active
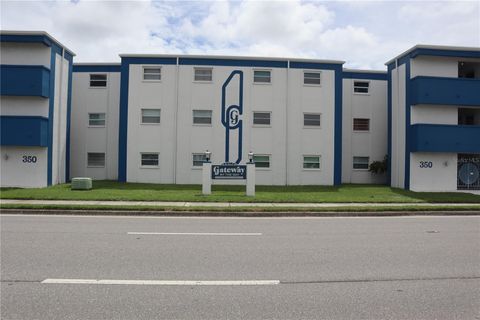
$155,000
2
bds
|
1
ba
|
915
sqft
|
built
1970
350 79th Ave N, Saint Petersburg, FL 33702
$-591
Cash flow
-19.9%
Cash-on-Cash Return
1.6%
Cap rate
1.0%
Rent to Value Ratio

Active
$409,900
3
bds
|
3
ba
|
1,453
sqft
|
built
2003
564 Black Lion Dr NE, Saint Petersburg, FL 33716
$-781
Cash flow
-9.9%
Cash-on-Cash Return
3.9%
Cap rate
0.6%
Rent to Value Ratio
Active
$2,900,000
5
bds
|
5
ba
|
2,753
sqft
|
built
1983
4603 Osprey Dr S, Saint Petersburg, FL 33711
$-12,833
Cash flow
-23.1%
Cash-on-Cash Return
0.8%
Cap rate
0.1%
Rent to Value Ratio
Active
$839,000
4
bds
|
3
ba
|
2,501
sqft
|
built
1990
2725 Onizuka Ct, Palm Harbor, FL 34683
$-2,581
Cash flow
-16.1%
Cash-on-Cash Return
2.5%
Cap rate
0.5%
Rent to Value Ratio

Active
$265,000
2
bds
|
3
ba
|
1,110
sqft
|
built
1997
467 Countryside Key Blvd, Oldsmar, FL 34677
$-440
Cash flow
-8.7%
Cash-on-Cash Return
4.2%
Cap rate
0.8%
Rent to Value Ratio

Active
$435,000
2
bds
|
2
ba
|
1,315
sqft
|
built
1973
1120 N Shore Dr NE, Saint Petersburg, FL 33701
$-1,556
Cash flow
-18.7%
Cash-on-Cash Return
1.9%
Cap rate
0.7%
Rent to Value Ratio

Active
$274,900
2
bds
|
2
ba
|
1,252
sqft
|
built
2007
2575 Hidden Cove Ln, Clearwater, FL 33763
$-640
Cash flow
-12.1%
Cash-on-Cash Return
3.4%
Cap rate
0.8%
Rent to Value Ratio
Active
$385,000
2
bds
|
2
ba
|
1,086
sqft
|
built
1981
6549 Creekview Ter N, Pinellas Park, FL 33781
$-763
Cash flow
-10.3%
Cash-on-Cash Return
3.8%
Cap rate
0.6%
Rent to Value Ratio

Active
$379,900
3
bds
|
3
ba
|
1,818
sqft
|
built
1956
1416 Nelson Ave, Clearwater, FL 33755
$-581
Cash flow
-8.0%
Cash-on-Cash Return
4.3%
Cap rate
0.7%
Rent to Value Ratio

Active
$550,000
3
bds
|
2
ba
|
2,253
sqft
|
built
1976
603 Ivey Ln, Tarpon Springs, FL 34689
$-1,303
Cash flow
-12.4%
Cash-on-Cash Return
3.3%
Cap rate
0.5%
Rent to Value Ratio
Active
$7,995,000
5
bds
|
6
ba
|
4,356
sqft
|
built
2016
17824 Lee Ave, Redington Shores, FL 33708
$-39,402
Cash flow
-25.7%
Cash-on-Cash Return
0.2%
Cap rate
0.1%
Rent to Value Ratio

Active
$550,000
3
bds
|
2
ba
|
1,547
sqft
|
built
1998
12744 Pineforest Way E, Largo, FL 33773
$-1,123
Cash flow
-10.7%
Cash-on-Cash Return
3.7%
Cap rate
0.5%
Rent to Value Ratio
Active
$969,900
3
bds
|
4
ba
|
2,400
sqft
|
built
1958
941 Gulf Blvd, Belleair Beach, FL 33786
$-2,425
Cash flow
-13.0%
Cash-on-Cash Return
3.1%
Cap rate
0.5%
Rent to Value Ratio
Active
$375,000
3
bds
|
2
ba
|
1,150
sqft
|
built
1956
1424 York St S, Gulfport, FL 33707
$-102
Cash flow
-1.4%
Cash-on-Cash Return
5.8%
Cap rate
0.8%
Rent to Value Ratio
Active
$450,000
2
bds
|
2
ba
|
1,659
sqft
|
built
1994
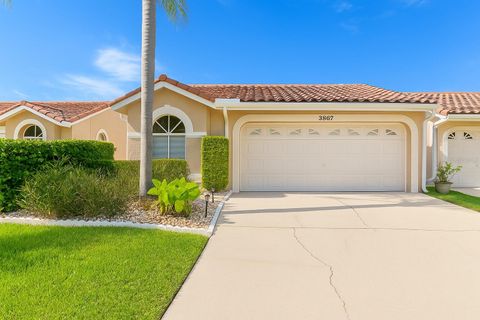
3867 Darston St, Palm Harbor, FL 34685
$-1,423
Cash flow
-16.5%
Cash-on-Cash Return
2.4%
Cap rate
0.6%
Rent to Value Ratio

Active
$230,000
3
bds
|
1
ba
|
836
sqft
|
built
1945
6404 Pershing St NE, Saint Petersburg, FL 33702
$-295
Cash flow
-6.7%
Cash-on-Cash Return
4.6%
Cap rate
0.8%
Rent to Value Ratio

Active
$315,000
3
bds
|
2
ba
|
1,576
sqft
|
built
2007
960 Starkey Rd, Largo, FL 33771
$-31
Cash flow
-0.5%
Cash-on-Cash Return
6.0%
Cap rate
0.8%
Rent to Value Ratio

Active
$799,900
4
bds
|
3
ba
|
2,323
sqft
|
built
1961
58 Arnoni Dr, Dunedin, FL 34698
$-2,346
Cash flow
-15.3%
Cash-on-Cash Return
2.6%
Cap rate
0.5%
Rent to Value Ratio