Pinellas County Investment Properties for Sale
Browse homes for sale and investment properties in Pinellas County. Refine your search by price, property type, or more.
Best cash flowing properties in Pinellas County
Active
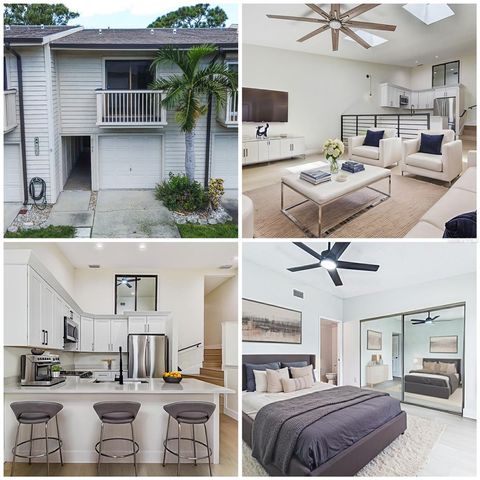
$255,000
3
bds
|
2
ba
|
1,437
sqft
|
built
1953
1826 Oregon Ave NE, Saint Petersburg, FL 33703
$781
Cash flow
16.0%
Cash-on-Cash Return
9.8%
Cap rate
1.4%
Rent to Value Ratio
Active
$159,999
2
bds
|
2
ba
|
990
sqft
|
built
1979
107 114th Ter NE, Saint Petersburg, FL 33716
$329
Cash flow
10.7%
Cash-on-Cash Return
8.6%
Cap rate
1.1%
Rent to Value Ratio
1,955 out of 2,586 properties for sale in Pinellas County
Limited Results Shown
Create a free account, or log in to reveal all property listings and enjoy the complete experience.
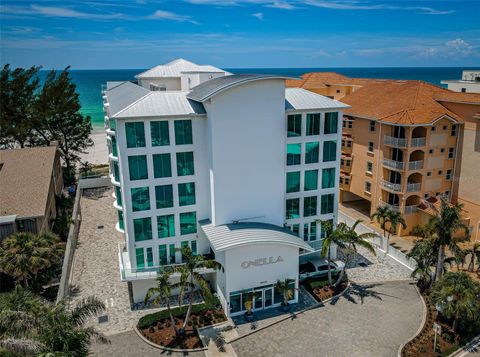
Active
$719,500
2
bds
|
2
ba
|
1,479
sqft
|
built
1974
100 Pierce St, Clearwater, FL 33756
$-2,567
Cash flow
-18.6%
Cash-on-Cash Return
1.9%
Cap rate
0.4%
Rent to Value Ratio
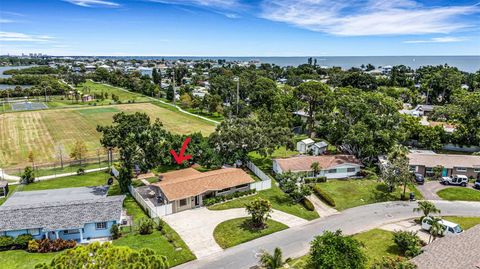
Active
$1,550,000
4
bds
|
3
ba
|
2,547
sqft
|
built
1970
2057 Kansas Ave NE, Saint Petersburg, FL 33703
$-3,164
Cash flow
-10.7%
Cash-on-Cash Return
3.7%
Cap rate
0.6%
Rent to Value Ratio
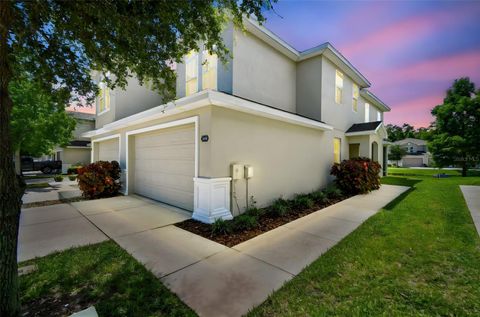
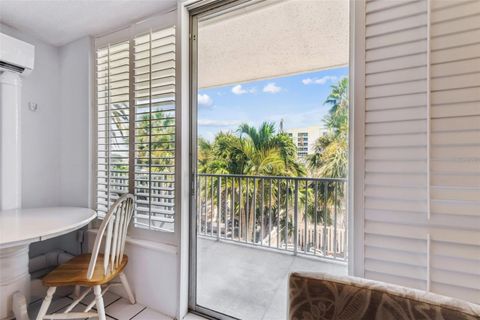
Active
$599,000
3
bds
|
3
ba
|
2,283
sqft
|
built
2018
1942 Marlington Way, Clearwater, FL 33763
$-2,015
Cash flow
-17.6%
Cash-on-Cash Return
2.1%
Cap rate
0.5%
Rent to Value Ratio
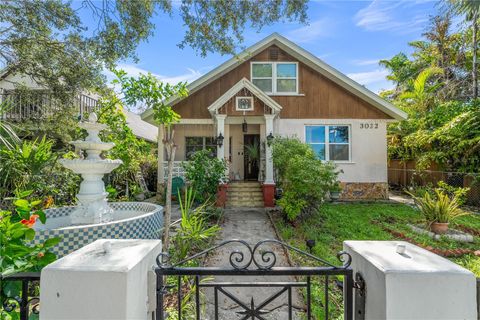
Active
$700,000
8
bds
|
5
ba
|
3,177
sqft
|
built
1925
3022 Beach Blvd S, Gulfport, FL 33707
$-375
Cash flow
-2.8%
Cash-on-Cash Return
5.5%
Cap rate
0.7%
Rent to Value Ratio
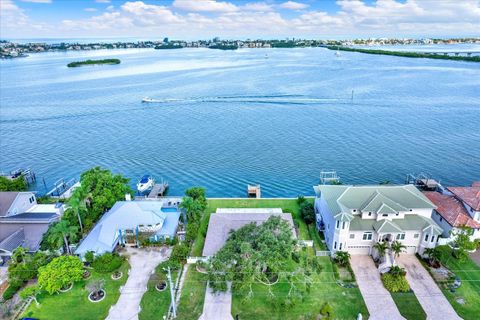
Active
$1,699,000
3
bds
|
2
ba
|
1,550
sqft
|
built
1963
218 Driftwood Ln, Largo, FL 33770
$-6,819
Cash flow
-20.9%
Cash-on-Cash Return
1.3%
Cap rate
0.2%
Rent to Value Ratio
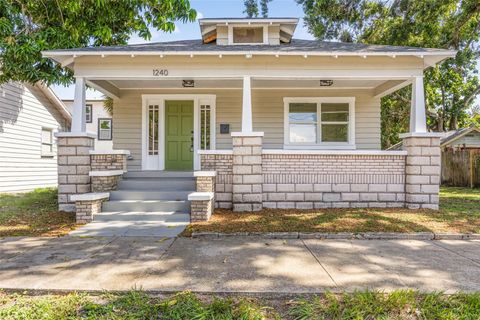
Active
$289,950
2
bds
|
1
ba
|
1,050
sqft
|
built
1927
1240 James Ave S, Saint Petersburg, FL 33705
$-428
Cash flow
-7.7%
Cash-on-Cash Return
4.4%
Cap rate
0.6%
Rent to Value Ratio
Active
$1,250,000
3
bds
|
2
ba
|
1,996
sqft
|
built
1972
1979 Iowa Ave NE, Saint Petersburg, FL 33703
$-3,073
Cash flow
-12.8%
Cash-on-Cash Return
3.2%
Cap rate
0.4%
Rent to Value Ratio
Active
$270,000
2
bds
|
2
ba
|
1,025
sqft
|
built
1975
2721 Haverhill Ct, Clearwater, FL 33761
$-560
Cash flow
-10.8%
Cash-on-Cash Return
3.7%
Cap rate
0.7%
Rent to Value Ratio
Active
$450,000
3
bds
|
2
ba
|
1,472
sqft
|
built
1968
5525 Pine Cir NE, Saint Petersburg, FL 33703
$-735
Cash flow
-8.5%
Cash-on-Cash Return
4.2%
Cap rate
0.6%
Rent to Value Ratio
Active
$525,000
2
bds
|
2
ba
|
1,365
sqft
|
built
1997
7 Island Park Pl, Dunedin, FL 34698
$-1,072
Cash flow
-10.7%
Cash-on-Cash Return
3.7%
Cap rate
0.5%
Rent to Value Ratio
Active
$380,000
3
bds
|
2
ba
|
1,384
sqft
|
built
1977
12656 Cumberland Dr, Largo, FL 33773
$-163
Cash flow
-2.2%
Cash-on-Cash Return
5.6%
Cap rate
0.7%
Rent to Value Ratio
Active
$850,000
3
bds
|
2
ba
|
1,823
sqft
|
built
1969
10001 S Yacht Club Dr, Treasure Island, FL 33706
$-1,114
Cash flow
-6.8%
Cash-on-Cash Return
4.6%
Cap rate
0.6%
Rent to Value Ratio
Active
$700,000
2
bds
|
2
ba
|
2,050
sqft
|
built
1982
150 Belleview Blvd, Belleair, FL 33756
$-1,854
Cash flow
-13.8%
Cash-on-Cash Return
3.0%
Cap rate
0.5%
Rent to Value Ratio
Active
$379,000
3
bds
|
2
ba
|
1,380
sqft
|
built
1969
2341 Forest Dr, Clearwater, FL 33763
$-306
Cash flow
-4.2%
Cash-on-Cash Return
5.2%
Cap rate
0.7%
Rent to Value Ratio
Active
$315,000
2
bds
|
1
ba
|
1,520
sqft
|
built
1945
1002 Pinebrook Dr, Clearwater, FL 33755
$-818
Cash flow
-13.5%
Cash-on-Cash Return
3.0%
Cap rate
0.6%
Rent to Value Ratio
Active
$249,000
3
bds
|
2
ba
|
1,162
sqft
|
built
1954
6560 70th Ave N, Pinellas Park, FL 33781
$123
Cash flow
2.6%
Cash-on-Cash Return
6.7%
Cap rate
0.9%
Rent to Value Ratio
Active
$213,900
2
bds
|
2
ba
|
910
sqft
|
built
1984
2119 Elm St, Dunedin, FL 34698
$-77
Cash flow
-1.9%
Cash-on-Cash Return
5.7%
Cap rate
0.8%
Rent to Value Ratio
Active
$499,900
2
bds
|
2
ba
|
1,331
sqft
|
built
1964
13958 Antigua Dr, Seminole, FL 33776
$-750
Cash flow
-7.8%
Cash-on-Cash Return
4.3%
Cap rate
0.7%
Rent to Value Ratio
Active
$799,000
2
bds
|
2
ba
|
1,208
sqft
|
built
1974
1270 Gulf Blvd, Clearwater, FL 33767
$-1,831
Cash flow
-12.0%
Cash-on-Cash Return
3.4%
Cap rate
0.5%
Rent to Value Ratio
Active
$250,000
2
bds
|
2
ba
|
930
sqft
|
built
1974
2700 Bayshore Blvd, Dunedin, FL 34698
$-178
Cash flow
-3.7%
Cash-on-Cash Return
5.3%
Cap rate
0.8%
Rent to Value Ratio
Active
$650,000
4
bds
|
4
ba
|
2,202
sqft
|
built
1989
813 Old Charleston Way, Largo, FL 33770
$-1,248
Cash flow
-10.0%
Cash-on-Cash Return
3.8%
Cap rate
0.5%
Rent to Value Ratio
Active
$150,000
1
bds
|
1
ba
|
563
sqft
|
built
2012
455 Alt 19 S, Palm Harbor, FL 34683
$43
Cash flow
1.5%
Cash-on-Cash Return
6.5%
Cap rate
0.9%
Rent to Value Ratio
Active
$2,499,900
8
bds
|
5
ba
|
4,021
sqft
|
built
1939
8425 W Gulf Blvd, Treasure Island, FL 33706
$-11,695
Cash flow
-24.4%
Cash-on-Cash Return
0.5%
Cap rate
0.1%
Rent to Value Ratio
Active
$989,900
3
bds
|
3
ba
|
2,680
sqft
|
built
2008
17821 Gulf Blvd, Redington Shores, FL 33708
$-3,300
Cash flow
-17.4%
Cash-on-Cash Return
2.1%
Cap rate
0.4%
Rent to Value Ratio
Active
$130,000
1
bds
|
1
ba
|
682
sqft
|
built
1972
2205 Belleair Rd, Clearwater, FL 33764
$206
Cash flow
8.3%
Cash-on-Cash Return
8.0%
Cap rate
1.2%
Rent to Value Ratio
Active
$459,000
3
bds
|
2
ba
|
1,021
sqft
|
built
1955
4934 Dr Martin Luther King Jr St N, Saint Petersburg, FL 33703
$-1,402
Cash flow
-15.9%
Cash-on-Cash Return
2.5%
Cap rate
0.4%
Rent to Value Ratio
Active
$280,000
3
bds
|
3
ba
|
1,335
sqft
|
built
1980
9209 Seminole Blvd, Seminole, FL 33772
$-590
Cash flow
-11.0%
Cash-on-Cash Return
3.6%
Cap rate
0.8%
Rent to Value Ratio
Active
$369,900
3
bds
|
2
ba
|
1,310
sqft
|
built
1955
1615 Stevensons Dr, Clearwater, FL 33755
$-930
Cash flow
-13.1%
Cash-on-Cash Return
3.1%
Cap rate
0.5%
Rent to Value Ratio
Active
$265,000
2
bds
|
2
ba
|
966
sqft
|
built
1984
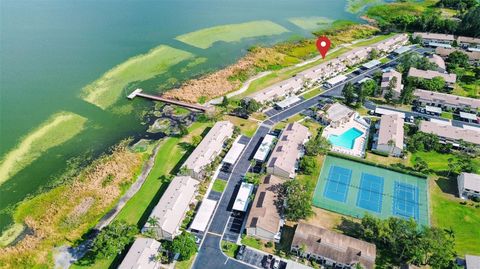
7131 Parkside Villas Dr N, Saint Petersburg, FL 33709
$-593
Cash flow
-11.7%
Cash-on-Cash Return
3.5%
Cap rate
0.7%
Rent to Value Ratio
Active
$299,000
3
bds
|
2
ba
|
1,612
sqft
|
built
1952
5124 N Ridge St N, Saint Petersburg, FL 33709
$-148
Cash flow
-2.6%
Cash-on-Cash Return
5.6%
Cap rate
0.7%
Rent to Value Ratio
Active
$225,000
2
bds
|
2
ba
|
1,190
sqft
|
built
1985
6343 92nd Pl N, Pinellas Park, FL 33782
$-662
Cash flow
-15.4%
Cash-on-Cash Return
2.6%
Cap rate
1.0%
Rent to Value Ratio
Active
$4,350,000
4
bds
|
4
ba
|
3,620
sqft
|
built
2018
19816 Gulf Blvd, Indian Shores, FL 33785
$-20,417
Cash flow
-24.5%
Cash-on-Cash Return
0.5%
Cap rate
0.2%
Rent to Value Ratio
Active
$525,000
4
bds
|
2
ba
|
1,772
sqft
|
built
1958
381 Kingfish Dr SE, Saint Petersburg, FL 33705
$-959
Cash flow
-9.5%
Cash-on-Cash Return
4.0%
Cap rate
0.6%
Rent to Value Ratio
Active
$389,000
1
bds
|
1
ba
|
405
sqft
|
built
1973
800 Bayway Blvd, Clearwater, FL 33767
$-936
Cash flow
-12.6%
Cash-on-Cash Return
3.3%
Cap rate
0.5%
Rent to Value Ratio
Active
$350,000
3
bds
|
3
ba
|
1,759
sqft
|
built
2004
511 Spring Lake Cir, Tarpon Springs, FL 34688
$-694
Cash flow
-10.3%
Cash-on-Cash Return
3.8%
Cap rate
0.8%
Rent to Value Ratio
Active
$2,000,000
4
bds
|
4
ba
|
3,206
sqft
|
built
1958
412 Orchid Ln, Palm Harbor, FL 34683
$-6,137
Cash flow
-16.0%
Cash-on-Cash Return
2.5%
Cap rate
0.5%
Rent to Value Ratio
Active
$359,000
2
bds
|
2
ba
|
1,100
sqft
|
built
1956
1819 Meadow Ln, Clearwater, FL 33764
$-700
Cash flow
-10.2%
Cash-on-Cash Return
3.8%
Cap rate
0.6%
Rent to Value Ratio
Active
$349,900
3
bds
|
2
ba
|
1,465
sqft
|
built
1994
4504 Connery Ct, Palm Harbor, FL 34685
$-769
Cash flow
-11.5%
Cash-on-Cash Return
3.5%
Cap rate
0.7%
Rent to Value Ratio