Pinellas County Investment Properties for Sale
Browse homes for sale and investment properties in Pinellas County. Refine your search by price, property type, or more.
Best cash flowing properties in Pinellas County
Active
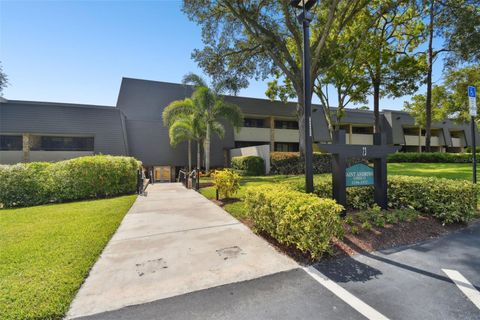
$129,000
2
bds
|
2
ba
|
990
sqft
|
built
1979
182 114th Ter NE, Saint Petersburg, FL 33716
$268
Cash flow
10.8%
Cash-on-Cash Return
8.6%
Cap rate
1.2%
Rent to Value Ratio
Active
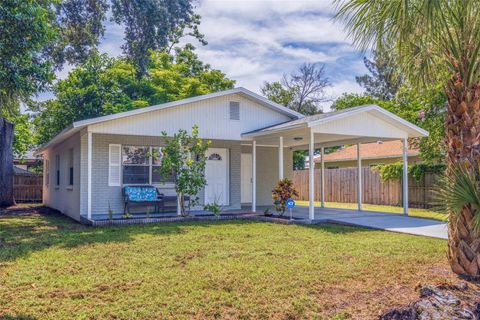
$239,000
2
bds
|
1
ba
|
864
sqft
|
built
1973
824 62nd Ave NE, Saint Petersburg, FL 33702
$151
Cash flow
3.3%
Cash-on-Cash Return
6.9%
Cap rate
1.0%
Rent to Value Ratio
3,851 out of 5,019 properties for sale in Pinellas County
Limited Results Shown
Create a free account, or log in to reveal all property listings and enjoy the complete experience.

Active
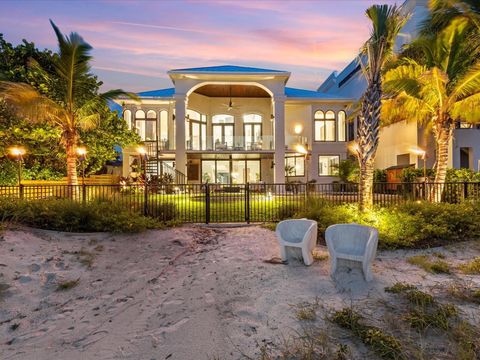
$2,750,000
7
bds
|
7
ba
|
6,117
sqft
|
built
1989
2901 Leprechaun Ln, Palm Harbor, FL 34683
$-9,406
Cash flow
-17.8%
Cash-on-Cash Return
2.0%
Cap rate
0.3%
Rent to Value Ratio
Active
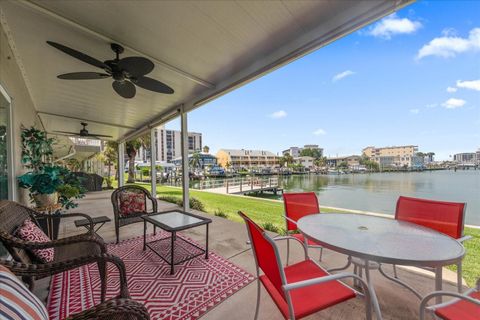
$795,000
4
bds
|
3
ba
|
3,034
sqft
|
built
1990
2118 Harbour Watch Dr, Tarpon Springs, FL 34689
$-1,825
Cash flow
-12.0%
Cash-on-Cash Return
3.4%
Cap rate
0.6%
Rent to Value Ratio

Active
$899,000
4
bds
|
2
ba
|
2,174
sqft
|
built
1973
2044 Montana Ave NE, Saint Petersburg, FL 33703
$-1,691
Cash flow
-9.8%
Cash-on-Cash Return
3.9%
Cap rate
0.5%
Rent to Value Ratio

Active
$894,900
5
bds
|
4
ba
|
3,196
sqft
|
built
1905
1109 Belcher Rd, Palm Harbor, FL 34683
$-1,840
Cash flow
-10.7%
Cash-on-Cash Return
3.7%
Cap rate
0.6%
Rent to Value Ratio
Active
$1,295,000
3
bds
|
3
ba
|
2,302
sqft
|
built
1960
4751 Baywood Point Dr S, Gulfport, FL 33711
$-1,196
Cash flow
-4.8%
Cash-on-Cash Return
5.0%
Cap rate
0.7%
Rent to Value Ratio

Active
$1,999,499
3
bds
|
2
ba
|
3,360
sqft
|
built
1969
200 Colony Point Rd S, Saint Petersburg, FL 33705
$-4,948
Cash flow
-12.9%
Cash-on-Cash Return
3.2%
Cap rate
0.5%
Rent to Value Ratio

Active
$465,000
3
bds
|
2
ba
|
1,512
sqft
|
built
1979
1503 Edna Ave, Largo, FL 33770
$-707
Cash flow
-7.9%
Cash-on-Cash Return
4.3%
Cap rate
0.7%
Rent to Value Ratio

Active
$429,000
3
bds
|
2
ba
|
1,700
sqft
|
built
2012
1008 Blue Heron Way, Tarpon Springs, FL 34689
$-870
Cash flow
-10.6%
Cash-on-Cash Return
3.7%
Cap rate
0.7%
Rent to Value Ratio

Active
$8,999,999
6
bds
|
10
ba
|
13,711
sqft
|
built
2003
774 Nina Dr, Tierra Verde, FL 33715
$-46,235
Cash flow
-26.8%
Cash-on-Cash Return
0.0%
Cap rate
0.1%
Rent to Value Ratio
Active
$575,000
1
bds
|
1
ba
|
735
sqft
|
built
1962
880 Mandalay Ave, Clearwater, FL 33767
$-1,648
Cash flow
-15.0%
Cash-on-Cash Return
2.7%
Cap rate
0.5%
Rent to Value Ratio

Active
$174,900
2
bds
|
1
ba
|
817
sqft
|
built
1986
2438 Enterprise Rd, Clearwater, FL 33763
$-237
Cash flow
-7.1%
Cash-on-Cash Return
4.5%
Cap rate
1.0%
Rent to Value Ratio
Active
$539,900
4
bds
|
3
ba
|
2,976
sqft
|
built
1982
5841 Bay Pines Lakes Blvd, Saint Petersburg, FL 33708
$-1,007
Cash flow
-9.7%
Cash-on-Cash Return
3.9%
Cap rate
0.7%
Rent to Value Ratio

Active
$225,000
2
bds
|
3
ba
|
1,264
sqft
|
built
1994
62 Emerald Bay Dr, Oldsmar, FL 34677
$-434
Cash flow
-10.1%
Cash-on-Cash Return
3.8%
Cap rate
0.8%
Rent to Value Ratio
Active
$259,570
bds
|
1
ba
|
430
sqft
|
built
1964
2570 Gary Cir, Dunedin, FL 34698
$-455
Cash flow
-9.1%
Cash-on-Cash Return
4.0%
Cap rate
0.6%
Rent to Value Ratio

Active
$127,900
2
bds
|
1
ba
|
846
sqft
|
built
1973
1829 Bough Ave, Clearwater, FL 33760
$-334
Cash flow
-13.6%
Cash-on-Cash Return
3.0%
Cap rate
1.3%
Rent to Value Ratio
Active
$669,000
2
bds
|
2
ba
|
1,065
sqft
|
built
1973
16308 Gulf Blvd, Redington Beach, FL 33708
$-2,554
Cash flow
-19.9%
Cash-on-Cash Return
1.6%
Cap rate
0.5%
Rent to Value Ratio
Active
$450,000
3
bds
|
3
ba
|
2,230
sqft
|
built
2019
2313 Sunset Wind Loop, Oldsmar, FL 34677
$-785
Cash flow
-9.1%
Cash-on-Cash Return
4.1%
Cap rate
0.8%
Rent to Value Ratio

Active
$279,000
2
bds
|
3
ba
|
1,210
sqft
|
built
1994
2323 Feather Sound Dr, Clearwater, FL 33762
$-829
Cash flow
-15.5%
Cash-on-Cash Return
2.6%
Cap rate
0.9%
Rent to Value Ratio
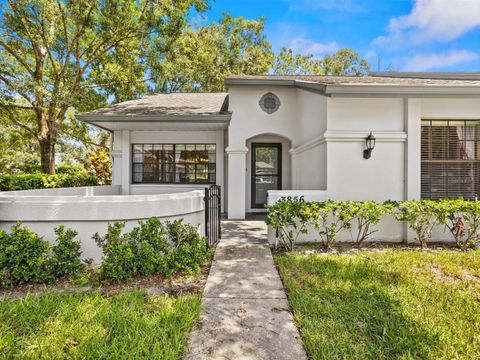
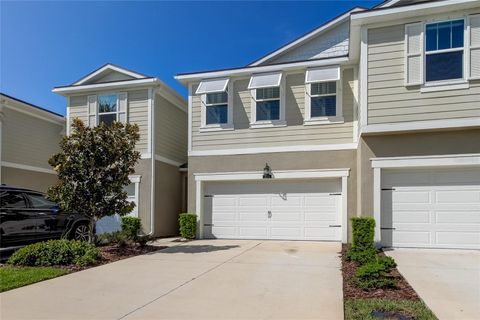
Active
$299,999
2
bds
|
2
ba
|
1,265
sqft
|
built
1985
3856 Goldfinch Ct, Palm Harbor, FL 34685
$-539
Cash flow
-9.4%
Cash-on-Cash Return
4.0%
Cap rate
0.7%
Rent to Value Ratio
Active
$285,000
2
bds
|
2
ba
|
1,240
sqft
|
built
1978
400 Island Way, Clearwater, FL 33767
$73
Cash flow
1.3%
Cash-on-Cash Return
6.5%
Cap rate
0.9%
Rent to Value Ratio
Active
$429,900
3
bds
|
2
ba
|
1,970
sqft
|
built
1971
8665 Mockingbird Ln, Seminole, FL 33777
$-164
Cash flow
-2.0%
Cash-on-Cash Return
5.7%
Cap rate
0.7%
Rent to Value Ratio

Active
$325,000
2
bds
|
3
ba
|
1,406
sqft
|
built
1995
2745 Enterprise Rd E, Clearwater, FL 33759
$-842
Cash flow
-13.5%
Cash-on-Cash Return
3.0%
Cap rate
0.6%
Rent to Value Ratio

Active
$6,700,000
6
bds
|
6
ba
|
4,602
sqft
|
built
1987
20052 Gulf Blvd, Indian Shores, FL 33785
$-34,779
Cash flow
-27.1%
Cash-on-Cash Return
-0.1%
Cap rate
0.1%
Rent to Value Ratio

Active
$6,700,000
6
bds
|
6
ba
|
4,602
sqft
|
built
1985
20051 Gulf Blvd, Indian Shores, FL 33785
$-34,779
Cash flow
-27.1%
Cash-on-Cash Return
-0.1%
Cap rate
0.1%
Rent to Value Ratio
Active
$192,000
1
bds
|
1
ba
|
610
sqft
|
built
1974
36750 US Highway 19 N, Palm Harbor, FL 34684
$-453
Cash flow
-12.3%
Cash-on-Cash Return
3.3%
Cap rate
0.9%
Rent to Value Ratio

Active
$485,000
3
bds
|
2
ba
|
1,526
sqft
|
built
2017
1950 Lillian Ave, Tarpon Springs, FL 34689
$-1,046
Cash flow
-11.3%
Cash-on-Cash Return
3.6%
Cap rate
0.6%
Rent to Value Ratio
Active
$310,000
3
bds
|
1
ba
|
1,068
sqft
|
built
1984
5733 66th Ln N, Saint Petersburg, FL 33709
$-207
Cash flow
-3.5%
Cash-on-Cash Return
5.3%
Cap rate
0.8%
Rent to Value Ratio
Active
$6,700,000
5
bds
|
5
ba
|
4,294
sqft
|
built
1969
780 Eldorado Ave, Clearwater, FL 33767
$-33,472
Cash flow
-26.1%
Cash-on-Cash Return
0.2%
Cap rate
0.1%
Rent to Value Ratio
Active
$489,000
2
bds
|
2
ba
|
1,005
sqft
|
built
1968
400 Larboard Way, Clearwater, FL 33767
$-732
Cash flow
-7.8%
Cash-on-Cash Return
4.4%
Cap rate
0.7%
Rent to Value Ratio

Active
$554,000
3
bds
|
2
ba
|
1,782
sqft
|
built
1984
10799 Harborside Dr, Largo, FL 33773
$-664
Cash flow
-6.3%
Cash-on-Cash Return
4.7%
Cap rate
0.6%
Rent to Value Ratio

Active
$399,000
2
bds
|
2
ba
|
890
sqft
|
built
1977
6177 Sun Blvd, Saint Petersburg, FL 33715
$-1,400
Cash flow
-18.3%
Cash-on-Cash Return
1.9%
Cap rate
0.7%
Rent to Value Ratio
Active
$700,000
4
bds
|
4
ba
|
2,796
sqft
|
built
1955
535 Monterey Blvd NE, Saint Petersburg, FL 33704
$-2,821
Cash flow
-21.0%
Cash-on-Cash Return
1.3%
Cap rate
0.4%
Rent to Value Ratio
Active
$925,000
9
bds
|
6
ba
|
3,203
sqft
|
built
1922
421 10th Ave N, Saint Petersburg, FL 33701
$-4,244
Cash flow
-23.9%
Cash-on-Cash Return
0.6%
Cap rate
0.2%
Rent to Value Ratio
Active
$1,075,000
4
bds
|
4
ba
|
2,186
sqft
|
built
1969
644 Bayshore Dr, Tarpon Springs, FL 34689
$-2,697
Cash flow
-13.1%
Cash-on-Cash Return
3.1%
Cap rate
0.5%
Rent to Value Ratio

Active
$2,874,000
3
bds
|
4
ba
|
3,274
sqft
|
built
2018
6 Hibiscus Ln, Belleair, FL 33756
$-12,523
Cash flow
-22.7%
Cash-on-Cash Return
0.9%
Cap rate
0.3%
Rent to Value Ratio

Active
$715,000
2
bds
|
2
ba
|
1,895
sqft
|
built
1979
50 Coe Rd, Belleair, FL 33756
$-2,600
Cash flow
-19.0%
Cash-on-Cash Return
1.8%
Cap rate
0.6%
Rent to Value Ratio

Active
$640,000
2
bds
|
2
ba
|
1,100
sqft
|
built
1973
19610 Gulf Blvd, Indian Shores, FL 33785
$-1,386
Cash flow
-11.3%
Cash-on-Cash Return
3.5%
Cap rate
0.5%
Rent to Value Ratio

Active
$429,900
2
bds
|
2
ba
|
1,024
sqft
|
built
1979
5257 Beach Dr SE, Saint Petersburg, FL 33705
$-531
Cash flow
-6.4%
Cash-on-Cash Return
4.7%
Cap rate
0.7%
Rent to Value Ratio