Volusia County Investment Properties for Sale
Browse homes for sale and investment properties in Volusia County. Refine your search by price, property type, or more.
Best cash flowing properties in Volusia County
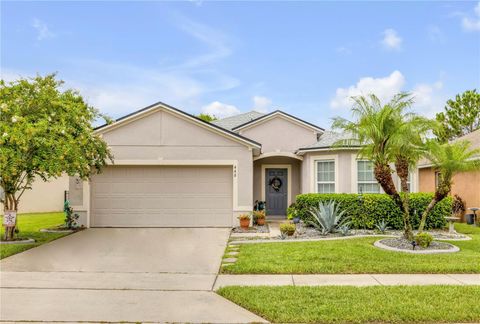
Active
$249,990
3
bds
|
2
ba
|
1,827
sqft
|
built
1966
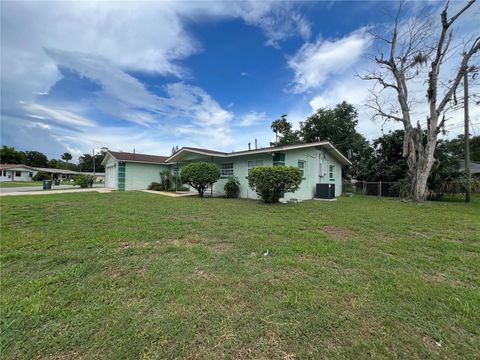
835 Kottle Cir N, Daytona Beach, FL 32114
$5
Cash flow
0.1%
Cash-on-Cash Return
6.2%
Cap rate
0.9%
Rent to Value Ratio
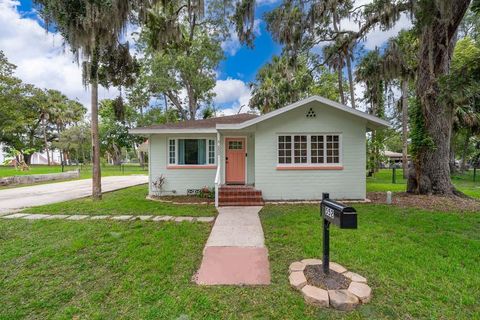
Active
$214,000
3
bds
|
2
ba
|
1,168
sqft
|
built
2007
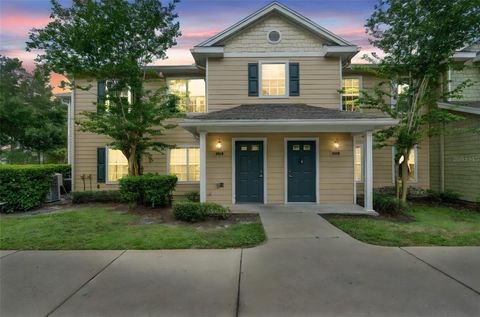
910 Regatta Bay Dr, Orange City, FL 32763
$-49
Cash flow
-1.2%
Cash-on-Cash Return
5.9%
Cap rate
0.8%
Rent to Value Ratio
952 out of 1,337 properties for sale in Volusia County
Limited Results Shown
Create a free account, or log in to reveal all property listings and enjoy the complete experience.

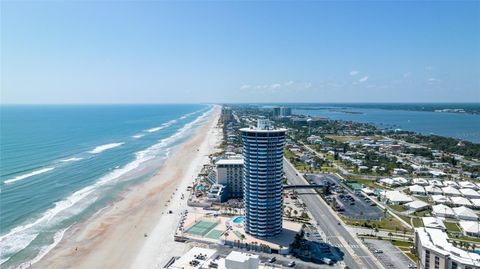
Active
$799,900
3
bds
|
3
ba
|
2,316
sqft
|
built
2007
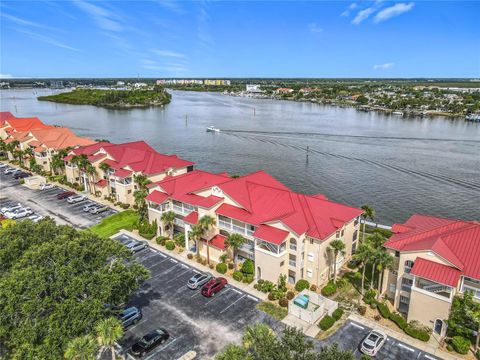
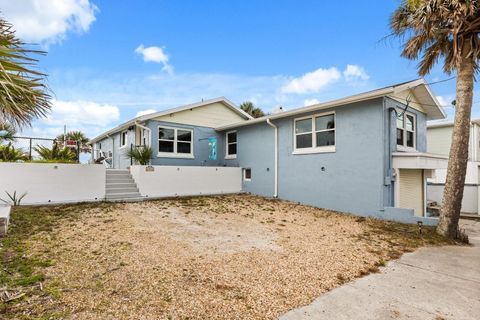
2515 S Atlantic Ave, Daytona Beach Shores, FL 32118
$-1,841
Cash flow
-12.0%
Cash-on-Cash Return
3.4%
Cap rate
0.6%
Rent to Value Ratio
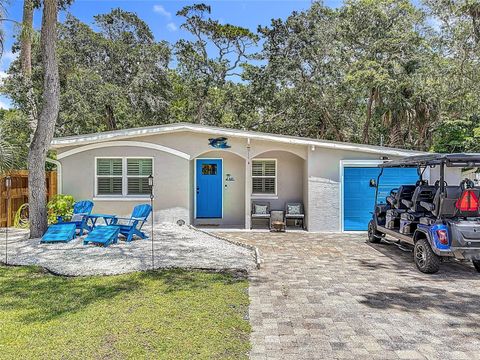
Active
$269,500
2
bds
|
3
ba
|
1,706
sqft
|
built
1990
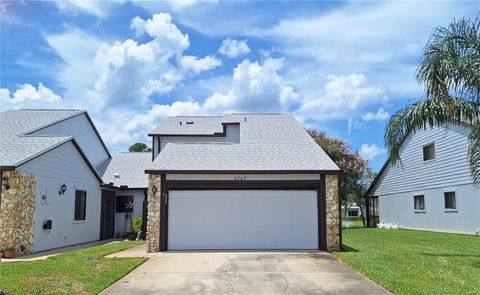
2263 Deerwood Dr, New Smyrna Beach, FL 32168
$-871
Cash flow
-16.9%
Cash-on-Cash Return
2.3%
Cap rate
0.7%
Rent to Value Ratio
Active
$548,000
2
bds
|
2
ba
|
1,053
sqft
|
built
1991
442 Bouchelle Dr, New Smyrna Beach, FL 32169
$-1,473
Cash flow
-14.0%
Cash-on-Cash Return
2.9%
Cap rate
0.6%
Rent to Value Ratio
Active
$1,295,000
4
bds
|
4
ba
|
2,879
sqft
|
built
1993
1951 Waterford Estates Dr, New Smyrna Beach, FL 32168
$-4,114
Cash flow
-16.6%
Cash-on-Cash Return
2.3%
Cap rate
0.4%
Rent to Value Ratio
Active
$269,900
2
bds
|
1
ba
|
1,052
sqft
|
built
1996
275 Washington Pl, Ormond Beach, FL 32174
$-208
Cash flow
-4.0%
Cash-on-Cash Return
5.2%
Cap rate
0.7%
Rent to Value Ratio

Active
$499,900
4
bds
|
3
ba
|
1,690
sqft
|
built
1953
763 W Blue Springs Ave, Orange City, FL 32763
$-1,833
Cash flow
-19.1%
Cash-on-Cash Return
1.7%
Cap rate
0.4%
Rent to Value Ratio
Active
$399,900
4
bds
|
3
ba
|
2,246
sqft
|
built
2002
1715 Concert Rd, Deltona, FL 32738
$-615
Cash flow
-8.0%
Cash-on-Cash Return
4.3%
Cap rate
0.7%
Rent to Value Ratio
Active
$355,000
2
bds
|
2
ba
|
1,394
sqft
|
built
1971
42 Kathy Dr, Ormond Beach, FL 32176
$-192
Cash flow
-2.8%
Cash-on-Cash Return
5.5%
Cap rate
0.7%
Rent to Value Ratio
Active
$345,000
3
bds
|
2
ba
|
2,020
sqft
|
built
2006
2407 Pine Tree Dr, Edgewater, FL 32141
$-139
Cash flow
-2.1%
Cash-on-Cash Return
5.7%
Cap rate
0.7%
Rent to Value Ratio
Active
$265,900
3
bds
|
2
ba
|
1,252
sqft
|
built
1963
631 Merrimac St, Deltona, FL 32725
$-144
Cash flow
-2.8%
Cash-on-Cash Return
5.5%
Cap rate
0.8%
Rent to Value Ratio

Active
$995,000
4
bds
|
3
ba
|
2,226
sqft
|
built
1980
3558 John Anderson Dr, Ormond Beach, FL 32176
$-3,289
Cash flow
-17.2%
Cash-on-Cash Return
2.2%
Cap rate
0.4%
Rent to Value Ratio
Active
$360,000
3
bds
|
3
ba
|
2,167
sqft
|
built
2005
1767 N Merrick Dr, Deltona, FL 32738
$-440
Cash flow
-6.4%
Cash-on-Cash Return
4.7%
Cap rate
0.6%
Rent to Value Ratio

Active
$325,000
3
bds
|
2
ba
|
1,416
sqft
|
built
2019
1046 Wanderer Dr, Deltona, FL 32738
$-656
Cash flow
-10.5%
Cash-on-Cash Return
3.7%
Cap rate
0.6%
Rent to Value Ratio
Active
$599,000
3
bds
|
2
ba
|
1,614
sqft
|
built
1990
2260 Pioneer Trl, New Smyrna Beach, FL 32168
$-1,950
Cash flow
-17.0%
Cash-on-Cash Return
2.2%
Cap rate
0.5%
Rent to Value Ratio
Active
$1,350,000
3
bds
|
2
ba
|
1,485
sqft
|
built
1920
4039 S Atlantic Ave, Port Orange, FL 32127
$-4,539
Cash flow
-17.5%
Cash-on-Cash Return
2.1%
Cap rate
0.3%
Rent to Value Ratio
Active
$285,000
2
bds
|
1
ba
|
964
sqft
|
built
1979
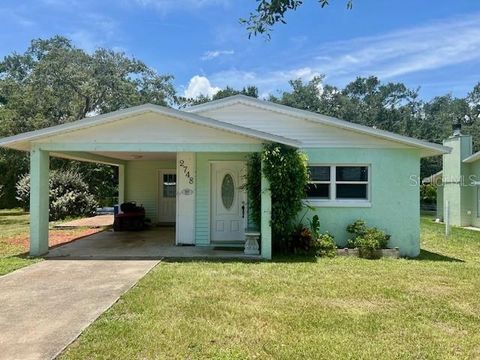
2748 Glenwood Ave, New Smyrna Beach, FL 32168
$-282
Cash flow
-5.2%
Cash-on-Cash Return
5.0%
Cap rate
0.6%
Rent to Value Ratio

Active
$245,000
4
bds
|
2
ba
|
1,274
sqft
|
built
1968
1500 Daroca Dr, Deltona, FL 32725
$-310
Cash flow
-6.6%
Cash-on-Cash Return
4.6%
Cap rate
0.7%
Rent to Value Ratio
Active
$465,000
1
bds
|
2
ba
|
695
sqft
|
built
1974
2401 S Atlantic Ave, New Smyrna Beach, FL 32169
$-1,667
Cash flow
-18.7%
Cash-on-Cash Return
1.8%
Cap rate
0.5%
Rent to Value Ratio
Active
$649,000
2
bds
|
3
ba
|
1,472
sqft
|
built
2002
6321 Engram Rd, New Smyrna Beach, FL 32169
$-1,271
Cash flow
-10.2%
Cash-on-Cash Return
3.8%
Cap rate
0.5%
Rent to Value Ratio

Active
$274,999
3
bds
|
2
ba
|
1,210
sqft
|
built
2004
819 Buford Ave, Orange City, FL 32763
$-385
Cash flow
-7.3%
Cash-on-Cash Return
4.5%
Cap rate
0.7%
Rent to Value Ratio
Active
$375,000
2
bds
|
2
ba
|
1,339
sqft
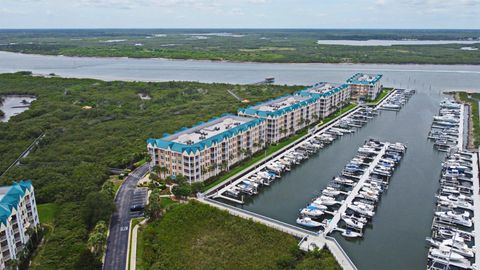
|
built
2001
4624 Harbour Village Blvd, Ponce Inlet, FL 32127
$-1,220
Cash flow
-17.0%
Cash-on-Cash Return
2.2%
Cap rate
0.6%
Rent to Value Ratio

Active
$675,000
3
bds
|
2
ba
|
1,925
sqft
|
built
2007
3343 S Atlantic Ave, Daytona Beach Shores, FL 32118
$-1,658
Cash flow
-12.8%
Cash-on-Cash Return
3.2%
Cap rate
0.5%
Rent to Value Ratio

Active
$479,999
4
bds
|
3
ba
|
2,027
sqft
|
built
2023
4201 Acoma Dr, Ormond Beach, FL 32174
$-1,029
Cash flow
-11.2%
Cash-on-Cash Return
3.6%
Cap rate
0.6%
Rent to Value Ratio

Active
$174,900
2
bds
|
1
ba
|
891
sqft
|
built
1973
1510 Ocean Shore Blvd, Ormond Beach, FL 32176
$-383
Cash flow
-11.4%
Cash-on-Cash Return
3.5%
Cap rate
1.0%
Rent to Value Ratio

Active
$224,900
2
bds
|
1
ba
|
766
sqft
|
built
1964
1546 Flagami Ter, Deltona, FL 32725
$-352
Cash flow
-8.2%
Cash-on-Cash Return
4.3%
Cap rate
0.6%
Rent to Value Ratio
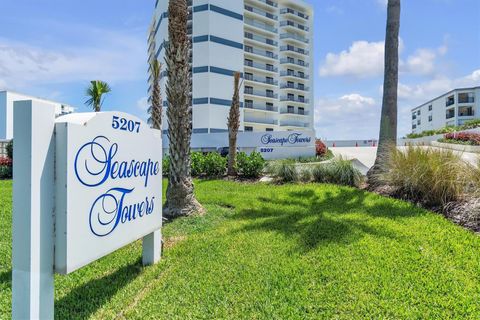
Active
$649,900
2
bds
|
2
ba
|
1,347
sqft
|
built
1986
5207 S Atlantic Ave, New Smyrna Beach, FL 32169
$-3,482
Cash flow
-28.0%
Cash-on-Cash Return
-0.3%
Cap rate
0.6%
Rent to Value Ratio
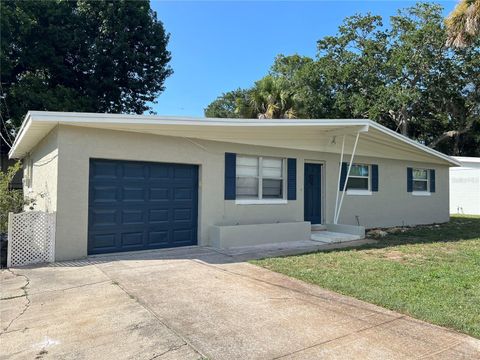
Active
$270,000
3
bds
|
2
ba
|
1,066
sqft
|
built
1960
328 Slayton Ave, South Daytona, FL 32119
$-249
Cash flow
-4.8%
Cash-on-Cash Return
5.0%
Cap rate
0.7%
Rent to Value Ratio
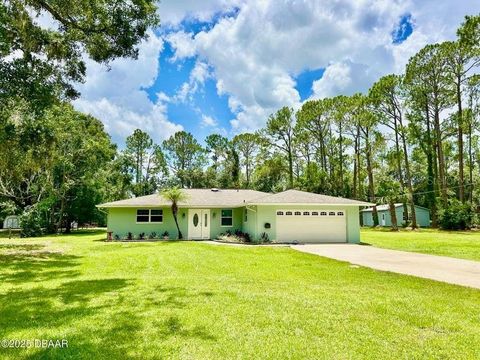
Active
$459,000
3
bds
|
2
ba
|
1,591
sqft
|
built
1975
2017 Old Daytona Rd, Port Orange, FL 32128
$-1,161
Cash flow
-13.2%
Cash-on-Cash Return
3.1%
Cap rate
0.5%
Rent to Value Ratio
Active
$370,000
3
bds
|
2
ba
|
1,540
sqft
|
built
2023
1148 Sand Trap Ct, Daytona Beach, FL 32124
$-793
Cash flow
-11.2%
Cash-on-Cash Return
3.6%
Cap rate
0.7%
Rent to Value Ratio
Active
$463,000
3
bds
|
2
ba
|
1,616
sqft
|
built
2022
334 Caryota Ct, New Smyrna Beach, FL 32168
$-1,082
Cash flow
-12.2%
Cash-on-Cash Return
3.3%
Cap rate
0.6%
Rent to Value Ratio
Active
$1,599,000
6
bds
|
7
ba
|
4,428
sqft
|
built
1905
1000 S Peninsula Dr, Daytona Beach, FL 32118
$-5,338
Cash flow
-17.4%
Cash-on-Cash Return
2.1%
Cap rate
0.3%
Rent to Value Ratio
Active
$558,500
4
bds
|
3
ba
|
1,990
sqft
|
built
1945
128 N Lakeview Dr, Lake Helen, FL 32744
$-1,767
Cash flow
-16.5%
Cash-on-Cash Return
2.4%
Cap rate
0.4%
Rent to Value Ratio
Active
$349,900
3
bds
|
2
ba
|
1,774
sqft
|
built
2017
448 White Coral Ln, New Smyrna Beach, FL 32168
$-425
Cash flow
-6.3%
Cash-on-Cash Return
4.7%
Cap rate
0.7%
Rent to Value Ratio
Active
$1,450,000
3
bds
|
4
ba
|
3,400
sqft
|
built
1974
2625 S Atlantic Ave, Daytona Beach Shores, FL 32118
$-4,511
Cash flow
-16.2%
Cash-on-Cash Return
2.4%
Cap rate
0.4%
Rent to Value Ratio
Active
$239,900
3
bds
|
1
ba
|
1,222
sqft
|
built
1953
552 Wells St, Daytona Beach, FL 32114
$-289
Cash flow
-6.3%
Cash-on-Cash Return
4.7%
Cap rate
0.7%
Rent to Value Ratio
Active
$674,999
3
bds
|
2
ba
|
1,838
sqft
|
built
1958
657 S Pine St, New Smyrna Beach, FL 32169
$-1,259
Cash flow
-9.7%
Cash-on-Cash Return
3.9%
Cap rate
0.5%
Rent to Value Ratio
Active
$295,000
2
bds
|
2
ba
|
1,242
sqft
|
built
1978
44 Fore Dr, New Smyrna Beach, FL 32168
$-489
Cash flow
-8.6%
Cash-on-Cash Return
4.2%
Cap rate
0.7%
Rent to Value Ratio
Active
$2,950,000
5
bds
|
5
ba
|
3,624
sqft
|
built
1986
339 Ocean Shore Blvd, Ormond Beach, FL 32176
$-13,892
Cash flow
-24.6%
Cash-on-Cash Return
0.5%
Cap rate
0.2%
Rent to Value Ratio