Florissant, CO Investment Properties for Sale
Browse homes for sale and investment properties in Florissant, CO. Refine your search by price, property type, or more.
Best cash flowing properties in Florissant, CO
Active
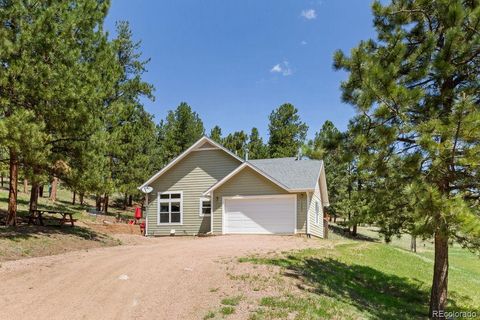
$399,000
3
bds
|
2
ba
|
1,624
sqft
|
built
1995
1641 Kiowa Rd, Florissant, CO 80816
$0
Cash flow
n/a
Cash-on-Cash Return
n/a
Cap rate
n/a
Rent to Value Ratio
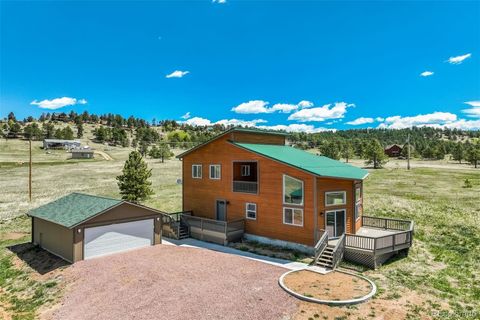
Active
$323,750
3
bds
|
1
ba
|
1,008
sqft
|
built
1983
454 Eagle Rock Rd, Florissant, CO 80816
$-65
Cash flow
-1.0%
Cash-on-Cash Return
5.4%
Cap rate
0.7%
Rent to Value Ratio
52 out of 63 properties for sale in Florissant, CO
Limited Results Shown
Create a free account, or log in to reveal all property listings and enjoy the complete experience.
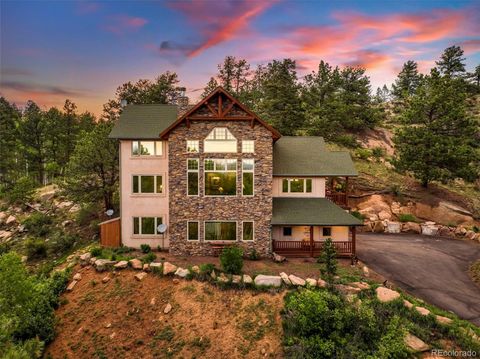
Active
$549,900
3
bds
|
3
ba
|
2,569
sqft
|
built
2001
82 Bradshaw Rd, Florissant, CO 80816
$-829
Cash flow
-7.9%
Cash-on-Cash Return
3.9%
Cap rate
0.5%
Rent to Value Ratio
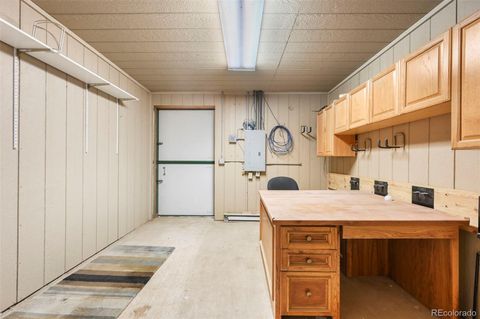
Active
$434,900
3
bds
|
2
ba
|
1,384
sqft
|
built
1998
696 Calle De La Nieva, Florissant, CO 80816
$-398
Cash flow
-4.8%
Cash-on-Cash Return
4.6%
Cap rate
0.6%
Rent to Value Ratio
Active
$495,000
3
bds
|
2
ba
|
1,460
sqft
|
built
1988
204 Kutsu Ridge Rd, Florissant, CO 80816
$-812
Cash flow
-8.6%
Cash-on-Cash Return
3.7%
Cap rate
0.5%
Rent to Value Ratio
Active
$586,000
3
bds
|
3
ba
|
2,052
sqft
|
built
2003
130 Paint Pony Ln, Florissant, CO 80816
$-952
Cash flow
-8.5%
Cash-on-Cash Return
3.7%
Cap rate
0.5%
Rent to Value Ratio
Active
$1,199,000
3
bds
|
3
ba
|
3,282
sqft
|
built
1997
361 Crystal Peak Rd, Florissant, CO 80816
$-3,064
Cash flow
-13.3%
Cash-on-Cash Return
2.6%
Cap rate
0.3%
Rent to Value Ratio
Active
$505,000
2
bds
|
1
ba
|
832
sqft
|
built
1973
201 Lake Dr, Florissant, CO 80816
$-953
Cash flow
-9.8%
Cash-on-Cash Return
3.4%
Cap rate
0.4%
Rent to Value Ratio
Active
$725,000
3
bds
|
2
ba
|
1,722
sqft
|
built
1977
3674 Trail Creek Rd, Florissant, CO 80816
$-1,976
Cash flow
-14.2%
Cash-on-Cash Return
2.4%
Cap rate
0.3%
Rent to Value Ratio
Active
$299,999
2
bds
|
2
ba
|
960
sqft
|
built
2015
716 Badger Trl, Florissant, CO 80816
$-114
Cash flow
-2.0%
Cash-on-Cash Return
5.2%
Cap rate
0.7%
Rent to Value Ratio
Active
$625,000
3
bds
|
3
ba
|
2,156
sqft
|
built
1910
135 Daniwood Grv, Florissant, CO 80816
$-1,422
Cash flow
-11.9%
Cash-on-Cash Return
2.9%
Cap rate
0.4%
Rent to Value Ratio
Active
$430,000
3
bds
|
2
ba
|
1,232
sqft
|
built
2005
406 High Pasture Rd, Florissant, CO 80816
$-528
Cash flow
-6.4%
Cash-on-Cash Return
4.2%
Cap rate
0.5%
Rent to Value Ratio
Active
$549,000
3
bds
|
2
ba
|
1,654
sqft
|
built
2003
318 Southgate Rd, Florissant, CO 80816
$-905
Cash flow
-8.6%
Cash-on-Cash Return
3.7%
Cap rate
0.5%
Rent to Value Ratio
Active
$680,000
3
bds
|
2
ba
|
2,975
sqft
|
built
2000
115 White Tail Ln, Florissant, CO 80816
$-1,127
Cash flow
-8.6%
Cash-on-Cash Return
3.7%
Cap rate
0.5%
Rent to Value Ratio
Active
$525,000
3
bds
|
2
ba
|
1,277
sqft
|
built
1999
37 Surrey Ln, Florissant, CO 80816
$-863
Cash flow
-8.6%
Cash-on-Cash Return
3.7%
Cap rate
0.5%
Rent to Value Ratio
Active
$500,000
2
bds
|
2
ba
|
1,992
sqft
|
built
1997
877 N Mountain Estates Rd, Florissant, CO 80816
$-484
Cash flow
-5.1%
Cash-on-Cash Return
4.5%
Cap rate
0.6%
Rent to Value Ratio
Active
$479,000
3
bds
|
2
ba
|
1,541
sqft
|
built
1996
534 Poncha Creek Trl, Florissant, CO 80816
$-635
Cash flow
-6.9%
Cash-on-Cash Return
4.1%
Cap rate
0.5%
Rent to Value Ratio

Active
$550,000
3
bds
|
2
ba
|
1,832
sqft
|
built
1995
48 Big Horn Cir, Florissant, CO 80816
$-897
Cash flow
-8.5%
Cash-on-Cash Return
3.7%
Cap rate
0.5%
Rent to Value Ratio
Active
$625,000
3
bds
|
3
ba
|
2,298
sqft
|
built
1994
305 Comanche Dr, Florissant, CO 80816
$-996
Cash flow
-8.3%
Cash-on-Cash Return
3.8%
Cap rate
0.5%
Rent to Value Ratio
Active
$350,000
3
bds
|
2
ba
|
1,216
sqft
|
built
1997
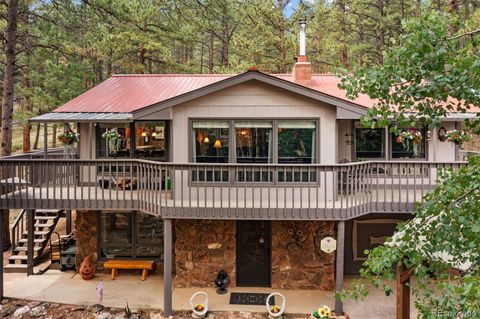
1360 Kiowa Rd, Florissant, CO 80816
$-149
Cash flow
-2.2%
Cash-on-Cash Return
5.2%
Cap rate
0.7%
Rent to Value Ratio

Active
$441,000
3
bds
|
2
ba
|
1,632
sqft
|
built
2000
485 Donzi Trl, Florissant, CO 80816
$-538
Cash flow
-6.4%
Cash-on-Cash Return
4.2%
Cap rate
0.6%
Rent to Value Ratio
Active
$320,000
2
bds
|
1
ba
|
908
sqft
|
built
1970
117 Reed Dr, Florissant, CO 80816
$-211
Cash flow
-3.4%
Cash-on-Cash Return
4.9%
Cap rate
0.6%
Rent to Value Ratio
Active
$399,500
3
bds
|
2
ba
|
1,681
sqft
|
built
1977
215 Southpark Rd, Florissant, CO 80816
$-607
Cash flow
-7.9%
Cash-on-Cash Return
3.9%
Cap rate
0.5%
Rent to Value Ratio

Active
$775,000
5
bds
|
3
ba
|
2,894
sqft
|
built
1981
1738 Wildhorn Rd, Florissant, CO 80816
$-1,759
Cash flow
-11.8%
Cash-on-Cash Return
3.0%
Cap rate
0.4%
Rent to Value Ratio

Active
$440,000
3
bds
|
2
ba
|
1,548
sqft
|
built
1995
936 Matterhorn Dr, Florissant, CO 80816
$-571
Cash flow
-6.8%
Cash-on-Cash Return
4.1%
Cap rate
0.5%
Rent to Value Ratio

Active
$329,000
2
bds
|
1
ba
|
1,200
sqft
|
built
1997
441 Paint Pony Ln, Florissant, CO 80816
$-107
Cash flow
-1.7%
Cash-on-Cash Return
5.3%
Cap rate
0.7%
Rent to Value Ratio

Active
$525,000
3
bds
|
3
ba
|
2,287
sqft
|
built
2004
69 Crescent Dr, Florissant, CO 80816
$-663
Cash flow
-6.6%
Cash-on-Cash Return
4.2%
Cap rate
0.5%
Rent to Value Ratio
Active
$650,000
4
bds
|
2
ba
|
1,944
sqft
|
built
1982
13599 County Rd 1, Florissant, CO 80816
$-1,070
Cash flow
-8.6%
Cash-on-Cash Return
3.7%
Cap rate
0.5%
Rent to Value Ratio
Active
$1,895,000
5
bds
|
4
ba
|
5,301
sqft
|
built
2002
584 Pikes Peak Dr, Florissant, CO 80816
$-6,127
Cash flow
-16.9%
Cash-on-Cash Return
1.8%
Cap rate
0.2%
Rent to Value Ratio

Active
$365,000
1
bds
|
1
ba
|
640
sqft
|
built
1961
274 Midland Rd, Florissant, CO 80816
$-428
Cash flow
-6.1%
Cash-on-Cash Return
4.3%
Cap rate
0.5%
Rent to Value Ratio

Active
$514,900
2
bds
|
2
ba
|
1,258
sqft
|
built
1977
490 Elkhorn Rd, Florissant, CO 80816
$-680
Cash flow
-6.9%
Cash-on-Cash Return
4.1%
Cap rate
0.5%
Rent to Value Ratio
Active
$475,000
2
bds
|
1
ba
|
1,620
sqft
|
built
1999
133 Vail Dr, Florissant, CO 80816
$-571
Cash flow
-6.3%
Cash-on-Cash Return
4.2%
Cap rate
0.5%
Rent to Value Ratio
Active
$575,000
3
bds
|
3
ba
|
1,925
sqft
|
built
2008
1563 Southpark Rd, Florissant, CO 80816
$-893
Cash flow
-8.1%
Cash-on-Cash Return
3.8%
Cap rate
0.5%
Rent to Value Ratio

Active
$739,900
3
bds
|
2
ba
|
1,705
sqft
|
built
2000
2602 Southpark Rd, Florissant, CO 80816
$-1,689
Cash flow
-11.9%
Cash-on-Cash Return
2.9%
Cap rate
0.4%
Rent to Value Ratio

Active
$699,000
5
bds
|
3
ba
|
3,425
sqft
|
built
1998
34 Piute Cir, Florissant, CO 80816
$-1,313
Cash flow
-9.8%
Cash-on-Cash Return
3.4%
Cap rate
0.5%
Rent to Value Ratio

Active
$510,000
3
bds
|
2
ba
|
1,792
sqft
|
built
2003
163 Big Horn Ln, Florissant, CO 80816
$-771
Cash flow
-7.9%
Cash-on-Cash Return
3.9%
Cap rate
0.5%
Rent to Value Ratio
Active
$540,000
3
bds
|
2
ba
|
1,609
sqft
|
built
2018
85 Estes Cir, Florissant, CO 80816
$-861
Cash flow
-8.3%
Cash-on-Cash Return
3.8%
Cap rate
0.5%
Rent to Value Ratio
Active
$1,080,000
3
bds
|
3
ba
|
2,963
sqft
|
built
2006
71 Crestone Cir, Florissant, CO 80816
$-2,930
Cash flow
-14.2%
Cash-on-Cash Return
2.4%
Cap rate
0.3%
Rent to Value Ratio
Active
$875,000
1
bds
|
1
ba
|
1,224
sqft
|
built
2004
224 Lakeview Forest Hts, Florissant, CO 80816
$-2,344
Cash flow
-14.0%
Cash-on-Cash Return
2.5%
Cap rate
0.3%
Rent to Value Ratio
Active
$789,000
3
bds
|
3
ba
|
2,420
sqft
|
built
2018
325 Spring Valley Dr, Florissant, CO 80816
$-1,384
Cash flow
-9.2%
Cash-on-Cash Return
3.6%
Cap rate
0.5%
Rent to Value Ratio