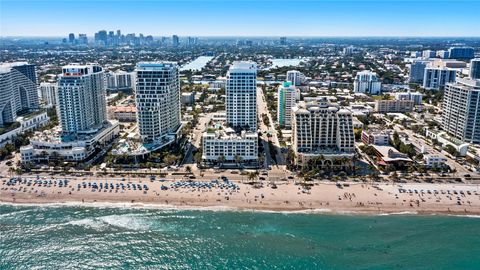
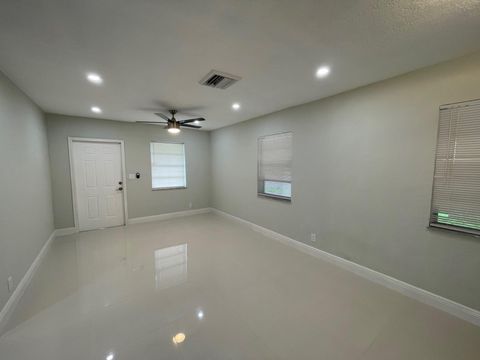
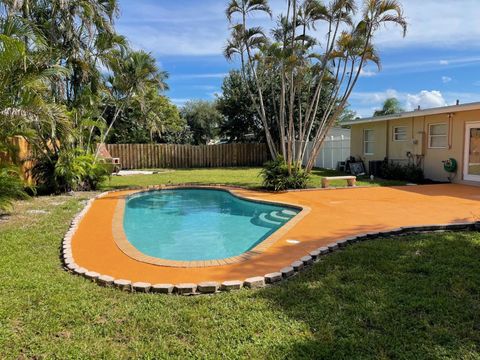
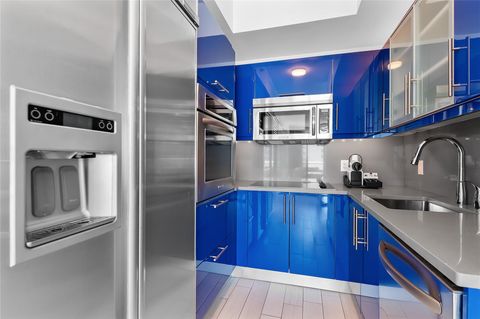
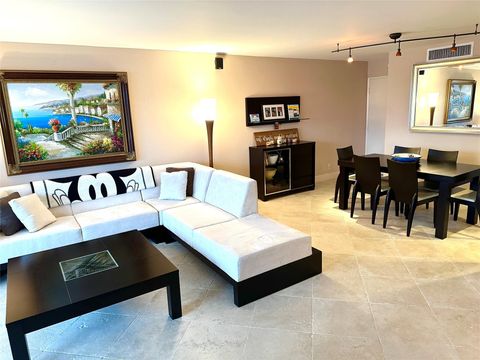
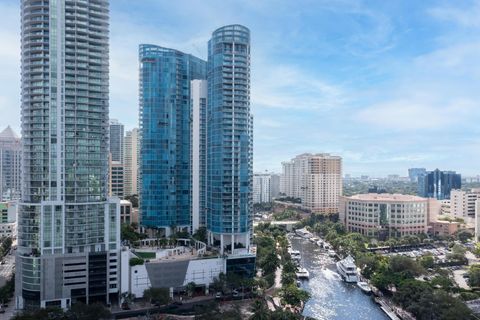
Fort Lauderdale, FL Investment Properties for Sale
Browse homes for sale and investment properties in Fort Lauderdale, FL. Refine your search by price, property type, or more.
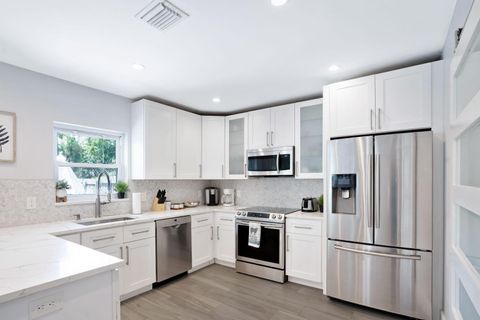
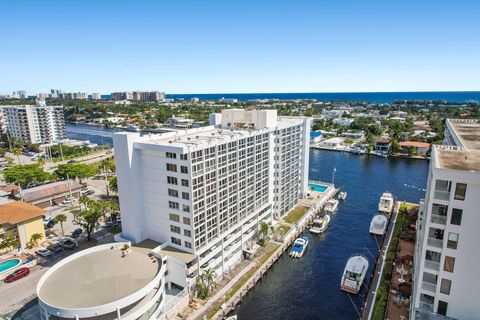
Best cash flowing properties in Fort Lauderdale, FL
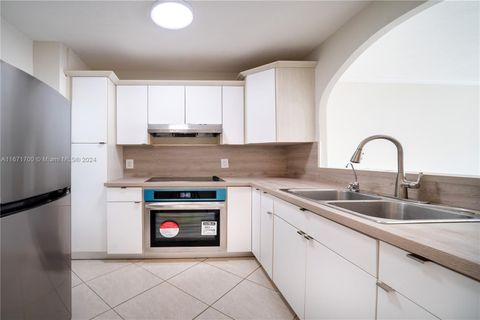
Active
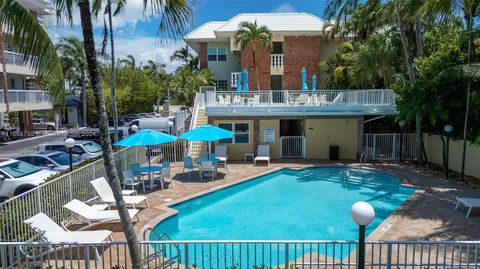
$875,000
3
bds
|
2
ba
|
1,338
sqft
|
built
1951
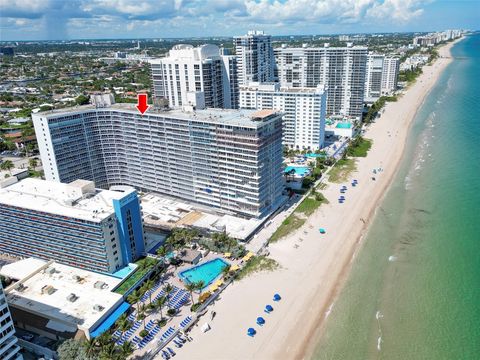
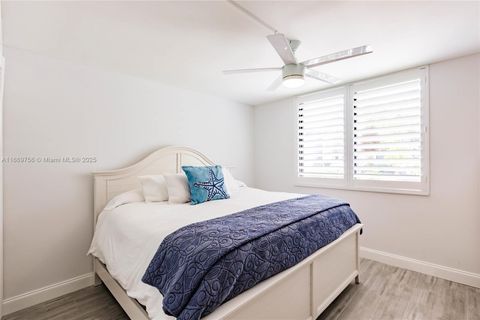
1315 NE 16th Ave, Fort Lauderdale, FL 33304
$618
Cash flow
3.7%
Cash-on-Cash Return
7.0%
Cap rate
1.0%
Rent to Value Ratio
Active
$439,000
1
bds
|
1
ba
|
577
sqft
|
built
2009
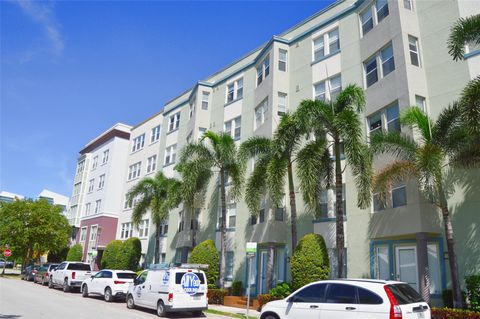
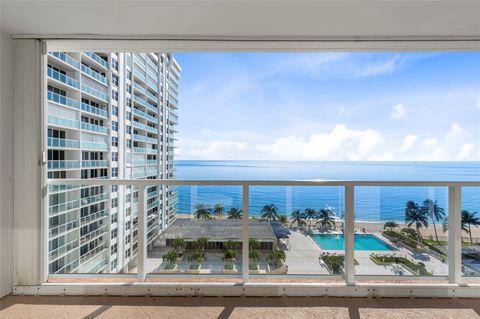
551 N Fort Lauderdale Beach Blvd, Fort Lauderdale, FL 33304
$-278
Cash flow
-3.3%
Cash-on-Cash Return
5.4%
Cap rate
0.9%
Rent to Value Ratio
2,032 out of 2,582 properties for sale in Fort Lauderdale, FL
Limited Results Shown
Create a free account, or log in to reveal all property listings and enjoy the complete experience.

Active
$1,050,000
2
bds
|
2
ba
|
1,284
sqft
|
built
2018
401 N Birch Rd, Fort Lauderdale, FL 33304
$-4,417
Cash flow
-21.9%
Cash-on-Cash Return
1.1%
Cap rate
0.6%
Rent to Value Ratio
Active
$580,000
2
bds
|
2
ba
|
1,400
sqft
|
built
1970
3100 NE 49th St, Fort Lauderdale, FL 33308
$-2,295
Cash flow
-20.6%
Cash-on-Cash Return
1.4%
Cap rate
0.6%
Rent to Value Ratio
Active
$1,048,500
bds
|
0
ba
|
2,500
sqft
|
built
1964
2121 NE 51st Ct, Fort Lauderdale, FL 33308
$-4,392
Cash flow
-21.9%
Cash-on-Cash Return
1.1%
Cap rate
0.3%
Rent to Value Ratio

Active
$4,840,000
5
bds
|
6
ba
|
20,000
sqft
|
built
2021
3325 NE 18th St, Fort Lauderdale, FL 33305
$-18,621
Cash flow
-20.1%
Cash-on-Cash Return
1.5%
Cap rate
0.2%
Rent to Value Ratio
Active
$875,000
2
bds
|
2
ba
|
1,500
sqft
|
built
1967
4100 Galt Ocean Dr, Fort Lauderdale, FL 33308
$-2,235
Cash flow
-13.3%
Cash-on-Cash Return
3.1%
Cap rate
0.7%
Rent to Value Ratio

Active
$995,000
4
bds
|
2
ba
|
2,103
sqft
|
built
1975
2505 NE 35th Dr, Fort Lauderdale, FL 33308
$-3,645
Cash flow
-19.1%
Cash-on-Cash Return
1.8%
Cap rate
0.4%
Rent to Value Ratio
Active
$1,099,000
3
bds
|
3
ba
|
2,320
sqft
|
built
2000
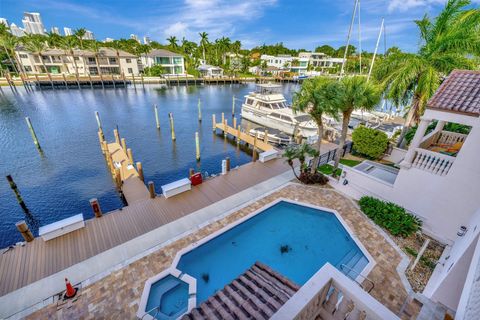
25 Hendricks Isle, Fort Lauderdale, FL 33301
$-3,913
Cash flow
-18.6%
Cash-on-Cash Return
1.9%
Cap rate
0.8%
Rent to Value Ratio

Active
$205,000
1
bds
|
1
ba
|
600
sqft
|
built
1966
1900 NE 8th Ct, Fort Lauderdale, FL 33304
$-810
Cash flow
-20.6%
Cash-on-Cash Return
1.4%
Cap rate
0.8%
Rent to Value Ratio
Active
$260,000
1
bds
|
1
ba
|
760
sqft
|
built
2005
533 NE 3rd Ave, Fort Lauderdale, FL 33301
$-852
Cash flow
-17.1%
Cash-on-Cash Return
2.2%
Cap rate
0.8%
Rent to Value Ratio
Active
$4,195,000
3
bds
|
4
ba
|
2,792
sqft
|
built
2018
2200 N Ocean Blvd, Fort Lauderdale, FL 33305
$-25,307
Cash flow
-31.5%
Cash-on-Cash Return
-1.1%
Cap rate
0.2%
Rent to Value Ratio
Pending
$2,850,000
4
bds
|
4
ba
|
3,473
sqft
|
built
2000
1500 SE 12th Ct, Fort Lauderdale, FL 33316
$-9,010
Cash flow
-16.5%
Cash-on-Cash Return
2.4%
Cap rate
0.4%
Rent to Value Ratio
Active
$799,000
2
bds
|
2
ba
|
1,700
sqft
|
built
1966
1151 N Fort Lauderdale Beach Blvd, Fort Lauderdale, FL 33304
$-3,810
Cash flow
-24.9%
Cash-on-Cash Return
0.4%
Cap rate
0.6%
Rent to Value Ratio
Active
$1,195,000
3
bds
|
2
ba
|
1,334
sqft
|
built
1956
2000 SE 26th Ave, Fort Lauderdale, FL 33316
$-2,526
Cash flow
-11.0%
Cash-on-Cash Return
3.6%
Cap rate
0.6%
Rent to Value Ratio
Active
$545,000
2
bds
|
2
ba
|
1,190
sqft
|
built
1965
4010 Galt Ocean Dr, Fort Lauderdale, FL 33308
$-2,635
Cash flow
-25.2%
Cash-on-Cash Return
0.3%
Cap rate
0.6%
Rent to Value Ratio
Active
$475,000
3
bds
|
2
ba
|
1,204
sqft
|
built
1957
1625 NW 12th Ct, Fort Lauderdale, FL 33311
$-394
Cash flow
-4.3%
Cash-on-Cash Return
5.2%
Cap rate
0.7%
Rent to Value Ratio
Active
$499,900
3
bds
|
2
ba
|
958
sqft
|
built
1956
1809 NW 13th Ct, Fort Lauderdale, FL 33311
$-908
Cash flow
-9.5%
Cash-on-Cash Return
4.0%
Cap rate
0.6%
Rent to Value Ratio
Active
$635,000
1
bds
|
1
ba
|
709
sqft
|
built
2011
3101 Bayshore Dr, Fort Lauderdale, FL 33304
$-2,224
Cash flow
-18.3%
Cash-on-Cash Return
1.9%
Cap rate
0.8%
Rent to Value Ratio
Active
$674,999
2
bds
|
2
ba
|
1,200
sqft
|
built
1971
1 Las Olas Cir, Fort Lauderdale, FL 33316
$-2,621
Cash flow
-20.3%
Cash-on-Cash Return
1.5%
Cap rate
0.6%
Rent to Value Ratio
Active
$248,000
1
bds
|
1
ba
|
720
sqft
|
built
1965
2555 NE 11th St, Fort Lauderdale, FL 33304
$-732
Cash flow
-15.4%
Cash-on-Cash Return
2.6%
Cap rate
0.8%
Rent to Value Ratio
Active
$4,250,000
6
bds
|
6
ba
|
4,561
sqft
|
built
2023
2421 NE 12th St, Fort Lauderdale, FL 33304
$-16,532
Cash flow
-20.3%
Cash-on-Cash Return
1.5%
Cap rate
0.2%
Rent to Value Ratio
Active
$815,000
bds
|
0
ba
|
2,504
sqft
|
built
1969
1519-1521 NW 8th Ave, Fort Lauderdale, FL 33311
$-2,950
Cash flow
-18.9%
Cash-on-Cash Return
1.8%
Cap rate
0.3%
Rent to Value Ratio
Active
$799,000
2
bds
|
2
ba
|
1,662
sqft
|
built
1974
3400 Galt Ocean Dr, Fort Lauderdale, FL 33308
$-2,110
Cash flow
-13.8%
Cash-on-Cash Return
3.0%
Cap rate
0.7%
Rent to Value Ratio

Active
$19,995,000
4
bds
|
6
ba
|
5,766
sqft
|
built
2023
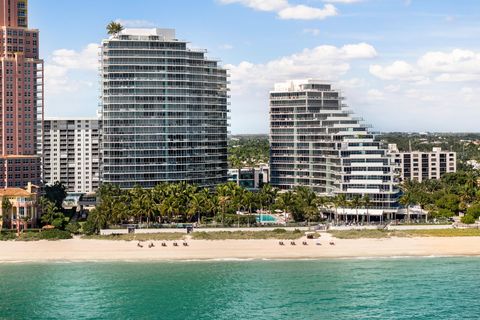
525 N Fort Lauderdale Beach Blvd, Fort Lauderdale, FL 33304
$-127,261
Cash flow
-33.2%
Cash-on-Cash Return
-1.5%
Cap rate
0.0%
Rent to Value Ratio
Active
$1,000,000
2
bds
|
3
ba
|
1,522
sqft
|
built
2004
333 Las Olas Way, Fort Lauderdale, FL 33301
$-3,614
Cash flow
-18.9%
Cash-on-Cash Return
1.8%
Cap rate
0.7%
Rent to Value Ratio
Active
$900,000
bds
|
0
ba
|
2,554
sqft
|
built
1961
5140 NE 17th Ter, Fort Lauderdale, FL 33334
$-3,647
Cash flow
-21.1%
Cash-on-Cash Return
1.3%
Cap rate
0.2%
Rent to Value Ratio
Active
$415,000
2
bds
|
1
ba
|
632
sqft
|
built
1924
232 Seminole Ave, Fort Lauderdale, FL 33312
$-959
Cash flow
-12.1%
Cash-on-Cash Return
3.4%
Cap rate
0.6%
Rent to Value Ratio
Active
$1,499,000
3
bds
|
4
ba
|
2,130
sqft
|
built
2001
2110 N Ocean Blvd, Fort Lauderdale, FL 33305
$-5,230
Cash flow
-18.2%
Cash-on-Cash Return
2.0%
Cap rate
0.7%
Rent to Value Ratio
Active
$1,050,000
2
bds
|
2
ba
|
1,264
sqft
|
built
1973
1586 S Ocean Ln, Fort Lauderdale, FL 33316
$-3,065
Cash flow
-15.2%
Cash-on-Cash Return
2.6%
Cap rate
0.6%
Rent to Value Ratio
Active
$629,000
2
bds
|
2
ba
|
1,534
sqft
|
built
1971
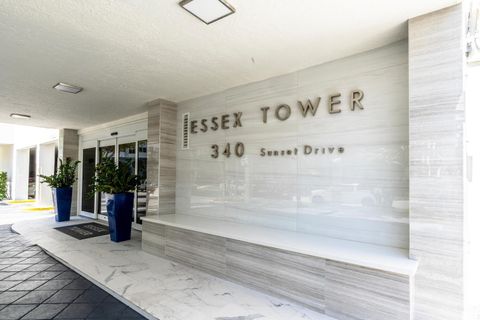
340 Sunset Dr, Fort Lauderdale, FL 33301
$-2,266
Cash flow
-18.8%
Cash-on-Cash Return
1.8%
Cap rate
0.6%
Rent to Value Ratio
Active
$439,000
1
bds
|
1
ba
|
577
sqft
|
built
2009
551 N Fort Lauderdale Beach Blvd, Fort Lauderdale, FL 33304
$-278
Cash flow
-3.3%
Cash-on-Cash Return
5.4%
Cap rate
0.9%
Rent to Value Ratio
Active
$699,000
2
bds
|
2
ba
|
1,656
sqft
|
built
1967
3430 Galt Ocean Dr, Fort Lauderdale, FL 33308
$-3,026
Cash flow
-22.6%
Cash-on-Cash Return
1.0%
Cap rate
0.6%
Rent to Value Ratio
Active
$2,475,000
4
bds
|
3
ba
|
2,588
sqft
|
built
1948
1420 Ponce De Leon Dr, Fort Lauderdale, FL 33316
$-7,404
Cash flow
-15.6%
Cash-on-Cash Return
2.6%
Cap rate
0.4%
Rent to Value Ratio
Active
$875,000
3
bds
|
2
ba
|
1,338
sqft
|
built
1951
1315 NE 16th Ave, Fort Lauderdale, FL 33304
$618
Cash flow
3.7%
Cash-on-Cash Return
7.0%
Cap rate
1.0%
Rent to Value Ratio

Active
$425,000
1
bds
|
1
ba
|
850
sqft
|
built
1967
4250 Galt Ocean Dr, Fort Lauderdale, FL 33308
$-1,231
Cash flow
-15.1%
Cash-on-Cash Return
2.7%
Cap rate
0.8%
Rent to Value Ratio
Active
$215,000
1
bds
|
1
ba
|
678
sqft
|
built
1967
2424 SE 17th St, Fort Lauderdale, FL 33316
$-991
Cash flow
-24.0%
Cash-on-Cash Return
0.6%
Cap rate
0.7%
Rent to Value Ratio
Active
$799,000
2
bds
|
2
ba
|
1,450
sqft
|
built
1967
4300 N Ocean Blvd, Fort Lauderdale, FL 33308
$-2,245
Cash flow
-14.7%
Cash-on-Cash Return
2.8%
Cap rate
0.8%
Rent to Value Ratio

Active
$299,900
2
bds
|
2
ba
|
855
sqft
|
built
1974
633 NE 2nd Ave, Fort Lauderdale, FL 33304
$-659
Cash flow
-11.5%
Cash-on-Cash Return
3.5%
Cap rate
0.7%
Rent to Value Ratio
Active
$380,000
2
bds
|
2
ba
|
814
sqft
|
built
1973
1731 SE 15th St, Fort Lauderdale, FL 33316
$-1,234
Cash flow
-16.9%
Cash-on-Cash Return
2.3%
Cap rate
0.7%
Rent to Value Ratio
Active
$600,000
2
bds
|
1
ba
|
992
sqft
|
built
1952
901 NE 16th Pl, Fort Lauderdale, FL 33305
$-1,757
Cash flow
-15.3%
Cash-on-Cash Return
2.6%
Cap rate
0.5%
Rent to Value Ratio

Active
$3,900,000
5
bds
|
7
ba
|
0
sqft
|
built
2024
2018 NE 31st Ave, Fort Lauderdale, FL 33305
$-17,777
Cash flow
-23.8%
Cash-on-Cash Return
0.7%
Cap rate
0.1%
Rent to Value Ratio