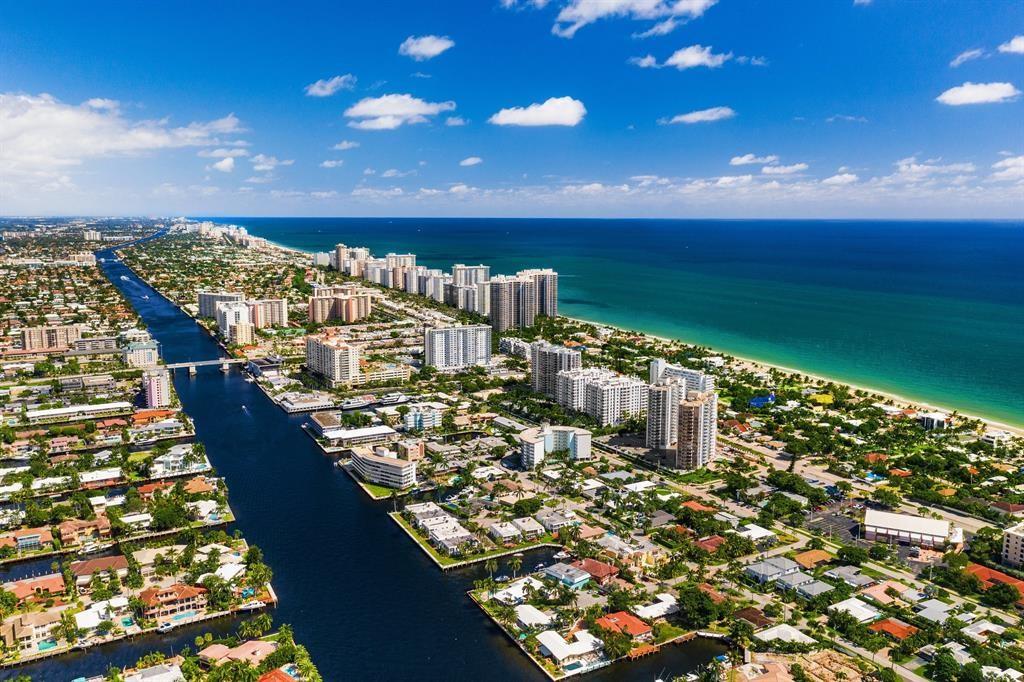
Fort Lauderdale, FL Investment Properties for Sale
Browse homes for sale and investment properties in Fort Lauderdale, FL. Refine your search by price, property type, or more.
Best cash flowing properties in Fort Lauderdale, FL

Active
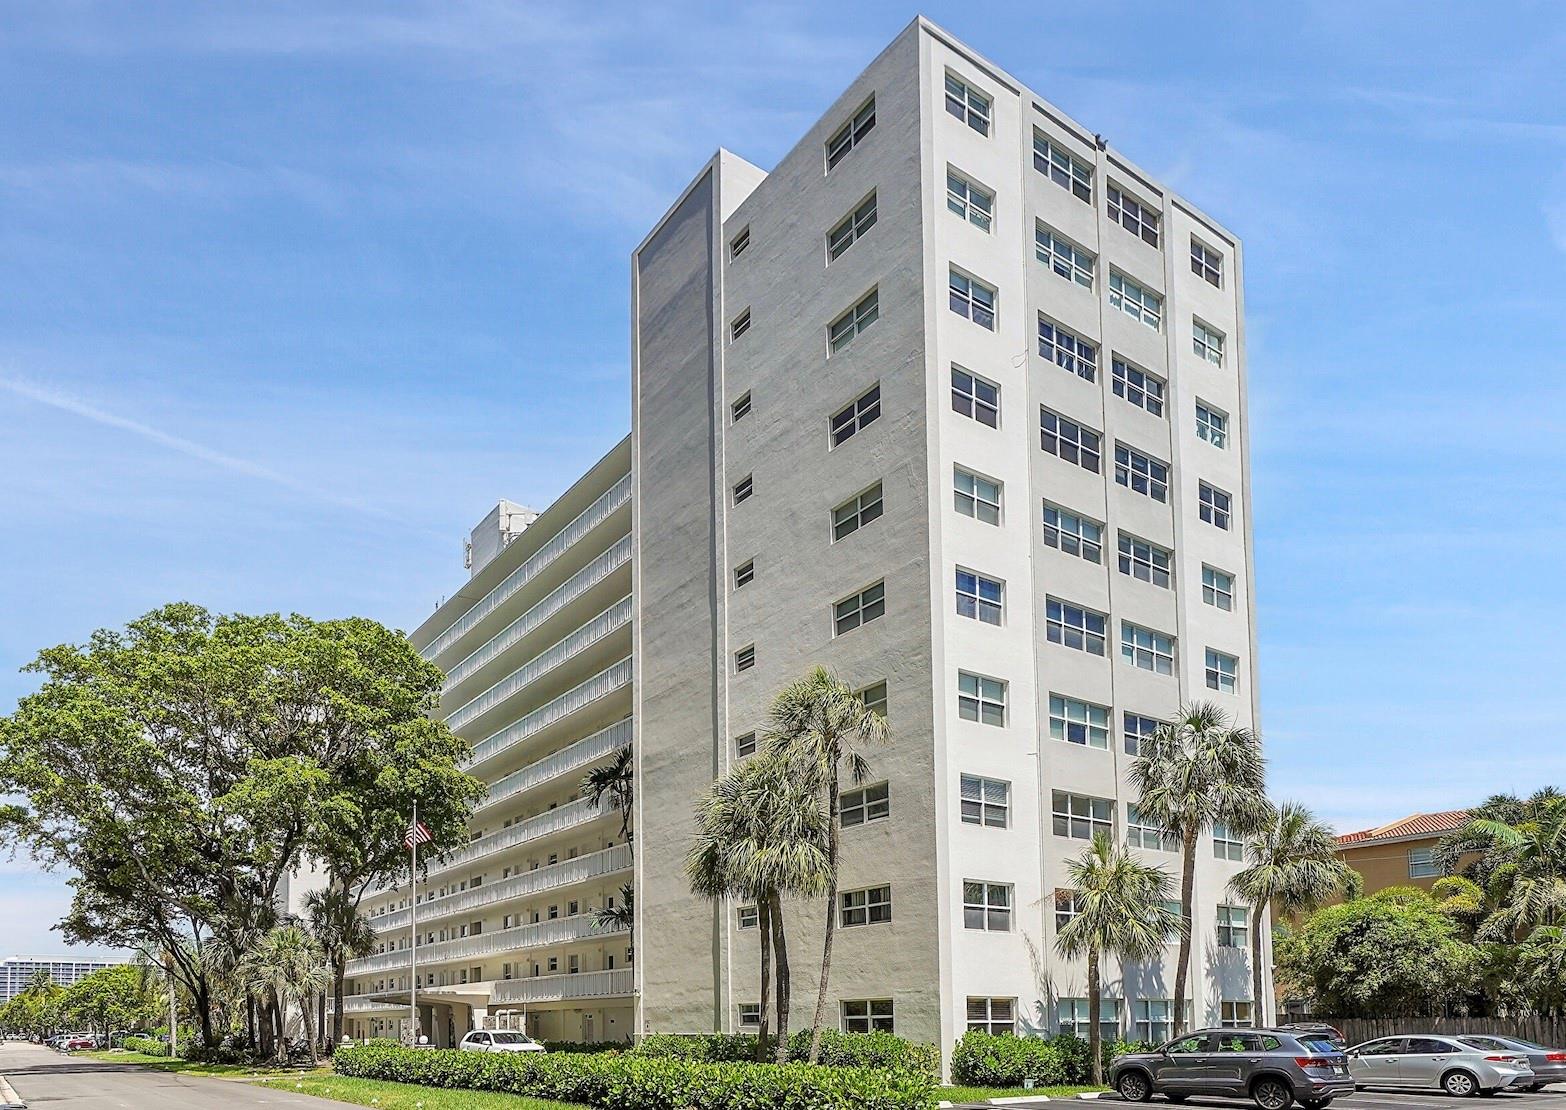
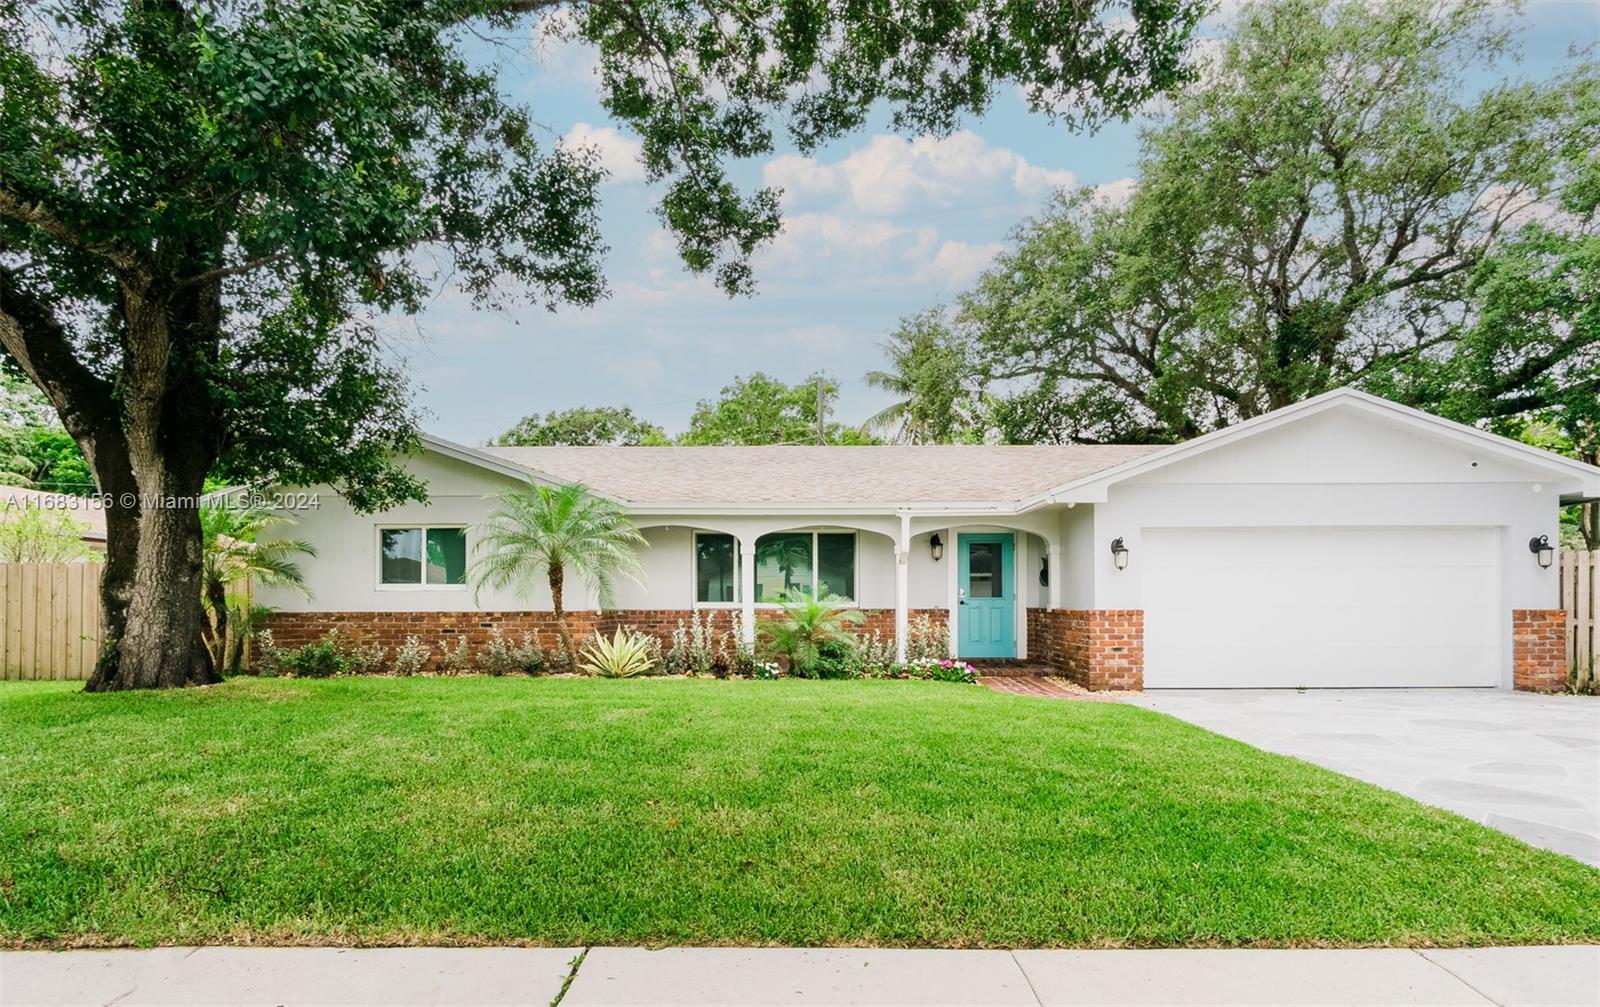
$499,900
2
bds
|
2
ba
|
1,290
sqft
|
built
1981
3200 Port Royale Dr N, Fort Lauderdale, FL 33308
$-540
Cash flow
-5.6%
Cash-on-Cash Return
4.9%
Cap rate
0.6%
Rent to Value Ratio
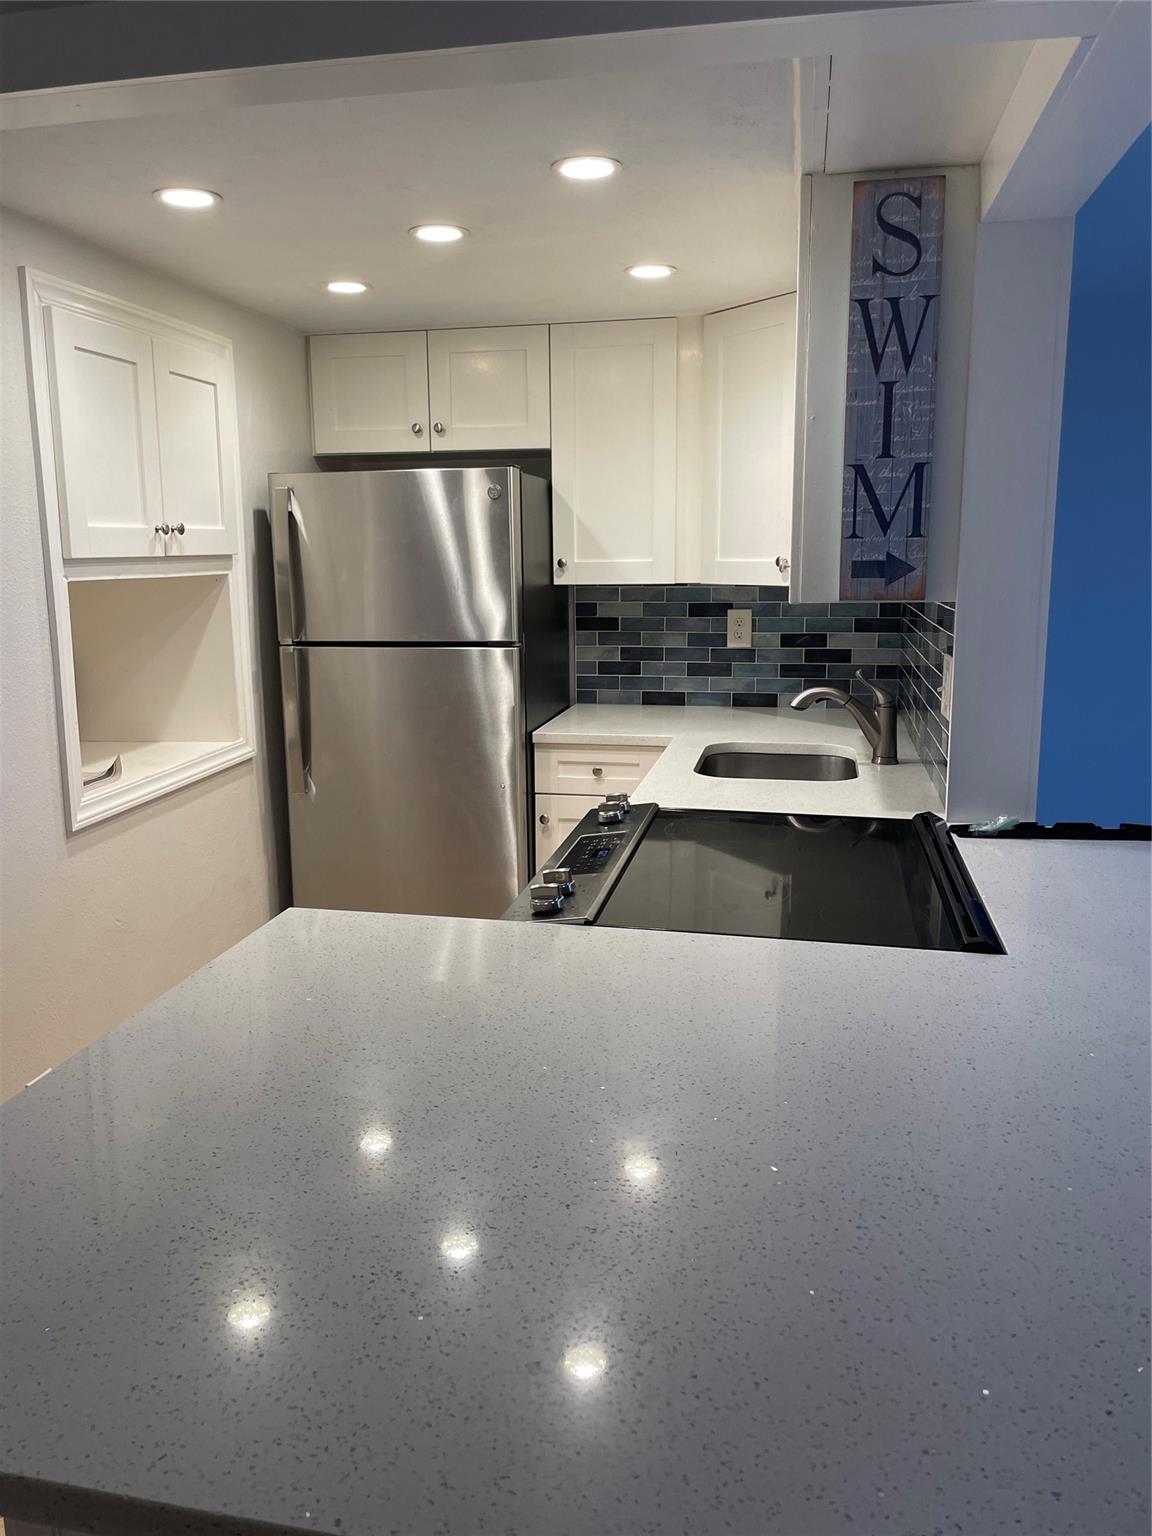
Active
$425,000
3
bds
|
2
ba
|
1,104
sqft
|
built
1954
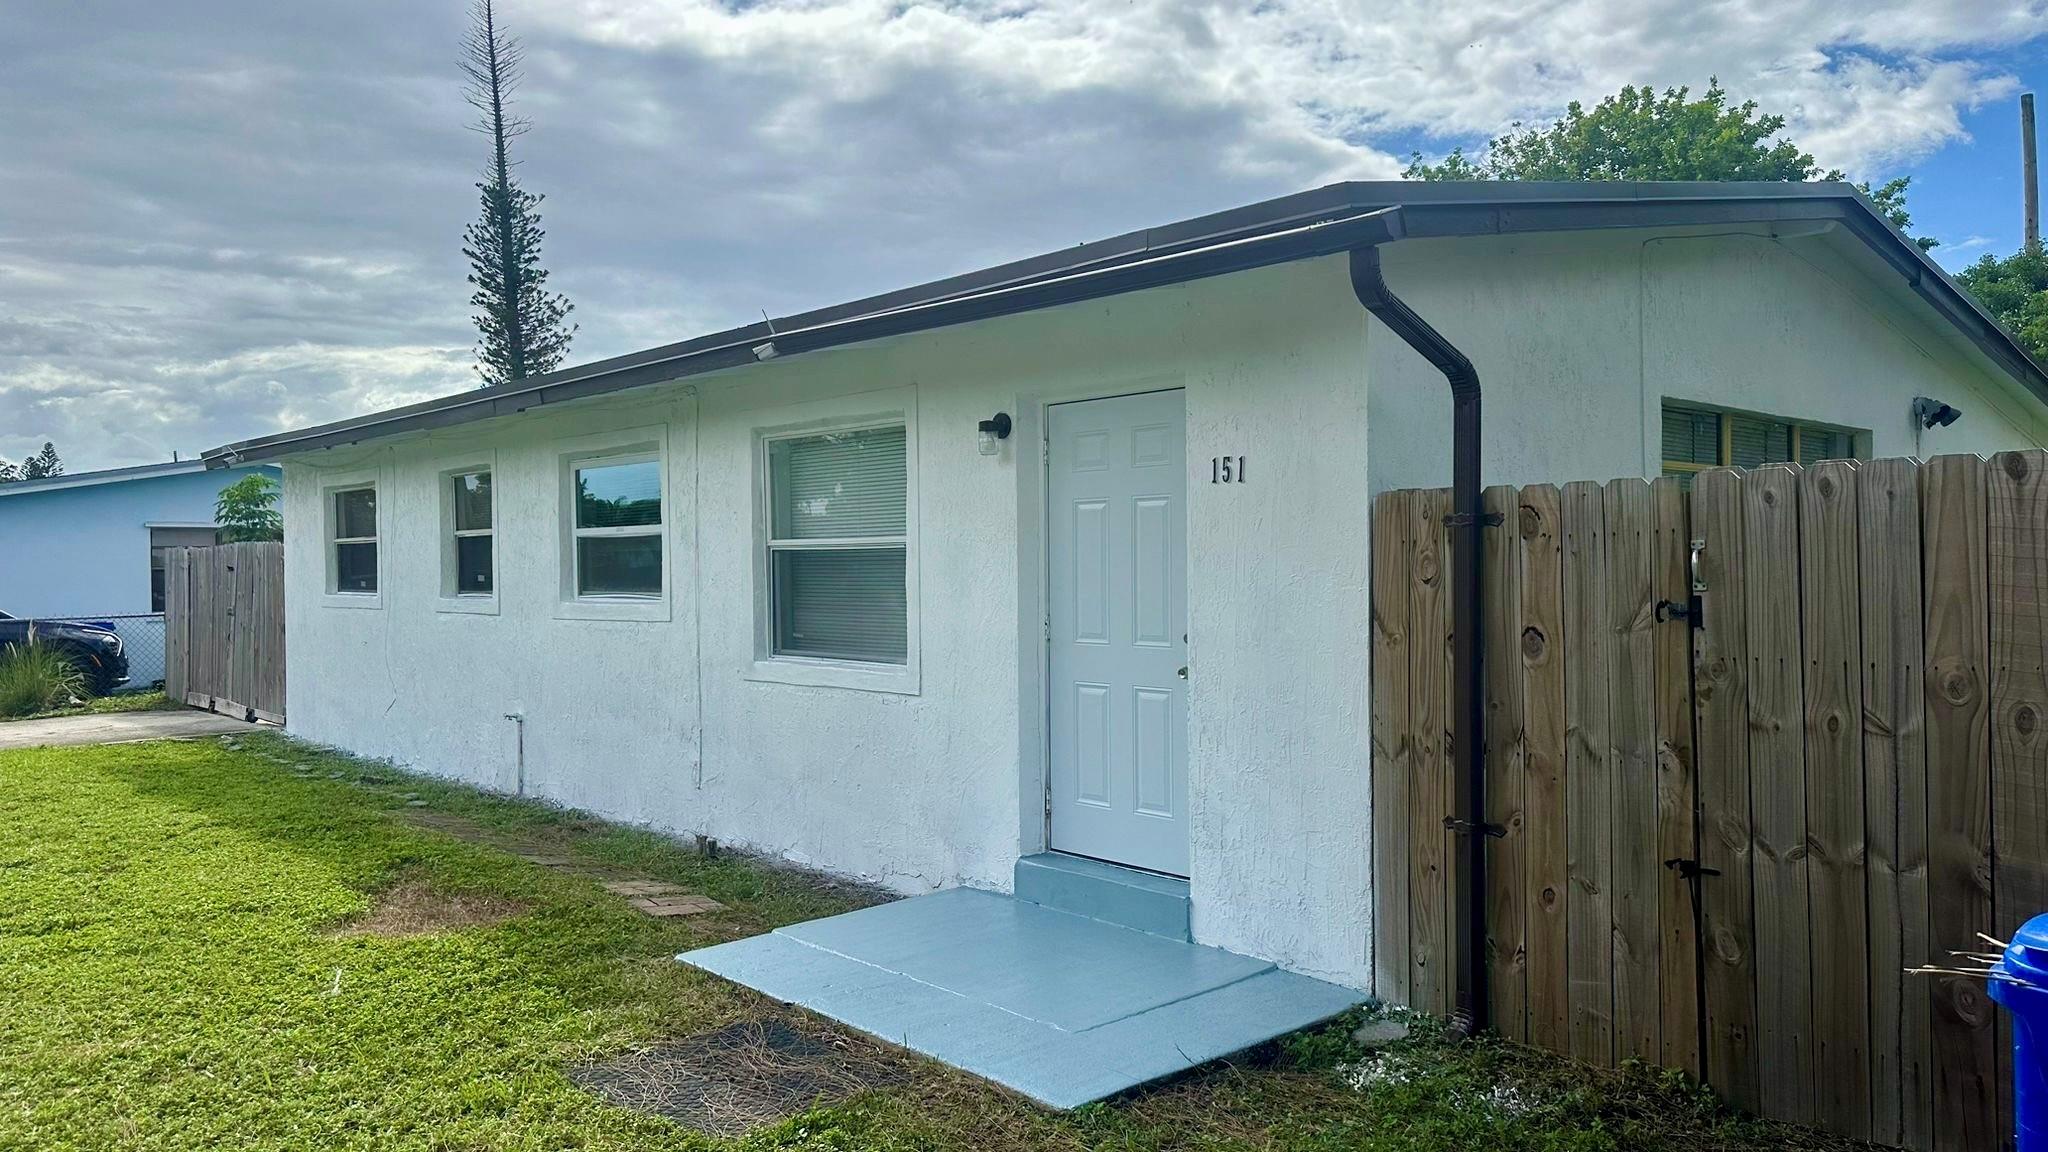
1513 NW 19th Ave, Fort Lauderdale, FL 33311
$-575
Cash flow
-7.1%
Cash-on-Cash Return
4.5%
Cap rate
0.7%
Rent to Value Ratio
2,118 out of 2,494 properties for sale in Fort Lauderdale, FL
Limited Results Shown
Create a free account, or log in to reveal all property listings and enjoy the complete experience.
Active
$240,000
1
bds
|
1
ba
|
710
sqft
|
built
1965
2555 NE 11th St, Fort Lauderdale, FL 33304
$-816
Cash flow
-17.7%
Cash-on-Cash Return
2.1%
Cap rate
0.8%
Rent to Value Ratio
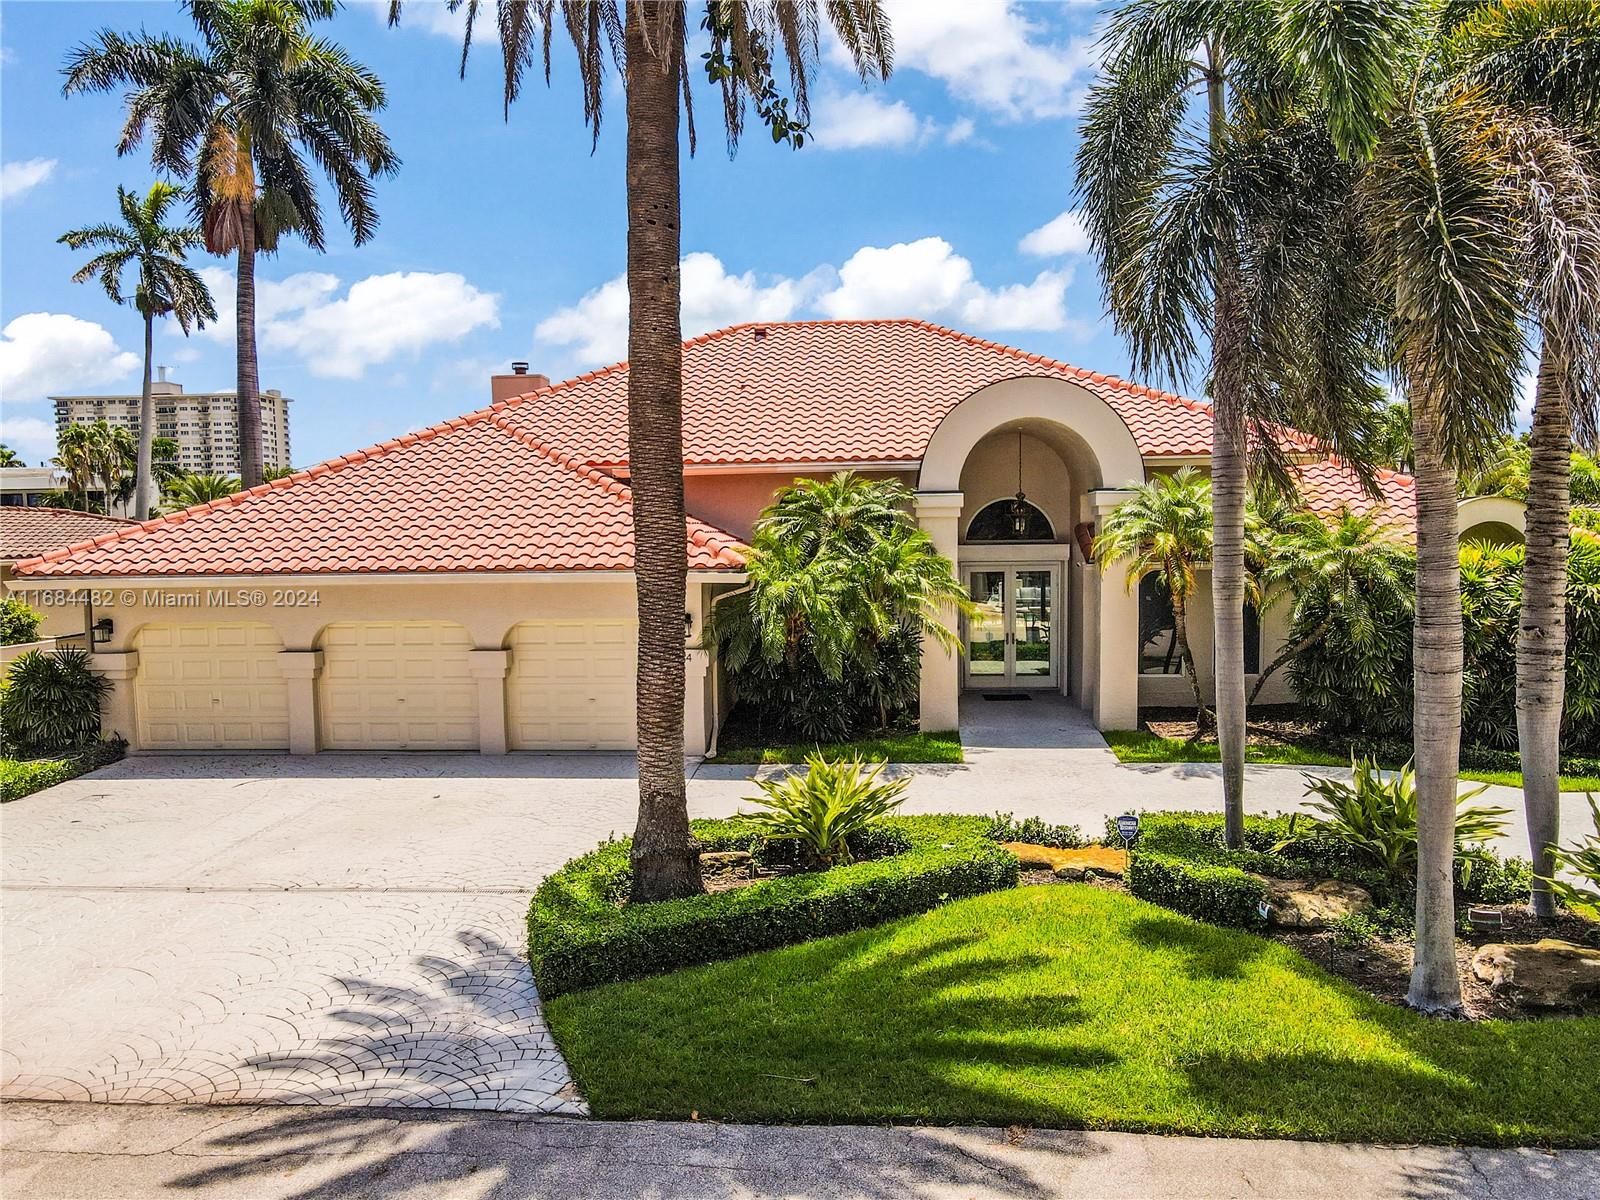
Active
$5,795,000
4
bds
|
4
ba
|
3,817
sqft
|
built
1991
34 Pelican Dr, Fort Lauderdale, FL 33301
$-28,426
Cash flow
-25.6%
Cash-on-Cash Return
0.3%
Cap rate
0.2%
Rent to Value Ratio
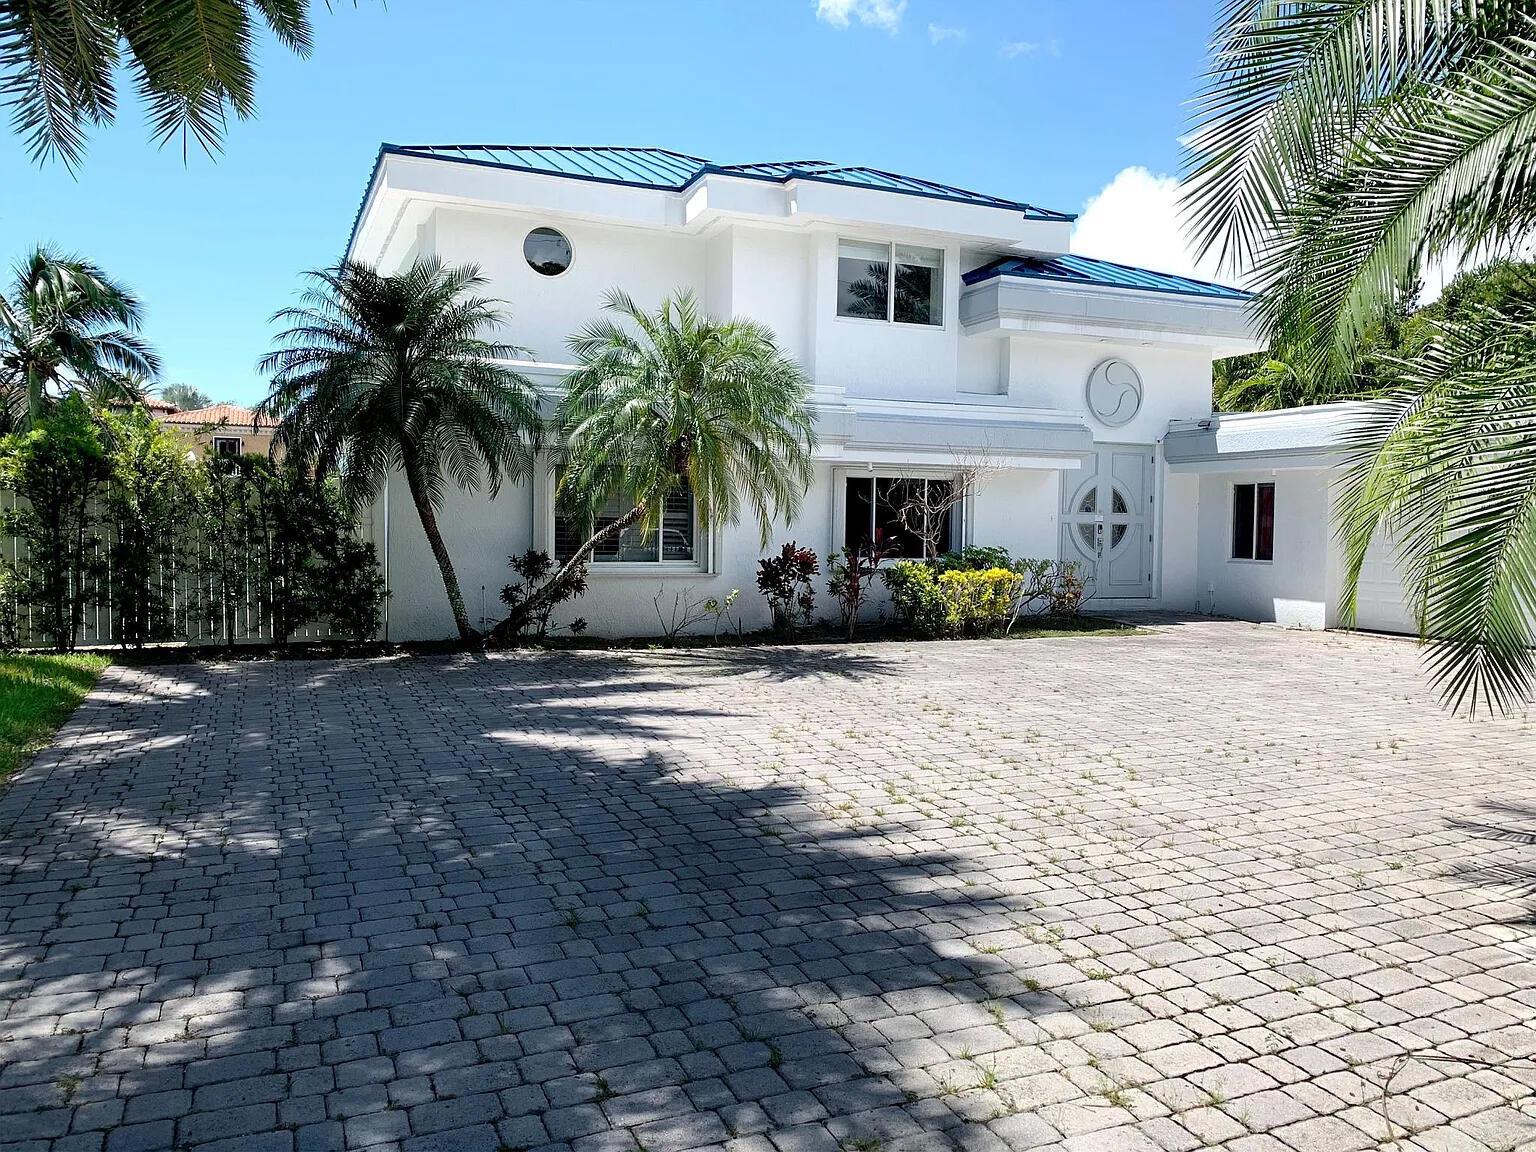
Active
$5,950,000
5
bds
|
5
ba
|
3,034
sqft
|
built
1965
1740 SE 7th St, Fort Lauderdale, FL 33316
$-27,810
Cash flow
-24.4%
Cash-on-Cash Return
0.5%
Cap rate
0.1%
Rent to Value Ratio

Active
$399,000
2
bds
|
1
ba
|
1,216
sqft
|
built
1977
3100 NE 48th St, Fort Lauderdale, FL 33308
$-1,017
Cash flow
-13.3%
Cash-on-Cash Return
3.1%
Cap rate
0.8%
Rent to Value Ratio
Active
$1,200,000
3
bds
|
3
ba
|
1,724
sqft
|
built
1951
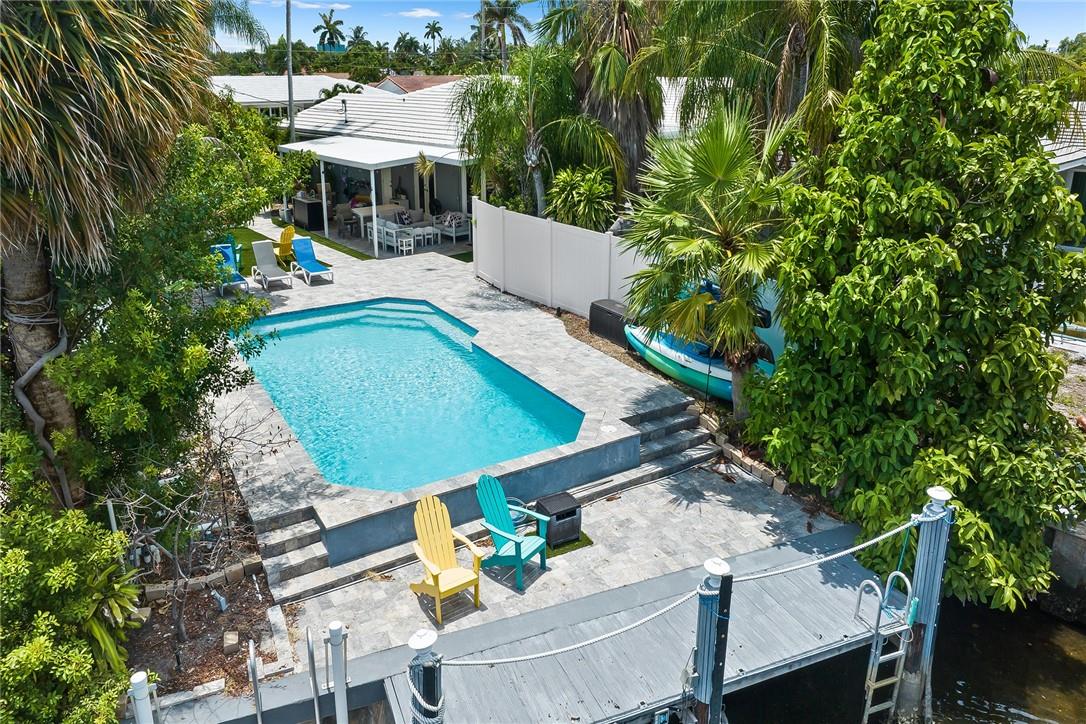
2889 Riverland Rd, Fort Lauderdale, FL 33312
$-2,157
Cash flow
-9.4%
Cash-on-Cash Return
4.0%
Cap rate
0.5%
Rent to Value Ratio
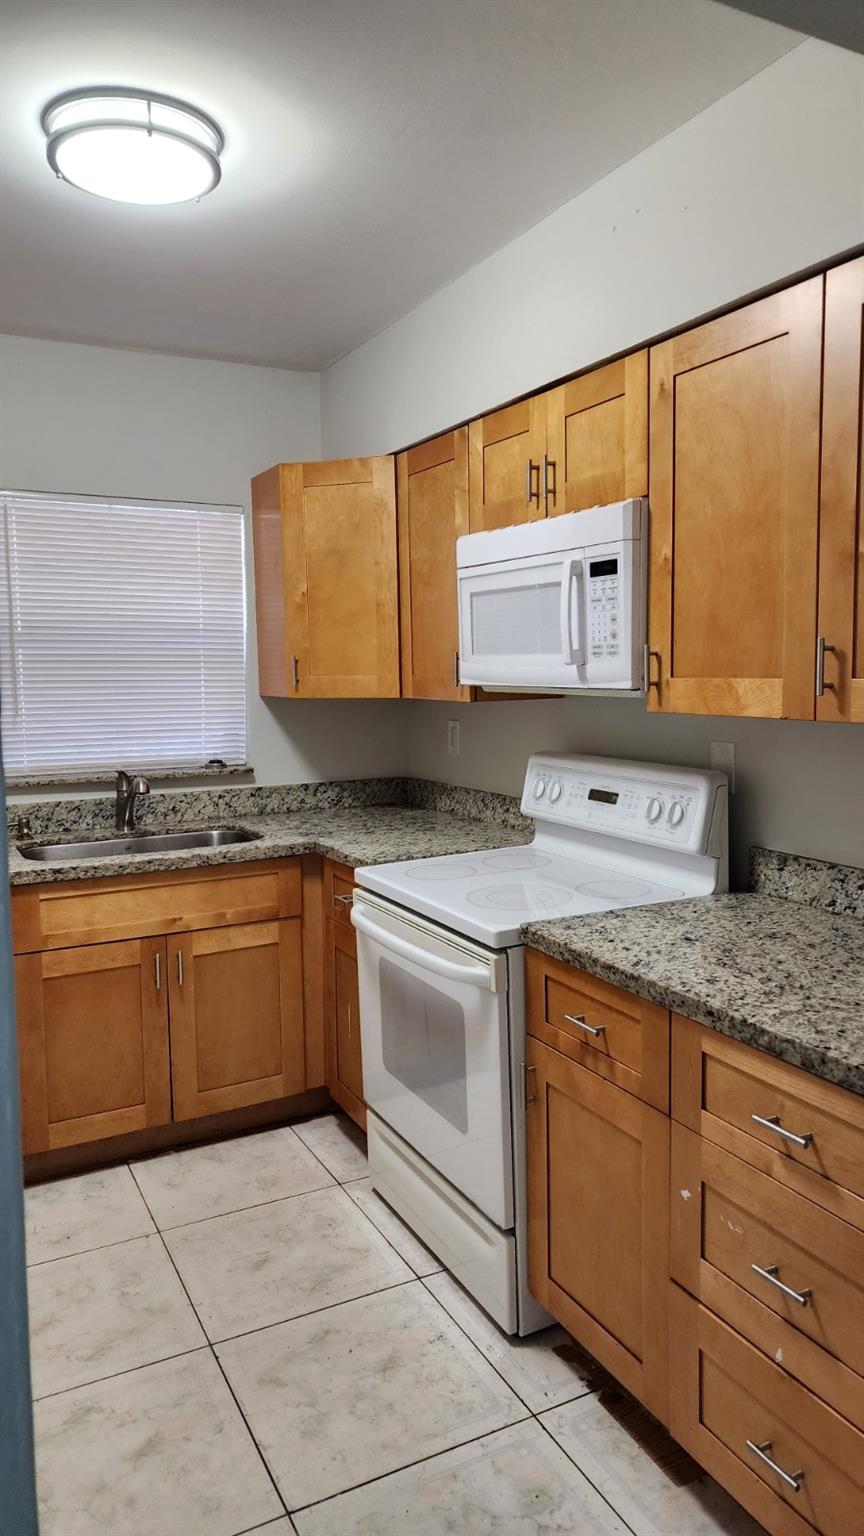
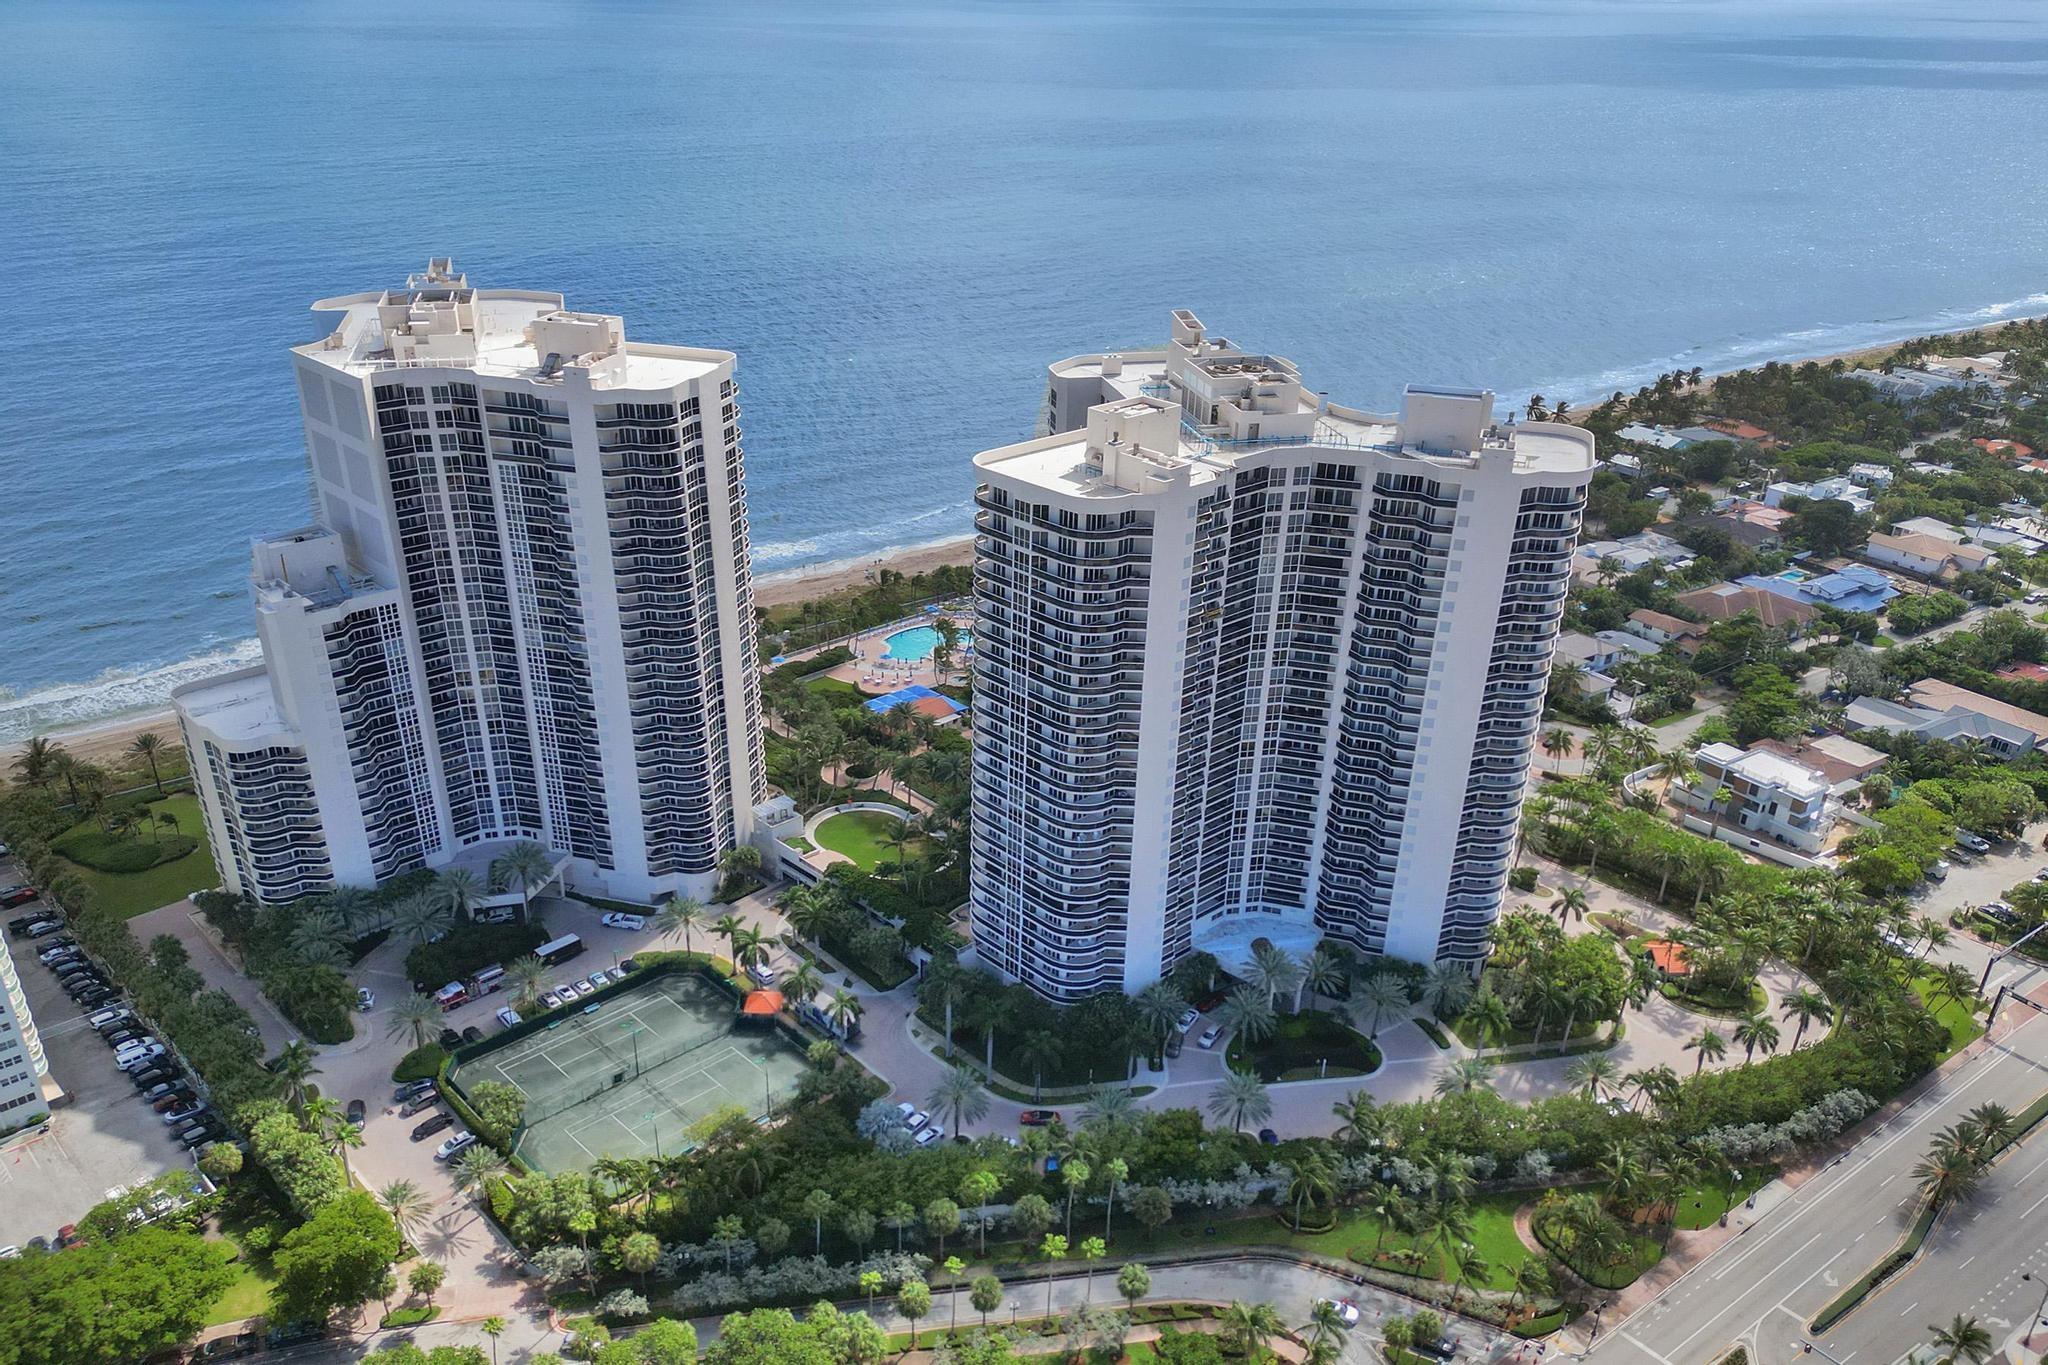
Active
$349,000
1
bds
|
1
ba
|
776
sqft
|
built
2005
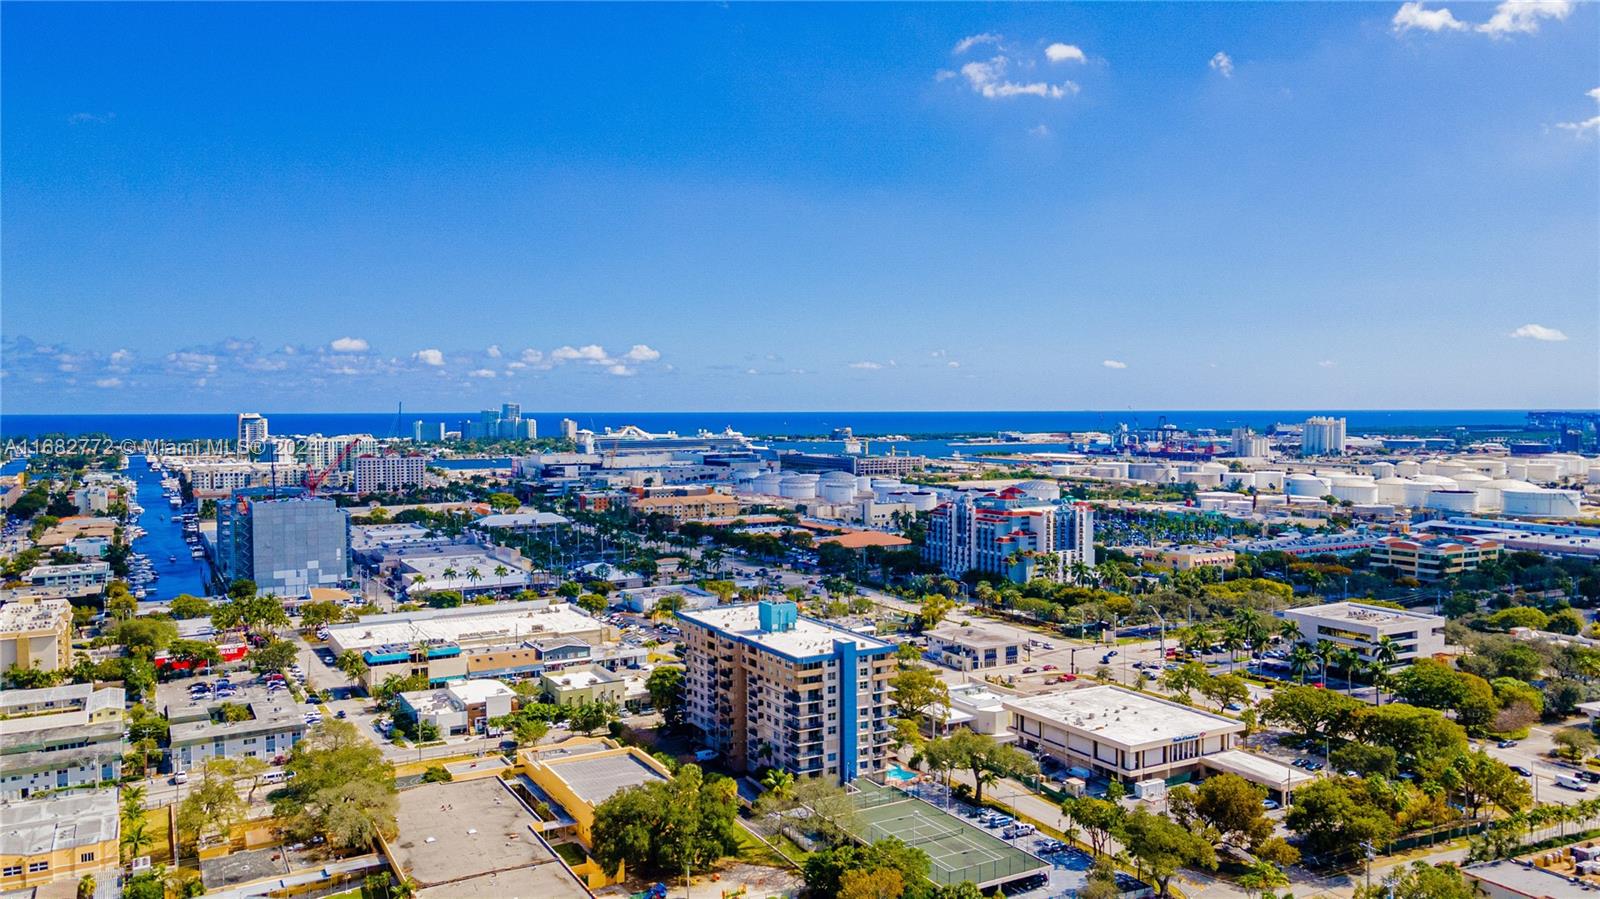
610 W Las Olas Blvd, Fort Lauderdale, FL 33312
$-1,424
Cash flow
-21.3%
Cash-on-Cash Return
1.3%
Cap rate
0.7%
Rent to Value Ratio
Active
$22,900,000
6
bds
|
9
ba
|
13,084
sqft
|
built
2020
671 Middle River Dr, Fort Lauderdale, FL 33304
$-129,278
Cash flow
-29.5%
Cash-on-Cash Return
-0.6%
Cap rate
0.1%
Rent to Value Ratio
Active
$4,995,000
3
bds
|
5
ba
|
4,043
sqft
|
built
1998
3055 Harbor Dr, Fort Lauderdale, FL 33316
$-28,117
Cash flow
-29.4%
Cash-on-Cash Return
-0.6%
Cap rate
0.2%
Rent to Value Ratio
Active under contract
$685,000
3
bds
|
2
ba
|
1,650
sqft
|
built
1975
2610 SW 16th St, Fort Lauderdale, FL 33312
$-838
Cash flow
-6.4%
Cash-on-Cash Return
4.7%
Cap rate
0.7%
Rent to Value Ratio
Active
$325,000
1
bds
|
1
ba
|
795
sqft
|
built
1970
1731 SE 15th St, Fort Lauderdale, FL 33316
$-1,264
Cash flow
-20.3%
Cash-on-Cash Return
1.5%
Cap rate
0.6%
Rent to Value Ratio
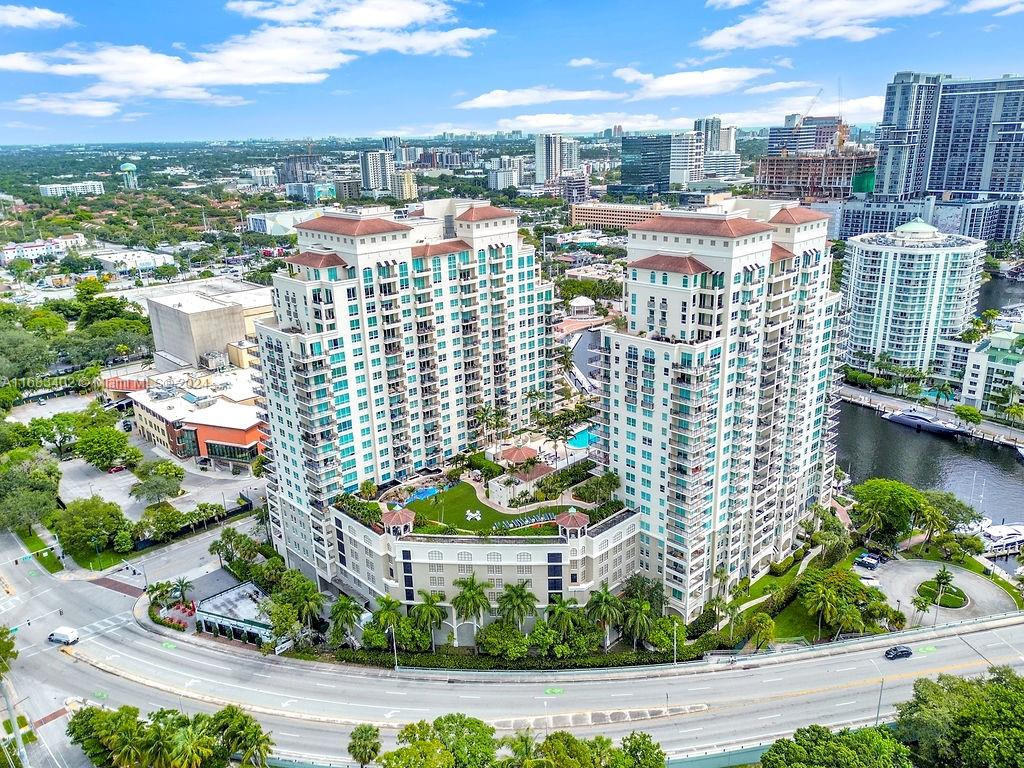
Active
$549,000
2
bds
|
2
ba
|
1,214
sqft
|
built
1966
3000 Holiday Dr, Fort Lauderdale, FL 33316
$-2,242
Cash flow
-21.3%
Cash-on-Cash Return
1.2%
Cap rate
0.6%
Rent to Value Ratio
Active
$499,900
2
bds
|
2
ba
|
1,290
sqft
|
built
1981
3200 Port Royale Dr N, Fort Lauderdale, FL 33308
$-540
Cash flow
-5.6%
Cash-on-Cash Return
4.9%
Cap rate
0.6%
Rent to Value Ratio
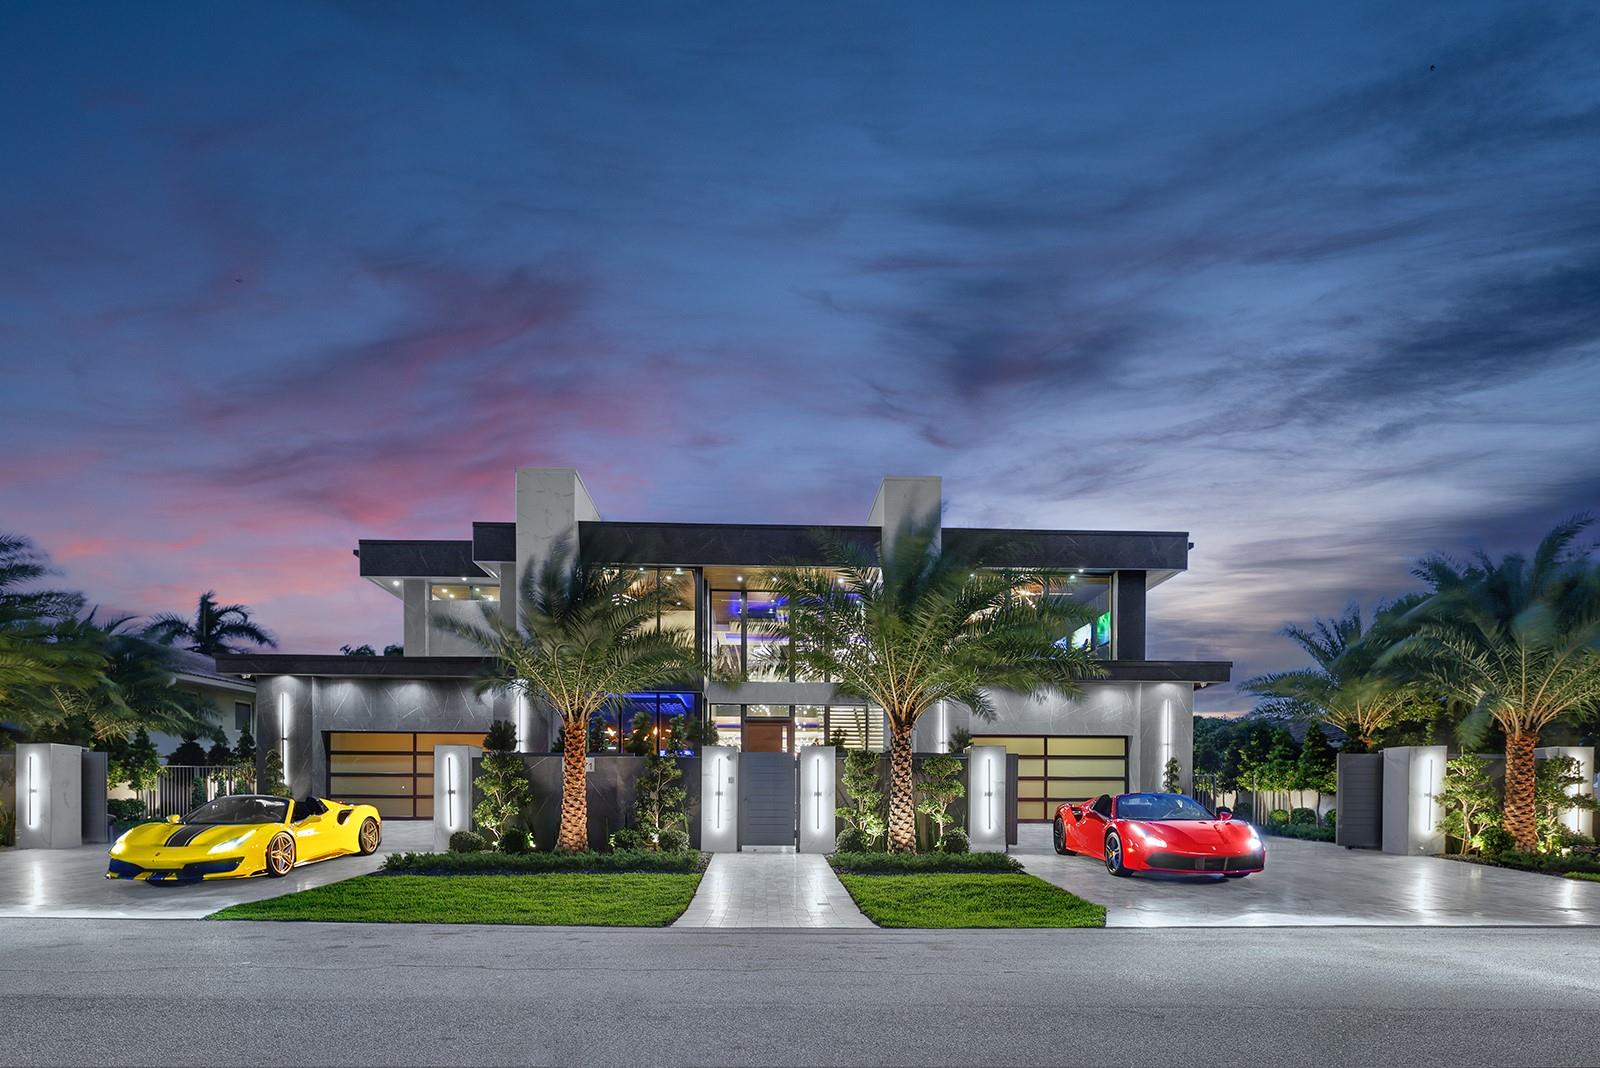
Active
$42,500,000
6
bds
|
13
ba
|
14,000
sqft
|
built
1998
1 Isla Bahia Dr, Fort Lauderdale, FL 33316
$-235,910
Cash flow
-29.0%
Cash-on-Cash Return
-0.5%
Cap rate
0.0%
Rent to Value Ratio
Active
$1,899,999
5
bds
|
5
ba
|
2,946
sqft
|
built
1974
3317 NE 38th St, Fort Lauderdale, FL 33308
$-4,593
Cash flow
-12.6%
Cash-on-Cash Return
3.2%
Cap rate
0.6%
Rent to Value Ratio
Active
$1,995,000
3
bds
|
4
ba
|
3,309
sqft
|
built
1996
301 N Birch Rd, Fort Lauderdale, FL 33304
$-8,578
Cash flow
-22.4%
Cash-on-Cash Return
1.0%
Cap rate
0.5%
Rent to Value Ratio
Active
$2,195,000
4
bds
|
4
ba
|
4,100
sqft
|
built
1974
5961 Bayview Dr, Fort Lauderdale, FL 33308
$-5,981
Cash flow
-14.2%
Cash-on-Cash Return
2.9%
Cap rate
0.5%
Rent to Value Ratio
Active
$2,350,000
3
bds
|
3
ba
|
3,223
sqft
|
built
2004
333 Las Olas Way, Fort Lauderdale, FL 33301
$-11,745
Cash flow
-26.1%
Cash-on-Cash Return
0.1%
Cap rate
0.4%
Rent to Value Ratio
Active
$1,449,000
3
bds
|
3
ba
|
2,708
sqft
|
built
1970
2801 NE 59th St, Fort Lauderdale, FL 33308
$-2,408
Cash flow
-8.7%
Cash-on-Cash Return
4.2%
Cap rate
0.6%
Rent to Value Ratio
Active
$425,000
3
bds
|
2
ba
|
1,104
sqft
|
built
1954
1513 NW 19th Ave, Fort Lauderdale, FL 33311
$-575
Cash flow
-7.1%
Cash-on-Cash Return
4.5%
Cap rate
0.7%
Rent to Value Ratio
Active
$329,900
2
bds
|
2
ba
|
1,260
sqft
|
built
1975
1625 SE 10th Ave, Fort Lauderdale, FL 33316
$-1,420
Cash flow
-22.5%
Cash-on-Cash Return
1.0%
Cap rate
0.7%
Rent to Value Ratio
Active
$625,000
bds
|
0
ba
|
2,498
sqft
|
built
1971
1523-1525 NW 8th Ave, Fort Lauderdale, FL 33311
$-2,501
Cash flow
-20.9%
Cash-on-Cash Return
1.3%
Cap rate
0.3%
Rent to Value Ratio

Active
$349,900
2
bds
|
2
ba
|
1,250
sqft
|
built
1970
2881 NE 33rd Ct, Fort Lauderdale, FL 33306
$-1,261
Cash flow
-18.8%
Cash-on-Cash Return
1.8%
Cap rate
0.8%
Rent to Value Ratio
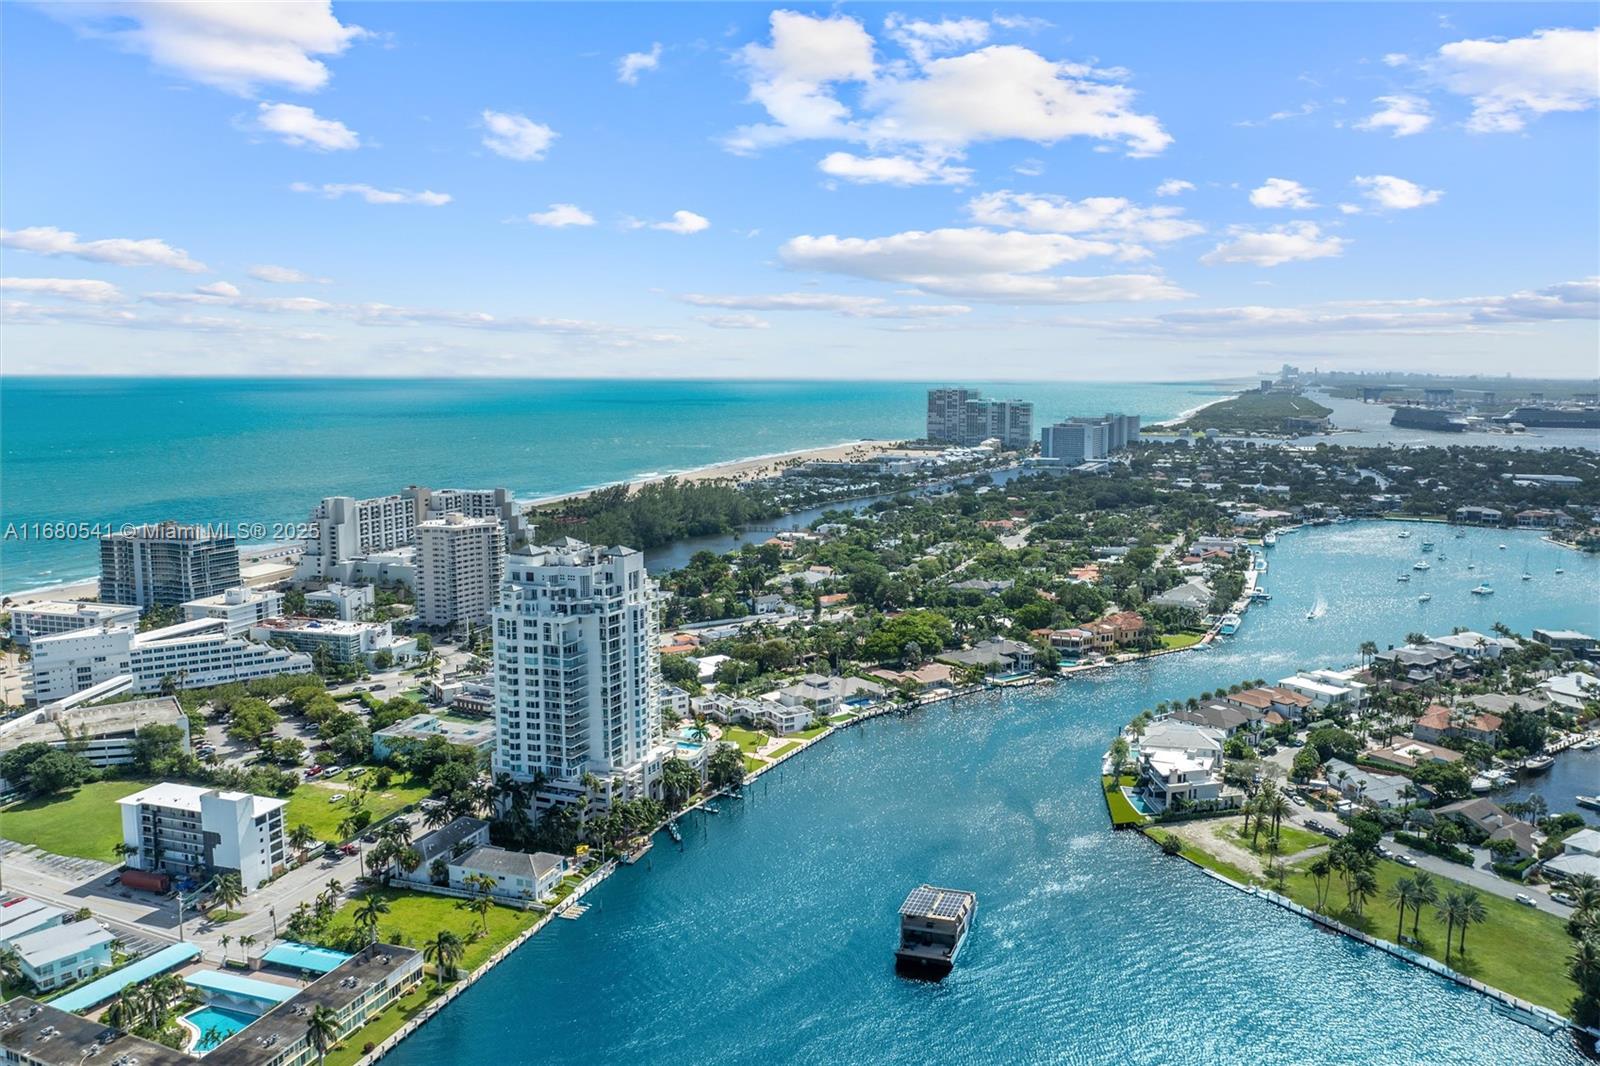
Active
$1,550,000
3
bds
|
3
ba
|
1,977
sqft
|
built
1997
3100 N Ocean Blvd, Fort Lauderdale, FL 33308
$-5,440
Cash flow
-18.3%
Cash-on-Cash Return
1.9%
Cap rate
0.6%
Rent to Value Ratio
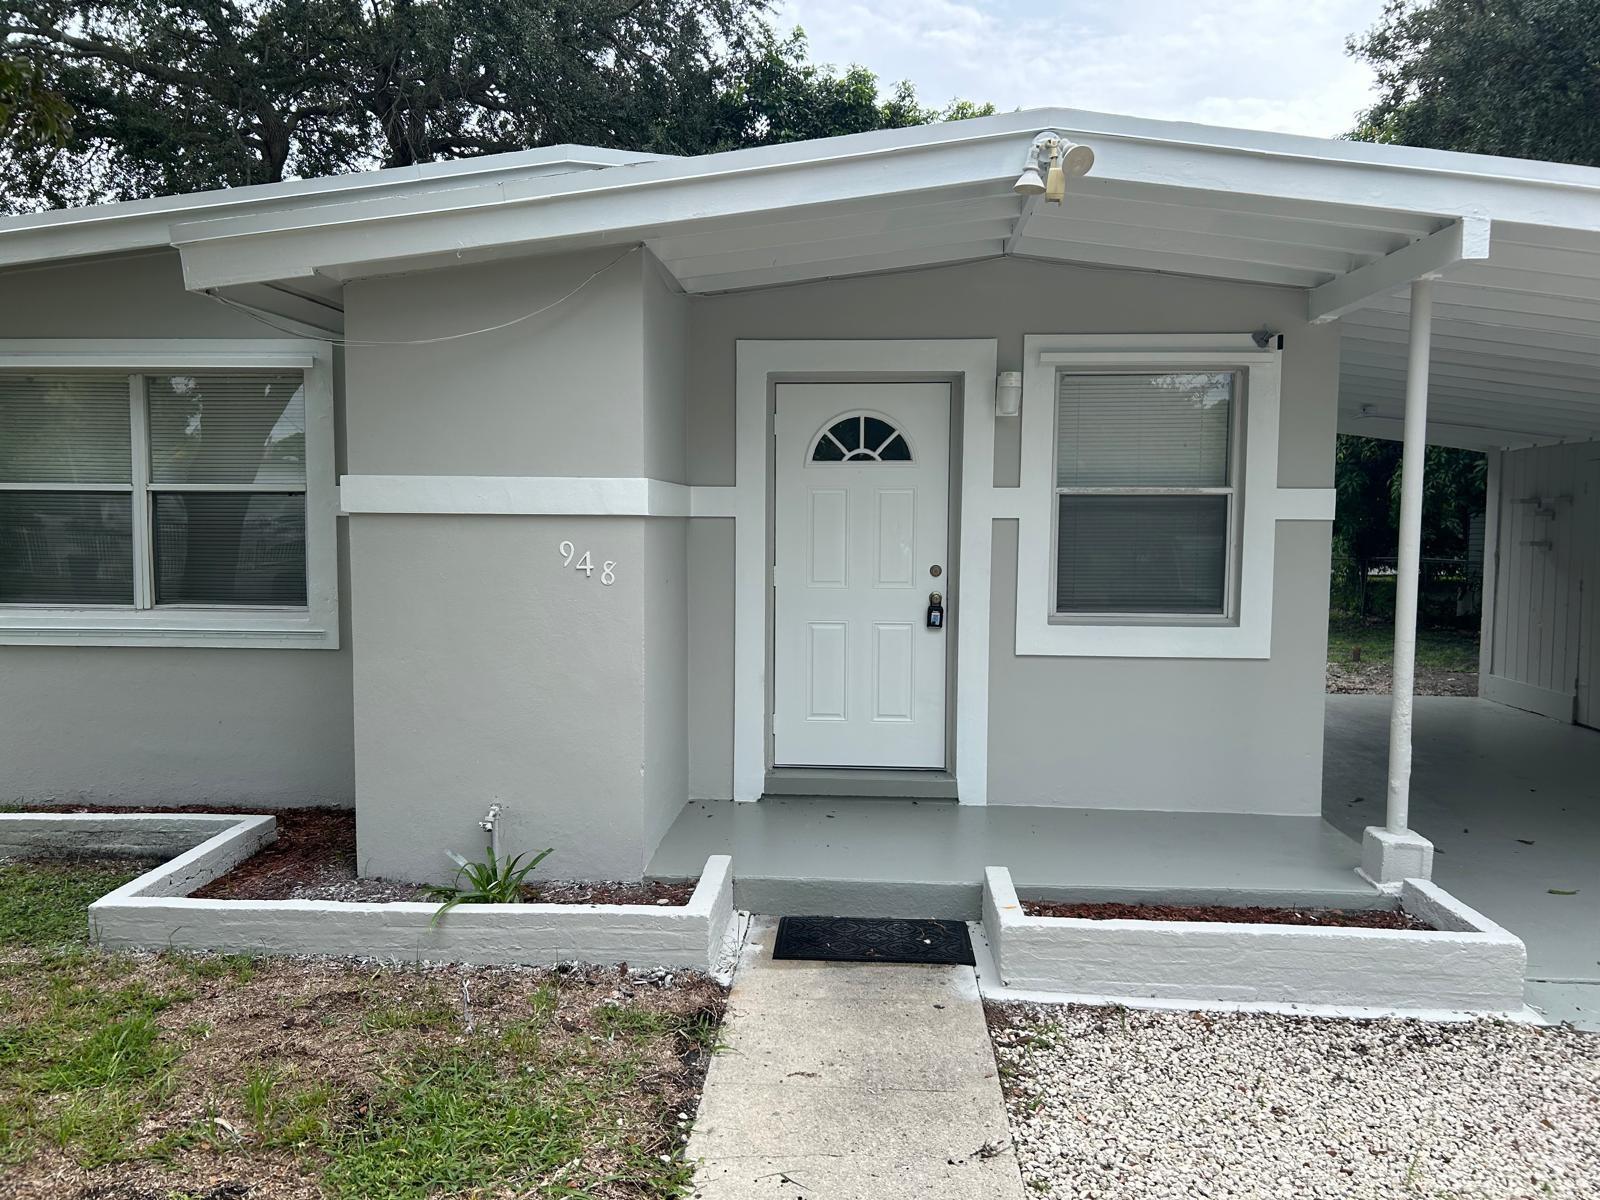
Active
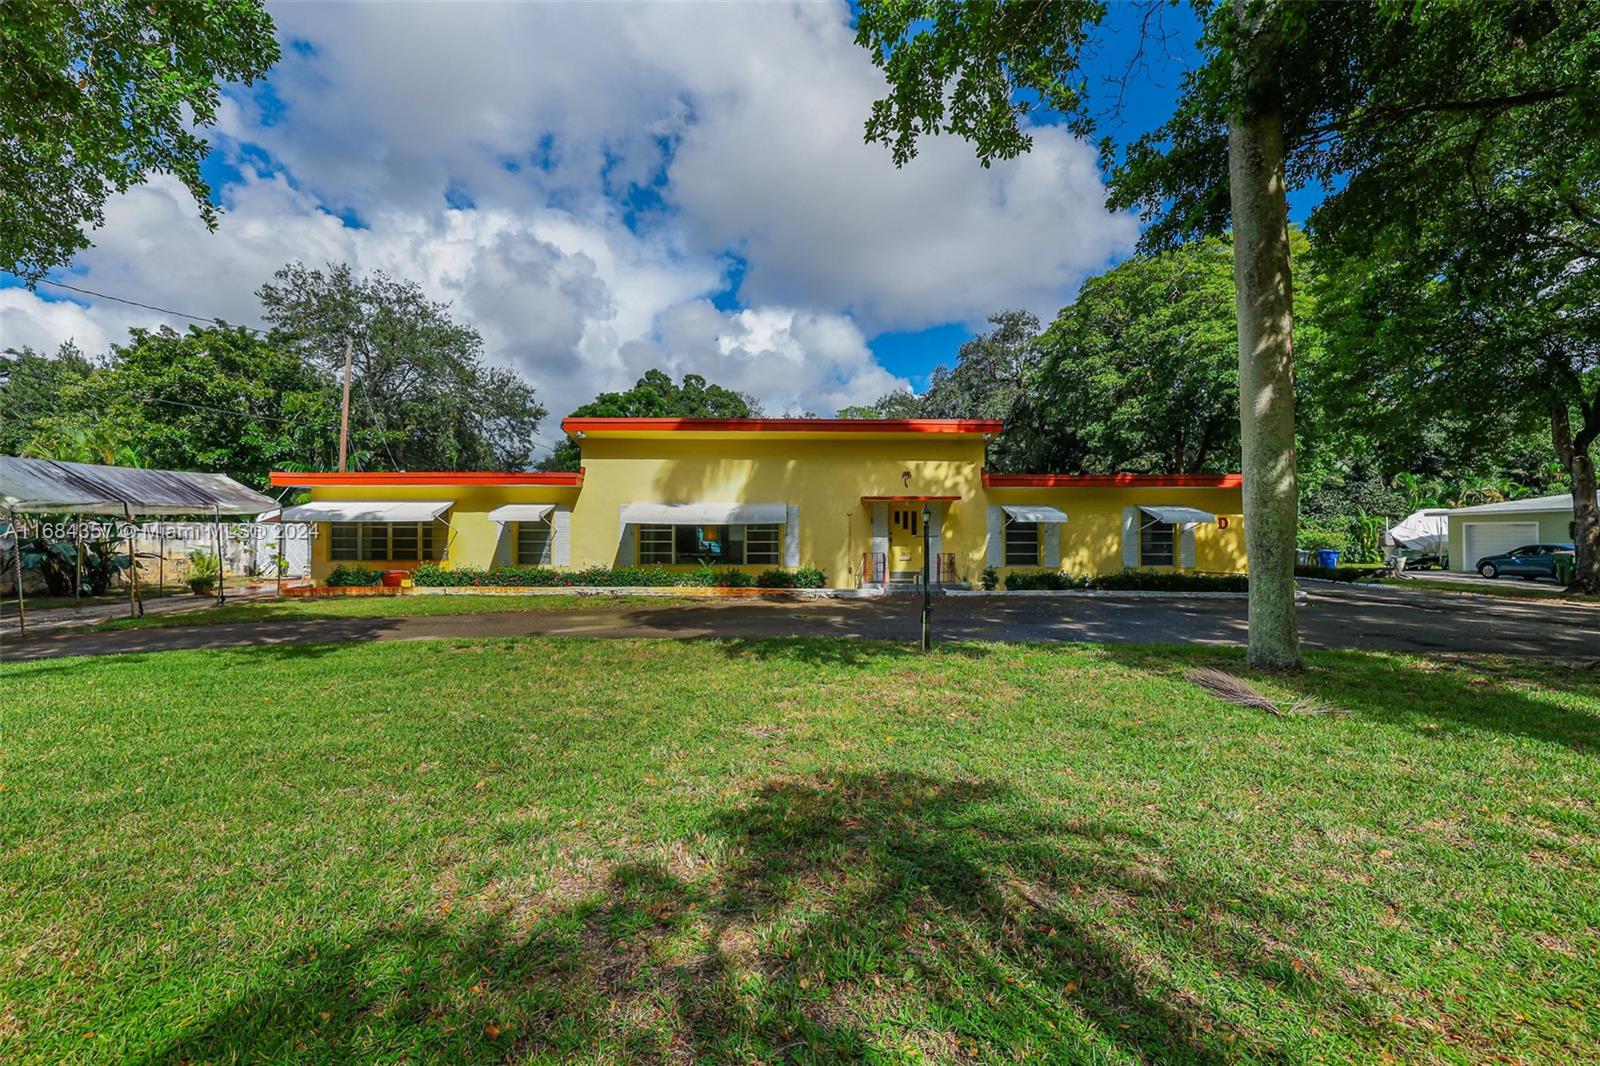
$450,000
3
bds
|
1
ba
|
941
sqft
|
built
1956
948 NW 14th Ct, Fort Lauderdale, FL 33311
$-1,094
Cash flow
-12.7%
Cash-on-Cash Return
3.2%
Cap rate
0.5%
Rent to Value Ratio

Active
$399,050
2
bds
|
2
ba
|
1,054
sqft
|
built
2001
2021 SE 10th Ave, Fort Lauderdale, FL 33316
$-1,171
Cash flow
-15.3%
Cash-on-Cash Return
2.6%
Cap rate
0.7%
Rent to Value Ratio
Active
$6,995,000
4
bds
|
5
ba
|
5,166
sqft
|
built
2000
2009 Sunrise Key Blvd, Fort Lauderdale, FL 33304
$-31,916
Cash flow
-23.8%
Cash-on-Cash Return
0.7%
Cap rate
0.1%
Rent to Value Ratio
Active
$5,300,000
4
bds
|
5
ba
|
4,754
sqft
|
built
2018
3300 NE 39th St, Fort Lauderdale, FL 33308
$-24,877
Cash flow
-24.5%
Cash-on-Cash Return
0.5%
Cap rate
0.2%
Rent to Value Ratio
Active
$2,200,000
3
bds
|
3
ba
|
2,718
sqft
|
built
1972
2314 Desota Dr, Fort Lauderdale, FL 33301
$-6,500
Cash flow
-15.4%
Cash-on-Cash Return
2.6%
Cap rate
0.4%
Rent to Value Ratio
Active
$465,000
2
bds
|
2
ba
|
1,250
sqft
|
built
1974
1301 River Reach Dr, Fort Lauderdale, FL 33315
$-1,776
Cash flow
-19.9%
Cash-on-Cash Return
1.6%
Cap rate
0.7%
Rent to Value Ratio
Active
$519,000
2
bds
|
2
ba
|
1,473
sqft
|
built
1971
720 Bayshore Dr, Fort Lauderdale, FL 33304
$-1,741
Cash flow
-17.5%
Cash-on-Cash Return
2.1%
Cap rate
0.7%
Rent to Value Ratio
Active
$2,600,000
4
bds
|
5
ba
|
2,879
sqft
|
built
2020
624 N Victoria Park Rd, Fort Lauderdale, FL 33304
$-9,167
Cash flow
-18.4%
Cash-on-Cash Return
1.9%
Cap rate
0.4%
Rent to Value Ratio

Active
$5,399,900
5
bds
|
4
ba
|
4,251
sqft
|
built
2003
449 Isle Of Palms Dr, Fort Lauderdale, FL 33301
$-23,540
Cash flow
-22.7%
Cash-on-Cash Return
0.9%
Cap rate
0.2%
Rent to Value Ratio
Active
$475,000
2
bds
|
2
ba
|
1,596
sqft
|
built
1971
4020 Galt Ocean Dr, Fort Lauderdale, FL 33308
$-1,723
Cash flow
-18.9%
Cash-on-Cash Return
1.8%
Cap rate
0.8%
Rent to Value Ratio
Active
$329,900
1
bds
|
1
ba
|
900
sqft
|
built
1973
2715 N Ocean Blvd, Fort Lauderdale, FL 33308
$-968
Cash flow
-15.3%
Cash-on-Cash Return
2.6%
Cap rate
0.8%
Rent to Value Ratio
Active
$6,950,000
5
bds
|
5
ba
|
7,358
sqft
|
built
1990
3061 NE 44th St, Fort Lauderdale, FL 33308
$-30,450
Cash flow
-22.9%
Cash-on-Cash Return
0.9%
Cap rate
0.2%
Rent to Value Ratio
Active
$3,645,000
3
bds
|
4
ba
|
3,812
sqft
|
built
1974
2616 Acacia Ct, Fort Lauderdale, FL 33301
$-15,761
Cash flow
-22.6%
Cash-on-Cash Return
1.0%
Cap rate
0.3%
Rent to Value Ratio
Active
$374,900
2
bds
|
2
ba
|
1,250
sqft
|
built
1972
1350 River Reach Dr, Fort Lauderdale, FL 33315
$-1,115
Cash flow
-15.5%
Cash-on-Cash Return
2.6%
Cap rate
0.9%
Rent to Value Ratio
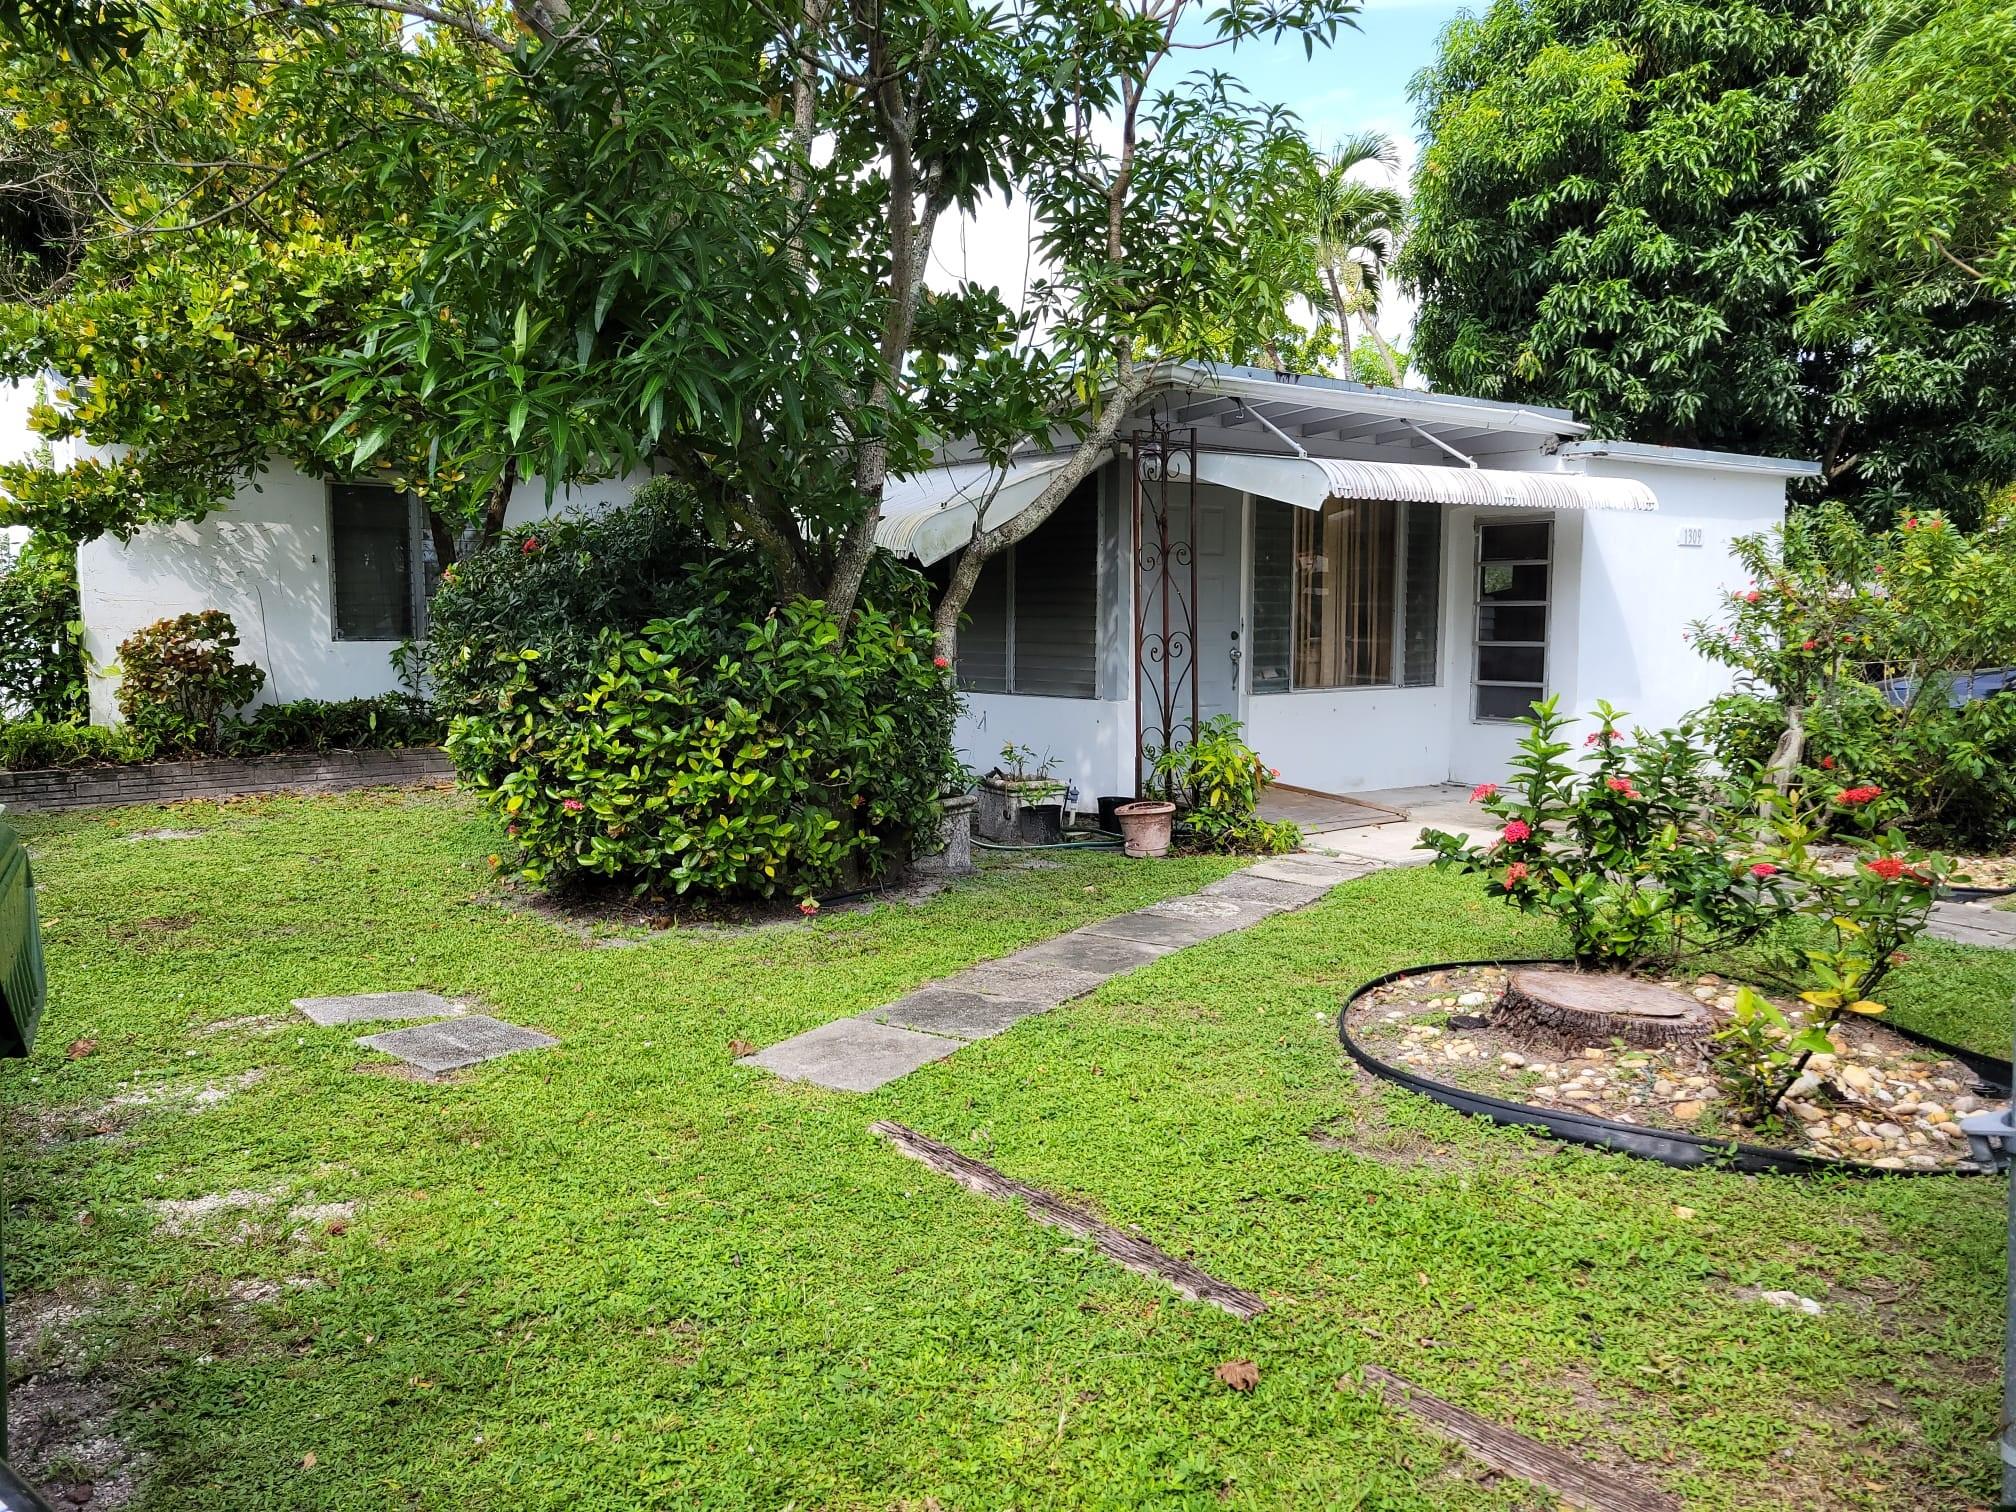
Active
$499,000
3
bds
|
2
ba
|
1,529
sqft
|
built
1954
1309 NW 3rd Ave, Fort Lauderdale, FL 33311
$-904
Cash flow
-9.5%
Cash-on-Cash Return
4.0%
Cap rate
0.5%
Rent to Value Ratio
Active
$2,275,000
5
bds
|
4
ba
|
2,762
sqft
|
built
1954
2046 NE 15th St, Fort Lauderdale, FL 33304
$-5,313
Cash flow
-12.2%
Cash-on-Cash Return
3.3%
Cap rate
0.4%
Rent to Value Ratio
Active
$580,000
2
bds
|
2
ba
|
1,400
sqft
|
built
1970
3100 NE 49th St, Fort Lauderdale, FL 33308
$-2,295
Cash flow
-20.6%
Cash-on-Cash Return
1.4%
Cap rate
0.6%
Rent to Value Ratio