Fort Lauderdale, FL Investment Properties for Sale
Browse homes for sale and investment properties in Fort Lauderdale, FL. Refine your search by price, property type, or more.
Best cash flowing properties in Fort Lauderdale, FL
Active
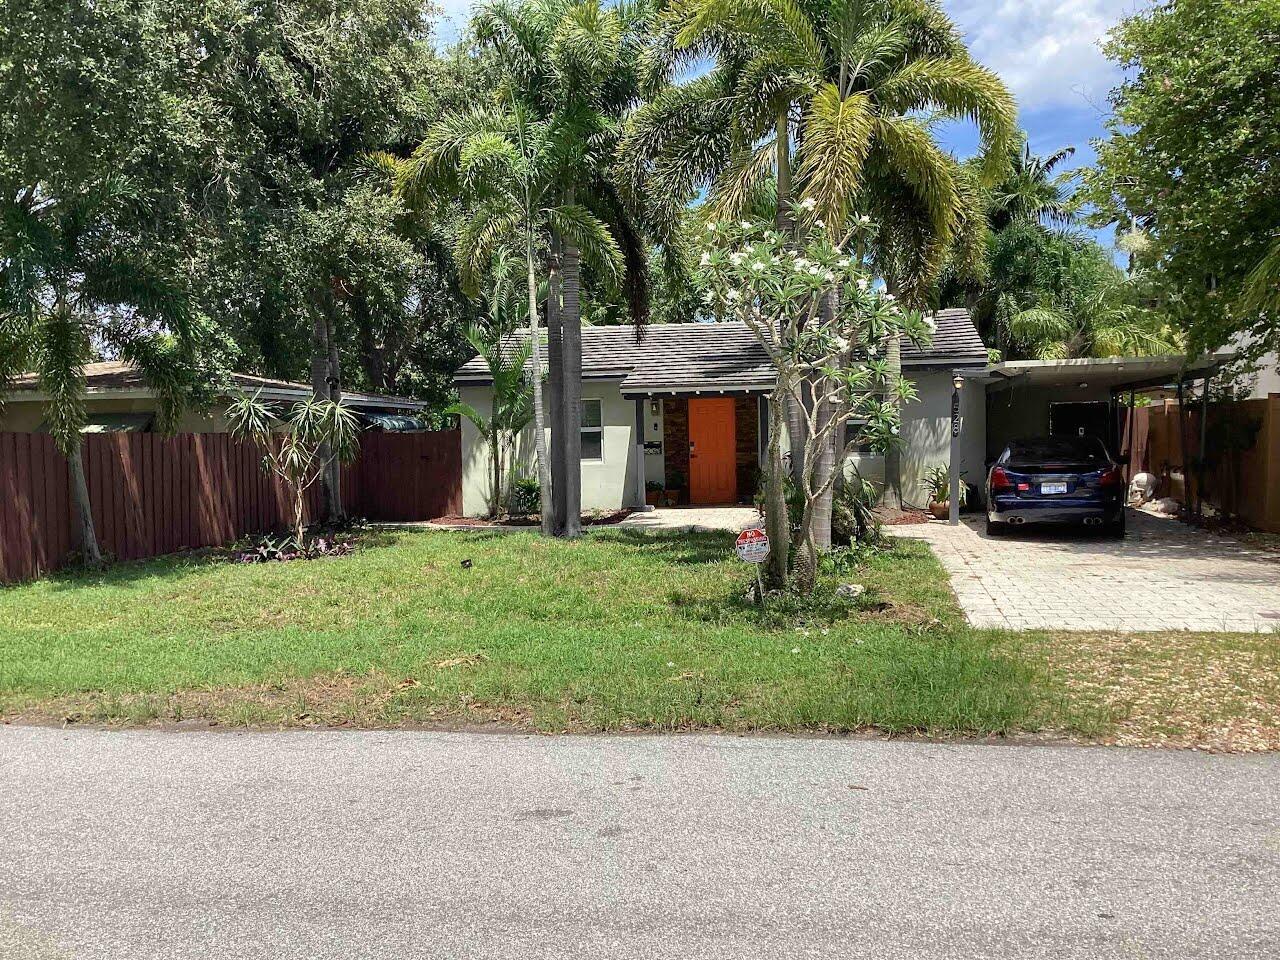
$429,999
3
bds
|
1
ba
|
1,011
sqft
|
built
1954
529 SW 22nd Ave, Fort Lauderdale, FL 33312
$-158
Cash flow
-1.9%
Cash-on-Cash Return
5.7%
Cap rate
0.7%
Rent to Value Ratio
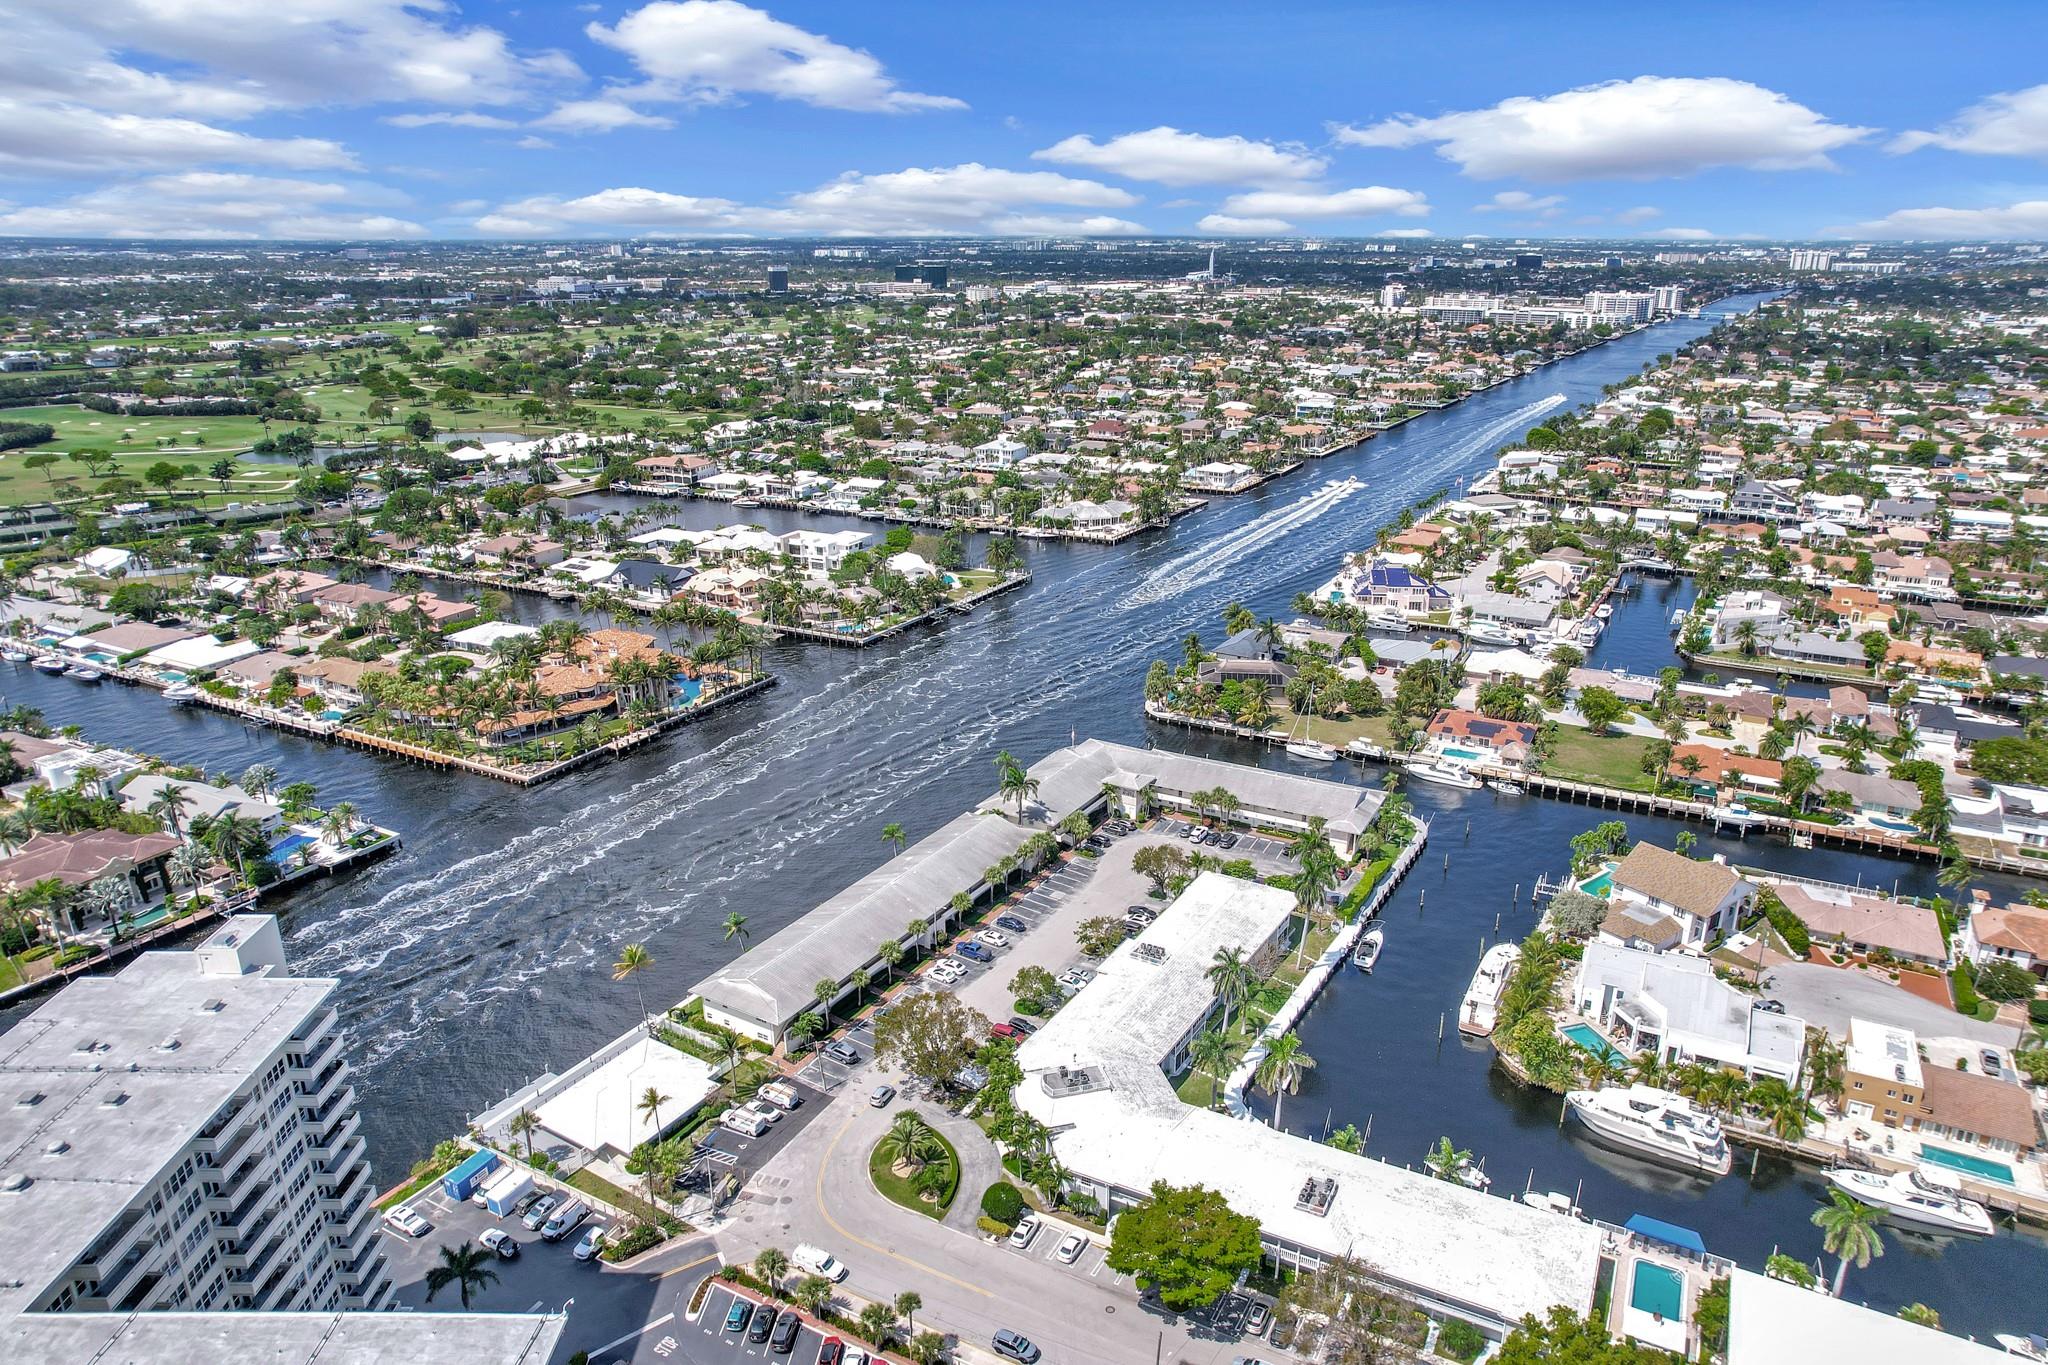
Active
$259,000
1
bds
|
1
ba
|
704
sqft
|
built
1973
1731 SE 15th St, Fort Lauderdale, FL 33316
$-593
Cash flow
-11.9%
Cash-on-Cash Return
3.4%
Cap rate
0.8%
Rent to Value Ratio
2,118 out of 2,494 properties for sale in Fort Lauderdale, FL
Limited Results Shown
Create a free account, or log in to reveal all property listings and enjoy the complete experience.
Active
$1,299,000
3
bds
|
3
ba
|
2,150
sqft
|
built
1969
3850 Galt Ocean Dr, Fort Lauderdale, FL 33308
$-3,159
Cash flow
-12.7%
Cash-on-Cash Return
3.2%
Cap rate
0.6%
Rent to Value Ratio
Active
$2,490,000
3
bds
|
3
ba
|
1,977
sqft
|
built
1997
3100 N Ocean Blvd, Fort Lauderdale, FL 33308
$-8,103
Cash flow
-17.0%
Cash-on-Cash Return
2.2%
Cap rate
0.4%
Rent to Value Ratio
Active
$4,495,000
2
bds
|
3
ba
|
2,237
sqft
|
built
2022
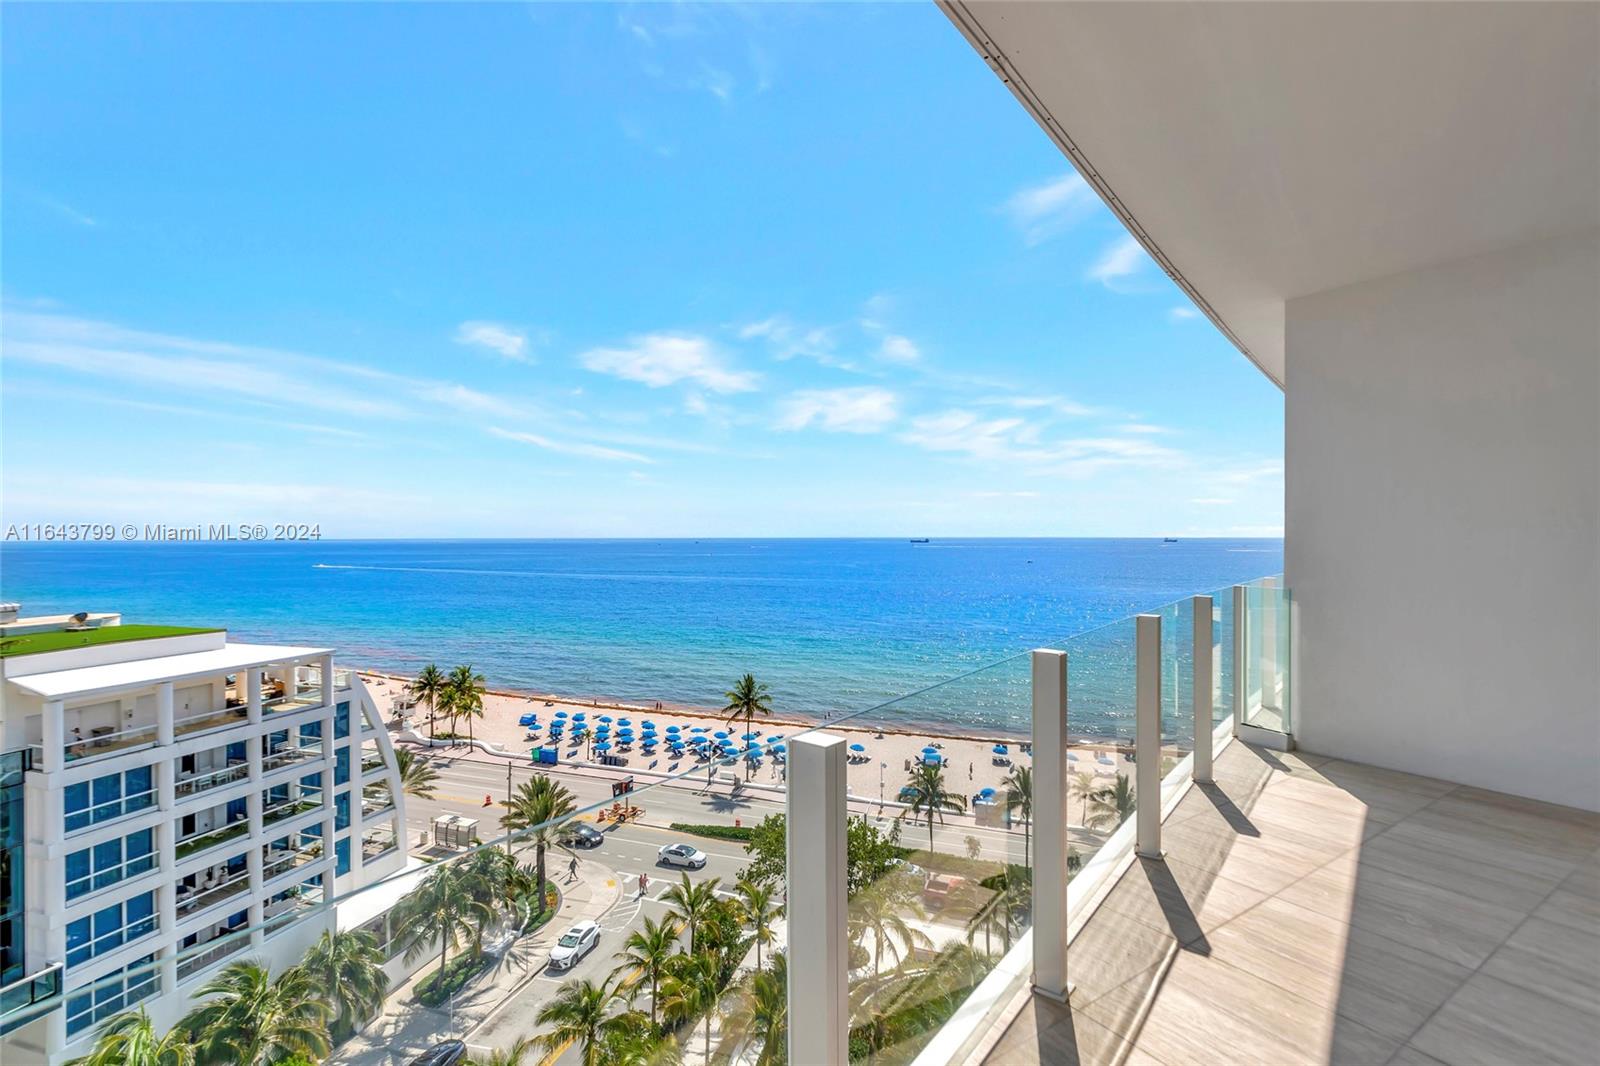
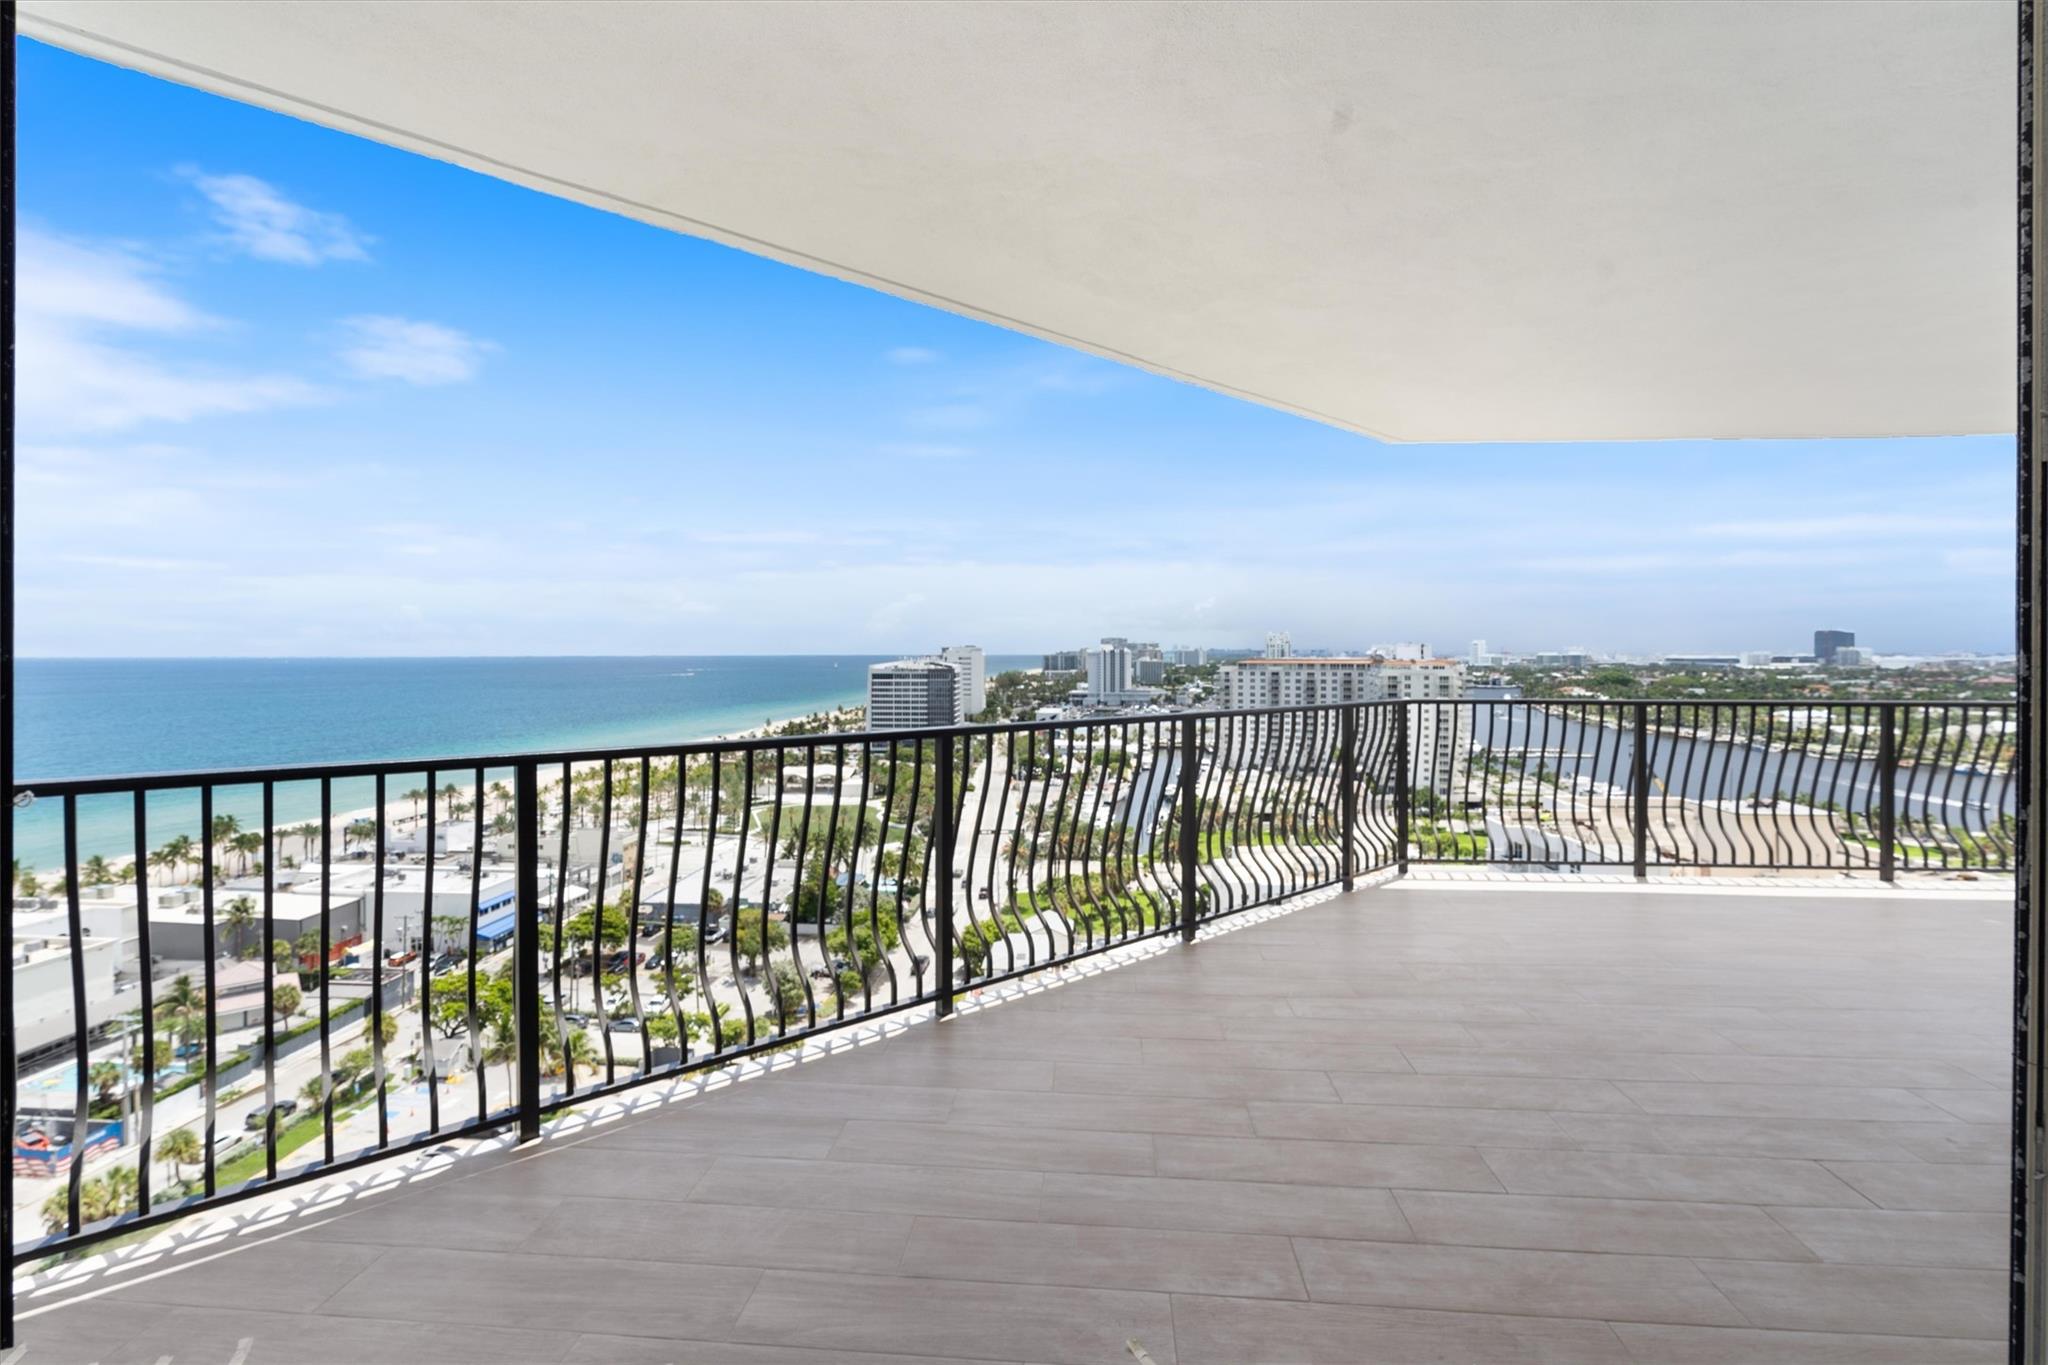
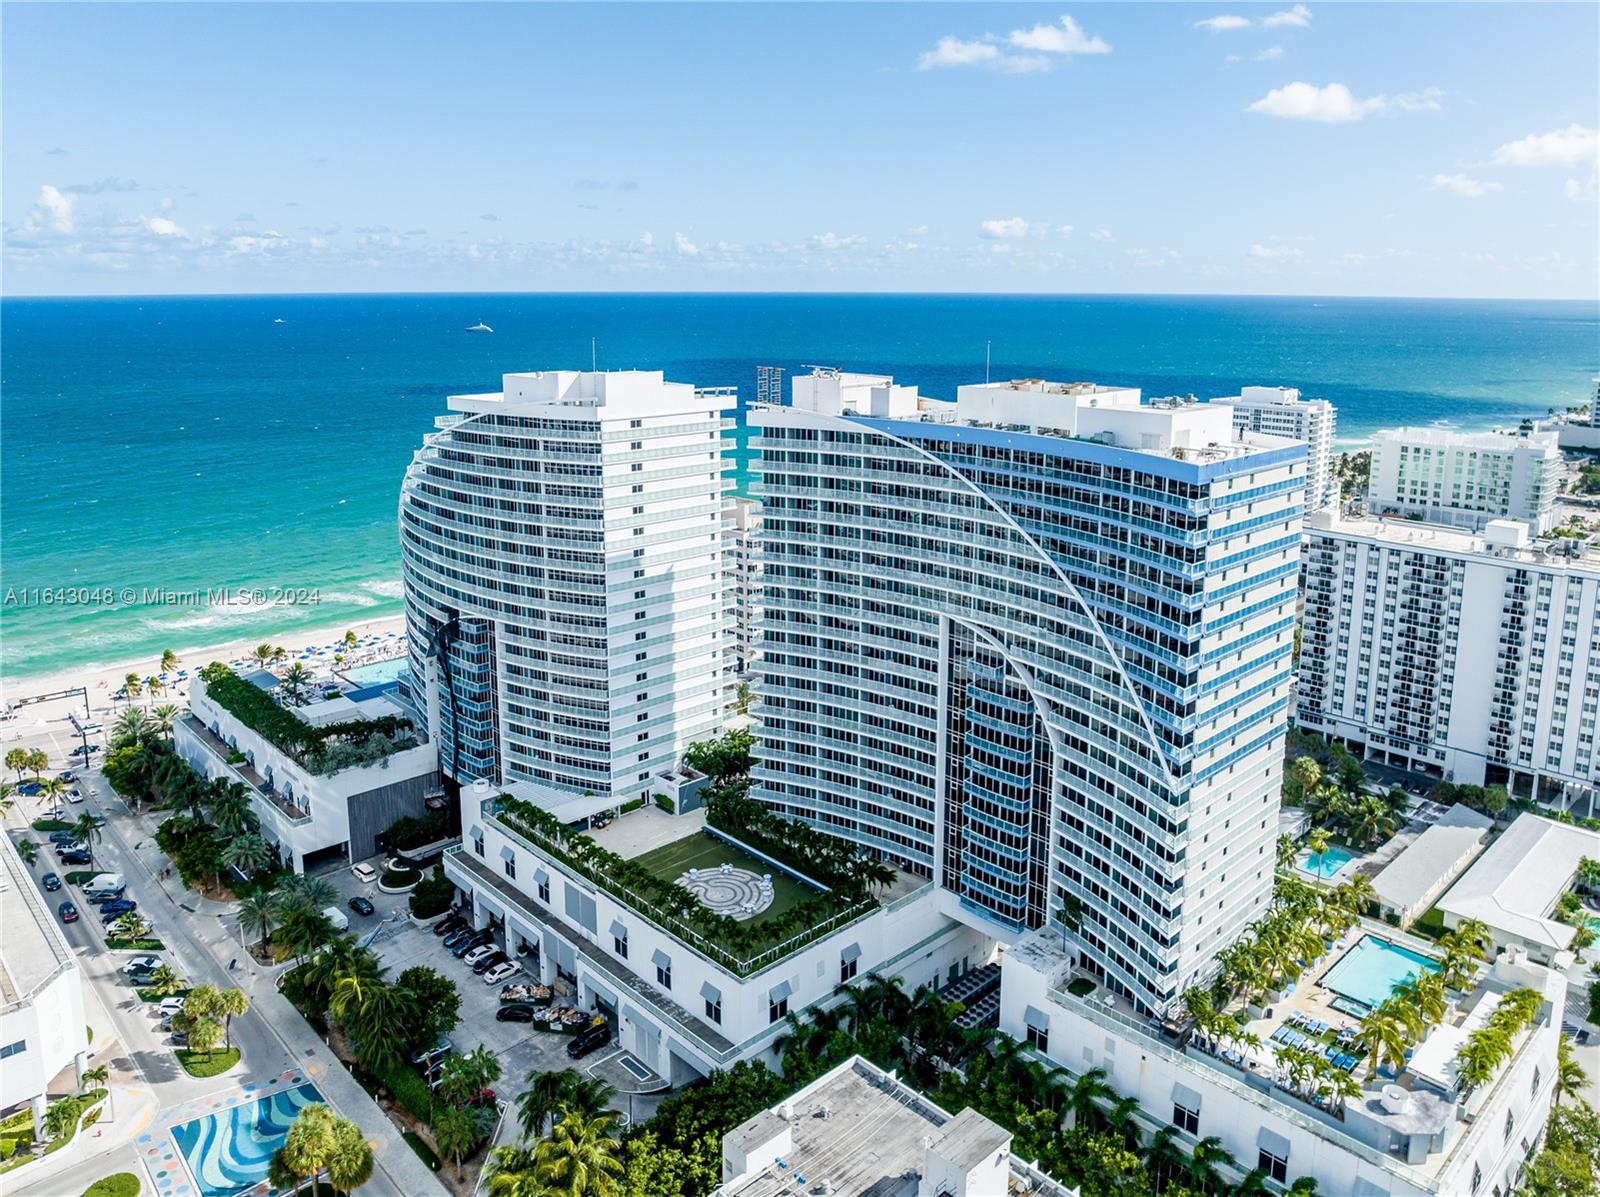
525 N Fort Lauderdale Beach Blvd, Fort Lauderdale, FL 33304
$-26,470
Cash flow
-30.7%
Cash-on-Cash Return
-0.9%
Cap rate
0.2%
Rent to Value Ratio
Active
$729,000
2
bds
|
2
ba
|
1,178
sqft
|
built
2004
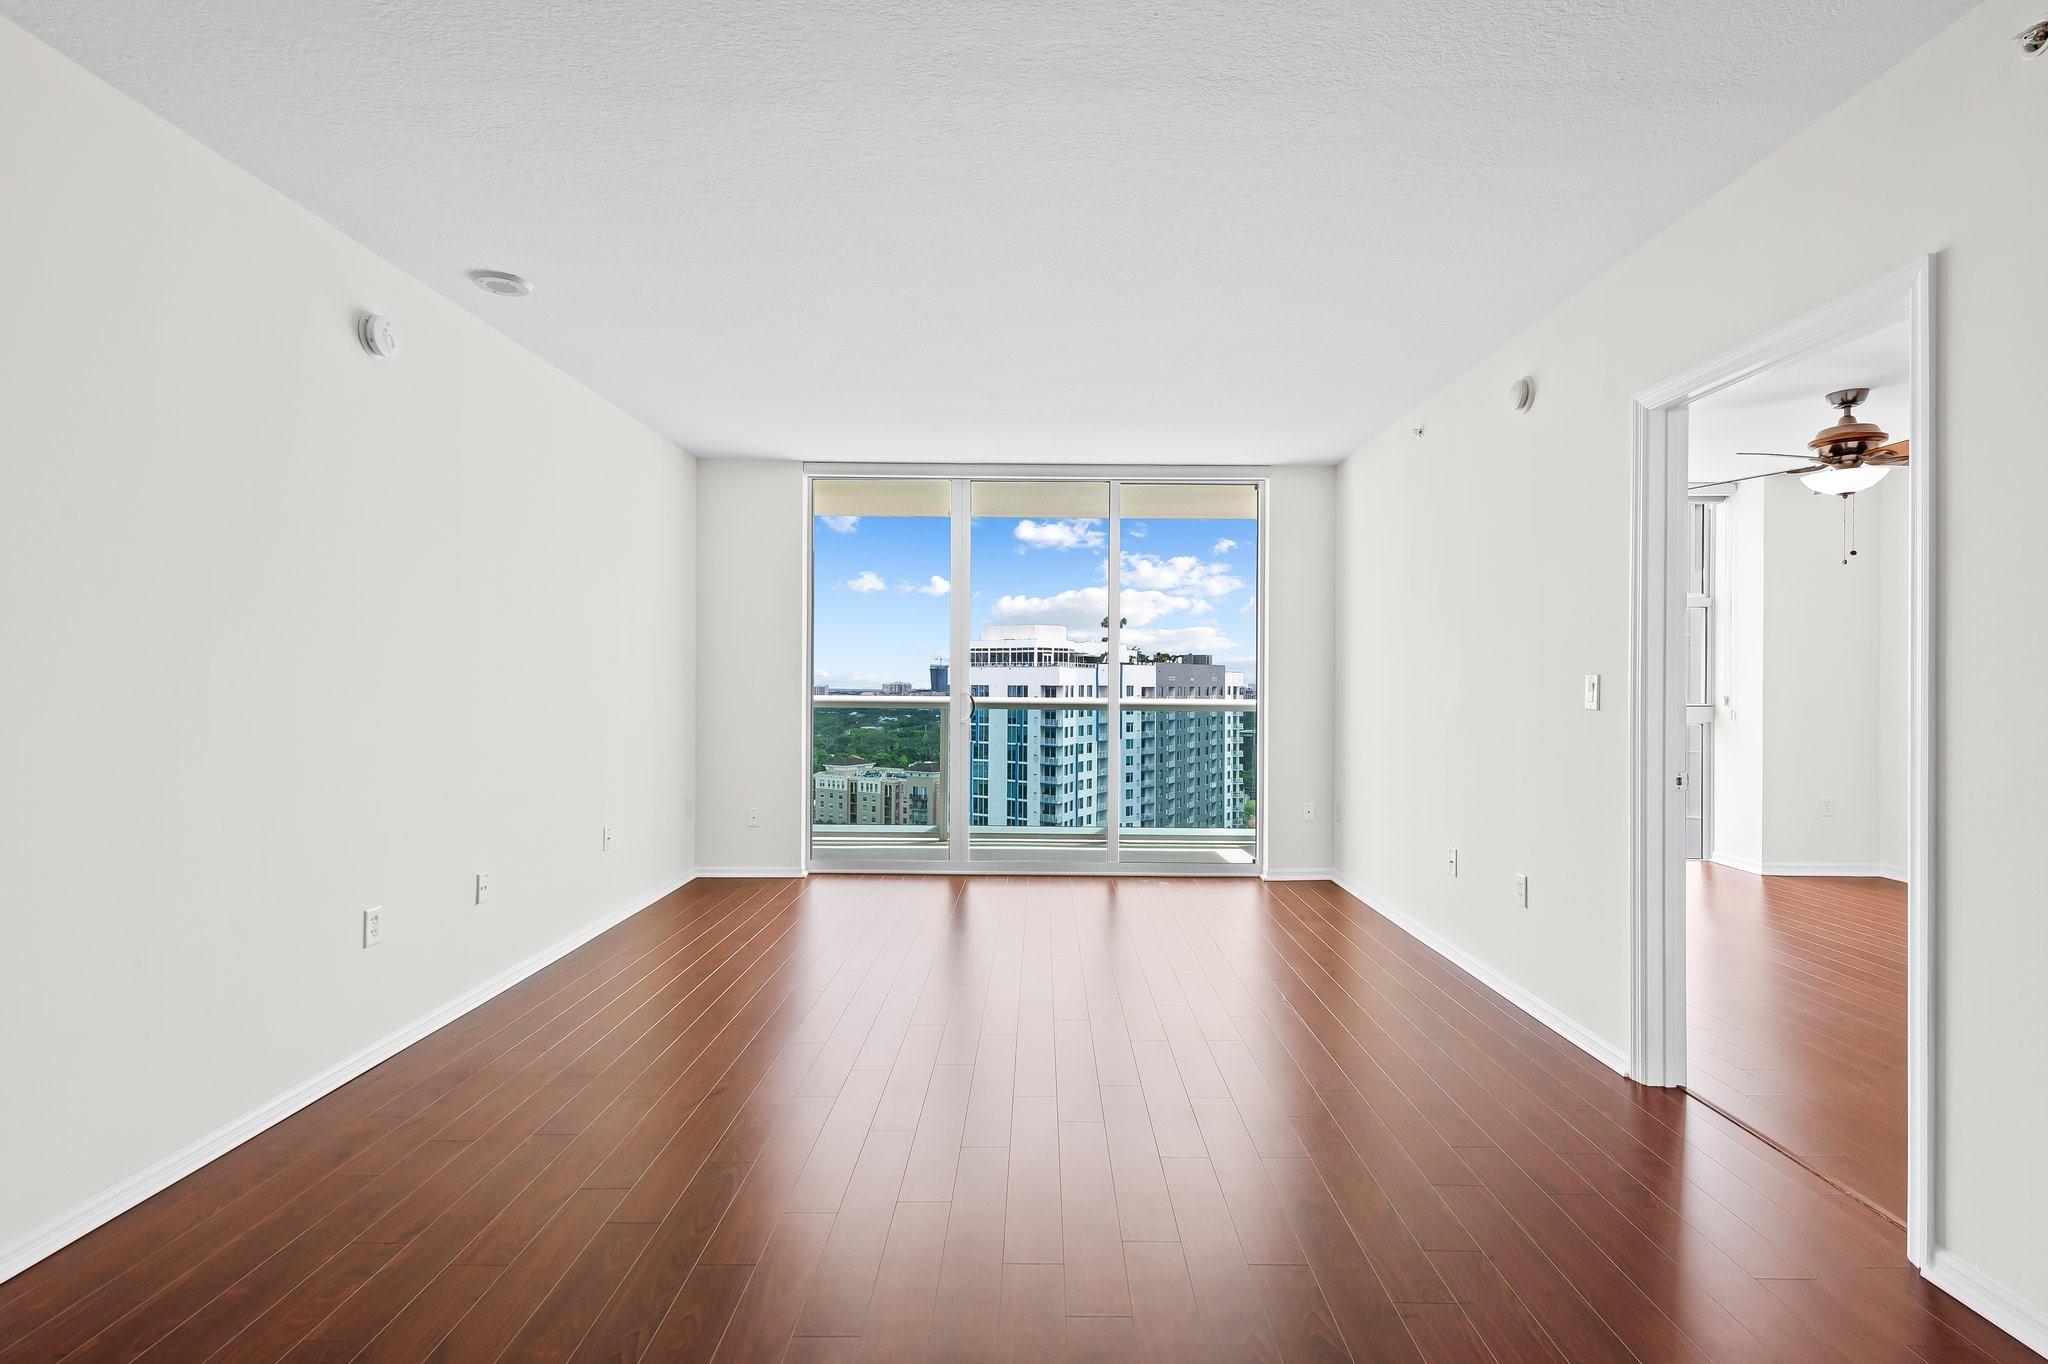
347 N New River Dr E, Fort Lauderdale, FL 33301
$-2,765
Cash flow
-19.8%
Cash-on-Cash Return
1.6%
Cap rate
0.7%
Rent to Value Ratio
Active
$49,995,000
6
bds
|
9
ba
|
9,995
sqft
|
built
2020
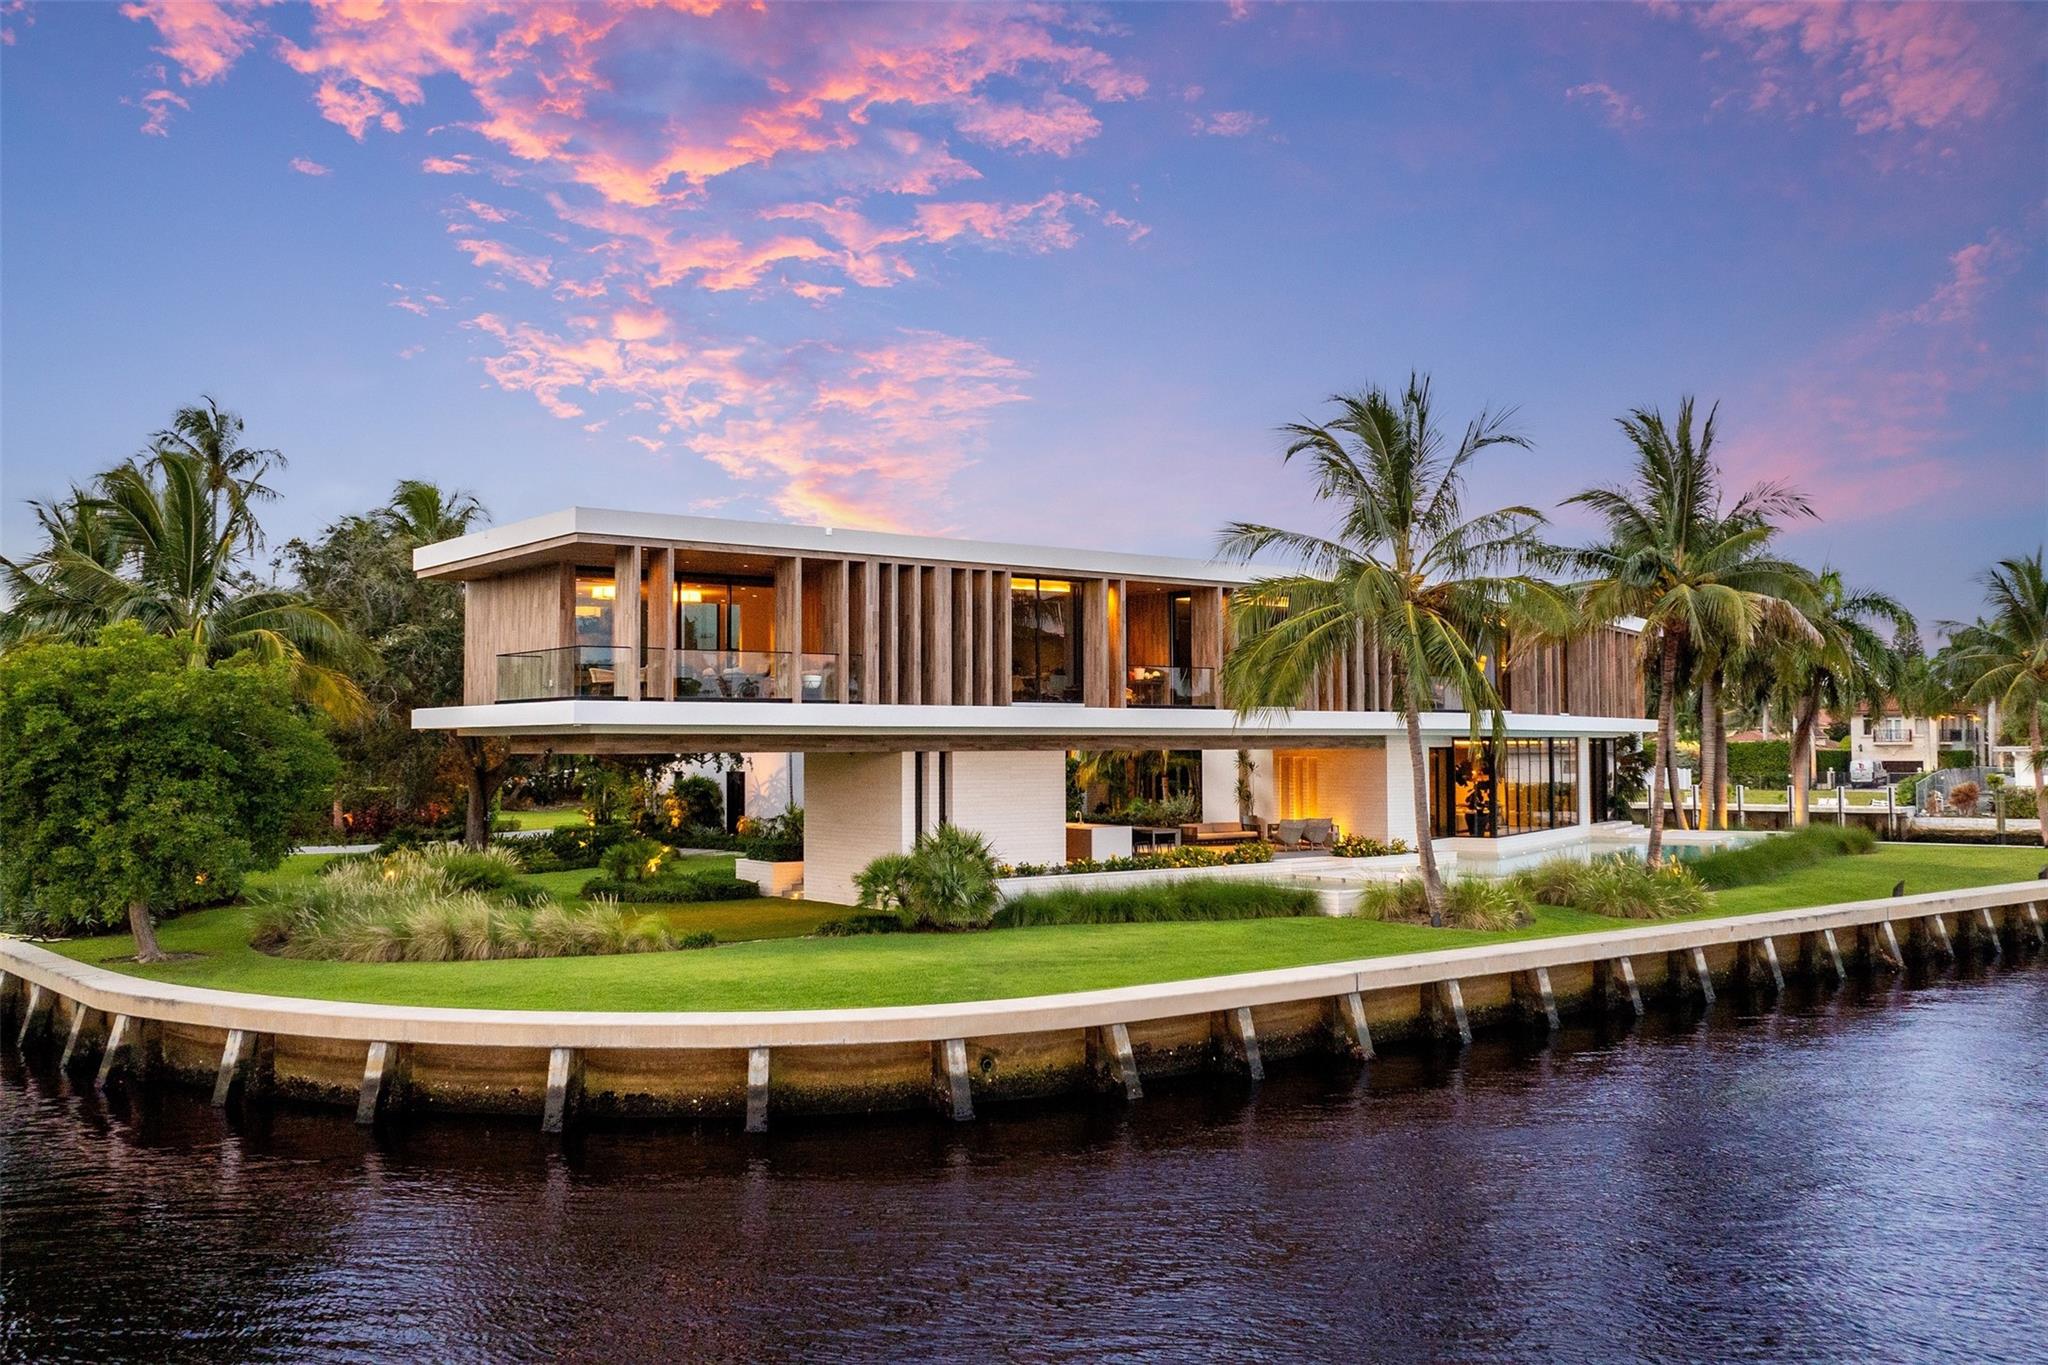
516 Mola Ave, Fort Lauderdale, FL 33301
$-265,224
Cash flow
-27.7%
Cash-on-Cash Return
-0.2%
Cap rate
0.0%
Rent to Value Ratio
Active
$3,500,000
5
bds
|
4
ba
|
3,558
sqft
|
built
1968
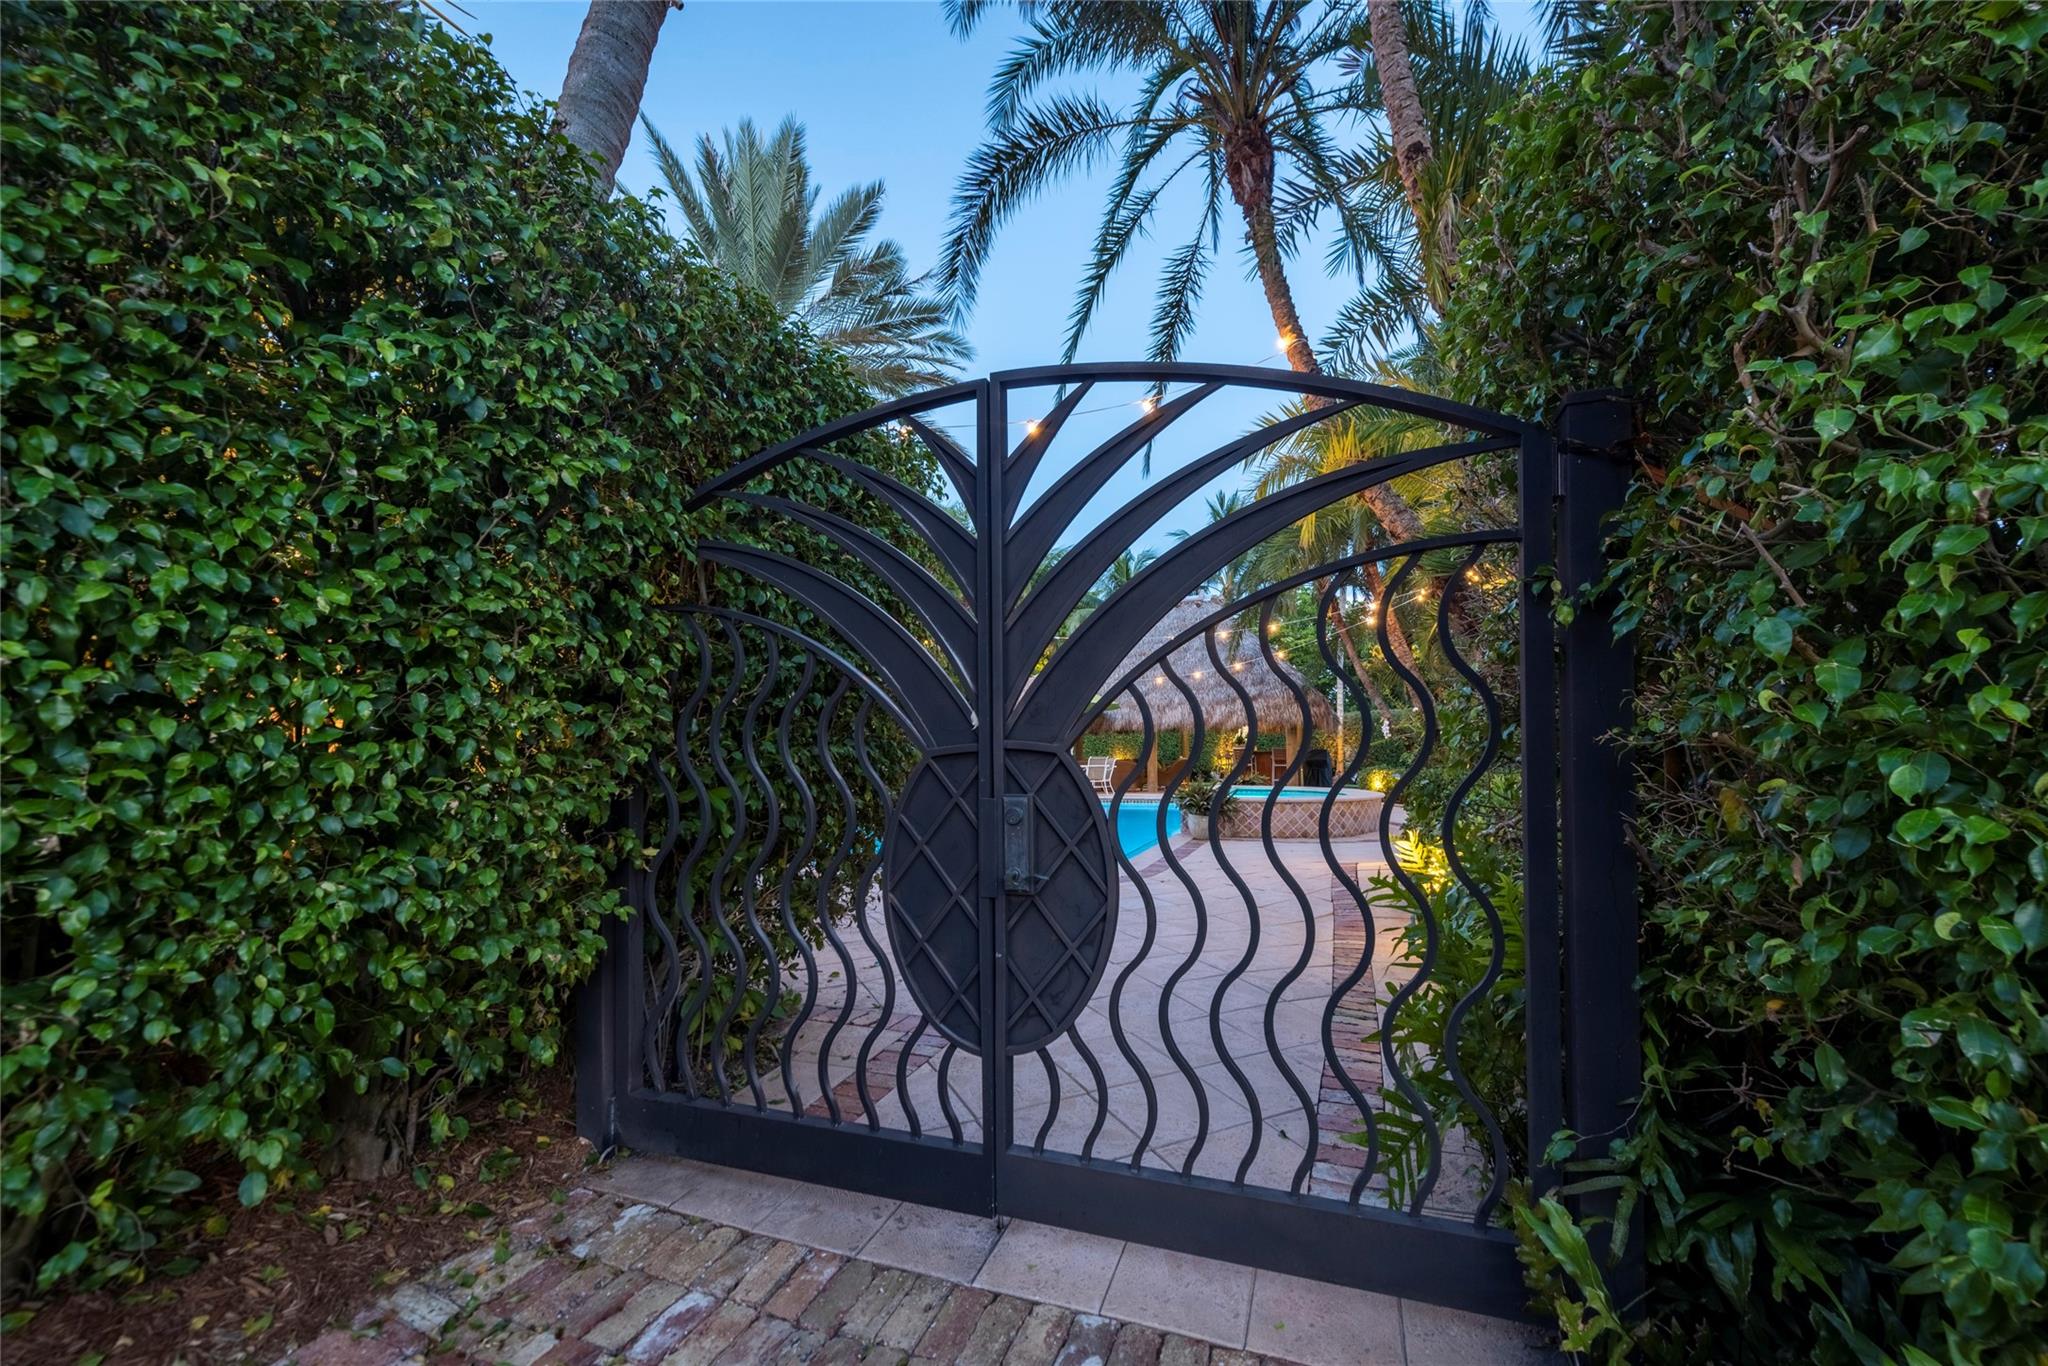
638 Middle River Dr, Fort Lauderdale, FL 33304
$-12,639
Cash flow
-18.8%
Cash-on-Cash Return
1.8%
Cap rate
0.3%
Rent to Value Ratio
Active
$429,999
3
bds
|
1
ba
|
1,011
sqft
|
built
1954
529 SW 22nd Ave, Fort Lauderdale, FL 33312
$-158
Cash flow
-1.9%
Cash-on-Cash Return
5.7%
Cap rate
0.7%
Rent to Value Ratio
Active under contract
$1,499,000
3
bds
|
3
ba
|
1,998
sqft
|
built
2001
100 S Birch Rd, Fort Lauderdale, FL 33316
$-6,867
Cash flow
-23.9%
Cash-on-Cash Return
0.7%
Cap rate
0.5%
Rent to Value Ratio
Active
$1,020,000
2
bds
|
2
ba
|
1,176
sqft
|
built
2011
3101 Bayshore Dr, Fort Lauderdale, FL 33304
$-4,117
Cash flow
-21.1%
Cash-on-Cash Return
1.3%
Cap rate
0.7%
Rent to Value Ratio
Active
$475,000
2
bds
|
2
ba
|
1,306
sqft
|
built
1975
1212 SE 2nd Ct, Fort Lauderdale, FL 33301
$-1,540
Cash flow
-16.9%
Cash-on-Cash Return
2.3%
Cap rate
0.6%
Rent to Value Ratio
Active
$3,400,000
5
bds
|
5
ba
|
4,789
sqft
|
built
2010
1115 SW 5th Pl, Fort Lauderdale, FL 33312
$-13,434
Cash flow
-20.6%
Cash-on-Cash Return
1.4%
Cap rate
0.3%
Rent to Value Ratio
Active
$777,000
3
bds
|
3
ba
|
2,450
sqft
|
built
1958
333 Sunset Dr, Fort Lauderdale, FL 33301
$-4,231
Cash flow
-28.4%
Cash-on-Cash Return
-0.4%
Cap rate
0.7%
Rent to Value Ratio
Active
$615,000
3
bds
|
2
ba
|
1,560
sqft
|
built
1956
811 SW 39th Ave, Fort Lauderdale, FL 33312
$-1,032
Cash flow
-8.8%
Cash-on-Cash Return
4.1%
Cap rate
0.6%
Rent to Value Ratio
Active
$1,465,000
4
bds
|
3
ba
|
2,351
sqft
|
built
1964
4710 NE 27th Ave, Fort Lauderdale, FL 33308
$-3,500
Cash flow
-12.5%
Cash-on-Cash Return
3.3%
Cap rate
0.6%
Rent to Value Ratio
Active
$949,000
4
bds
|
3
ba
|
2,262
sqft
|
built
1960
5740 NE 19th Ave, Fort Lauderdale, FL 33308
$-715
Cash flow
-3.9%
Cash-on-Cash Return
5.2%
Cap rate
0.8%
Rent to Value Ratio
Active
$259,000
1
bds
|
1
ba
|
704
sqft
|
built
1973
1731 SE 15th St, Fort Lauderdale, FL 33316
$-593
Cash flow
-11.9%
Cash-on-Cash Return
3.4%
Cap rate
0.8%
Rent to Value Ratio
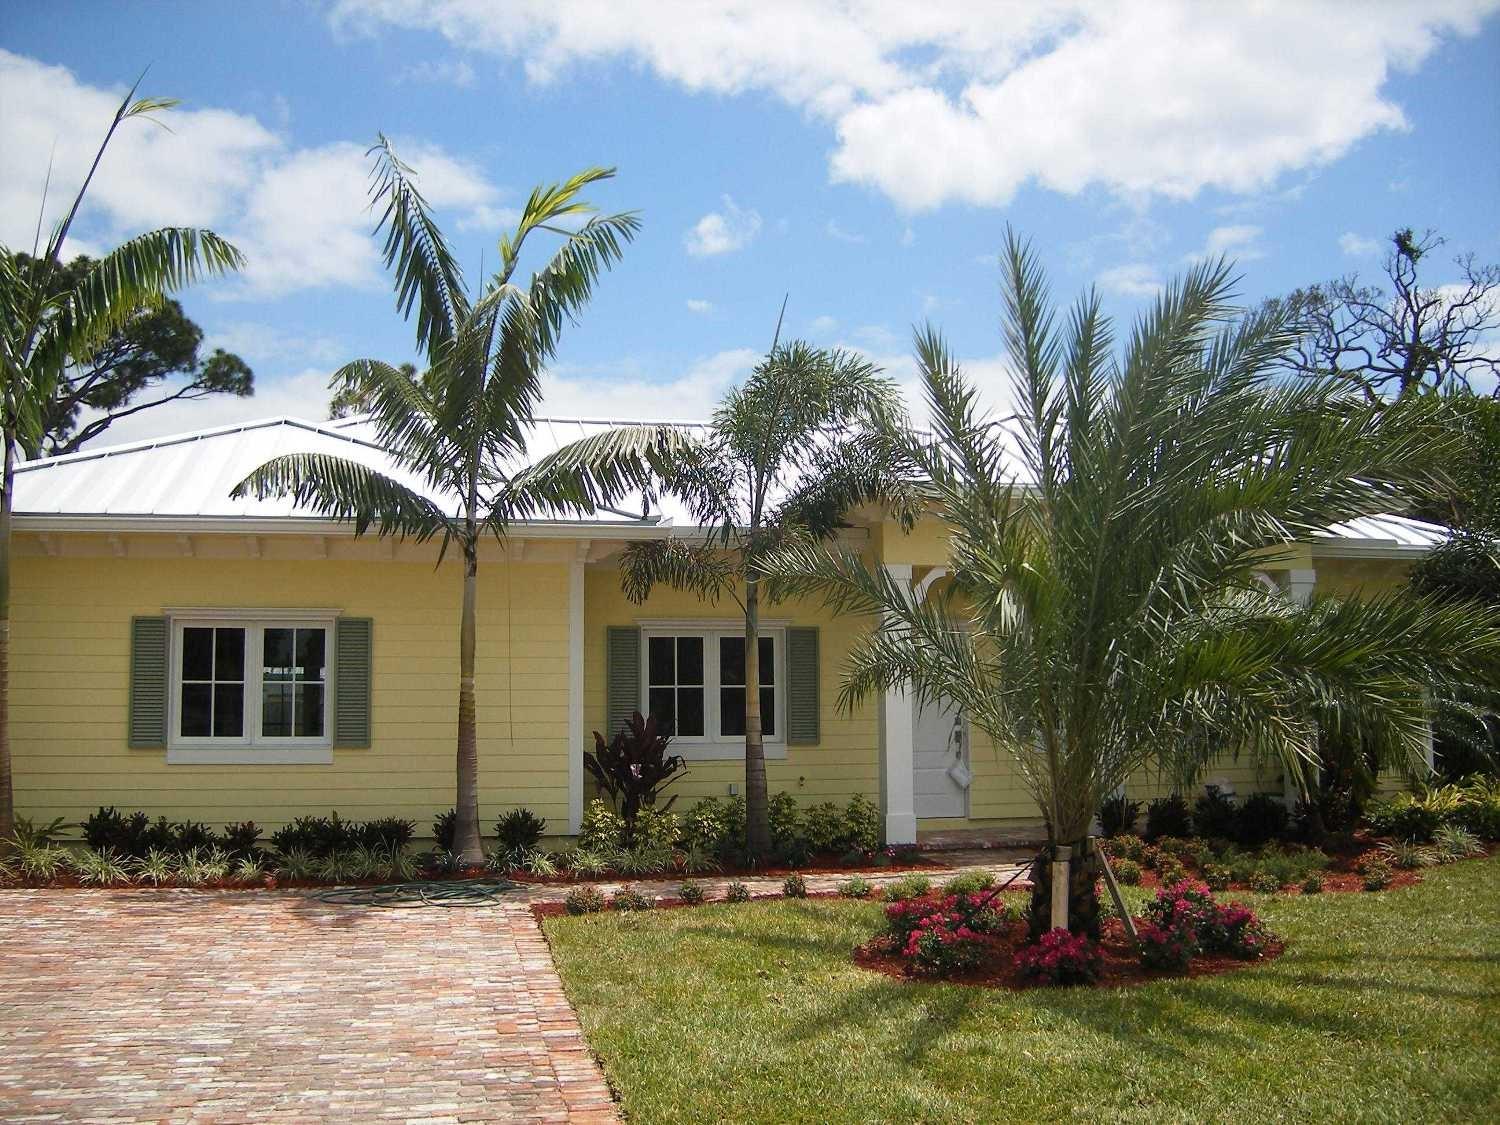
Active
$639,888
3
bds
|
3
ba
|
1,905
sqft
|
built
2001
3830 SW 48th Ct, Fort Lauderdale, FL 33312
$-1,467
Cash flow
-12.0%
Cash-on-Cash Return
3.4%
Cap rate
0.6%
Rent to Value Ratio
Active
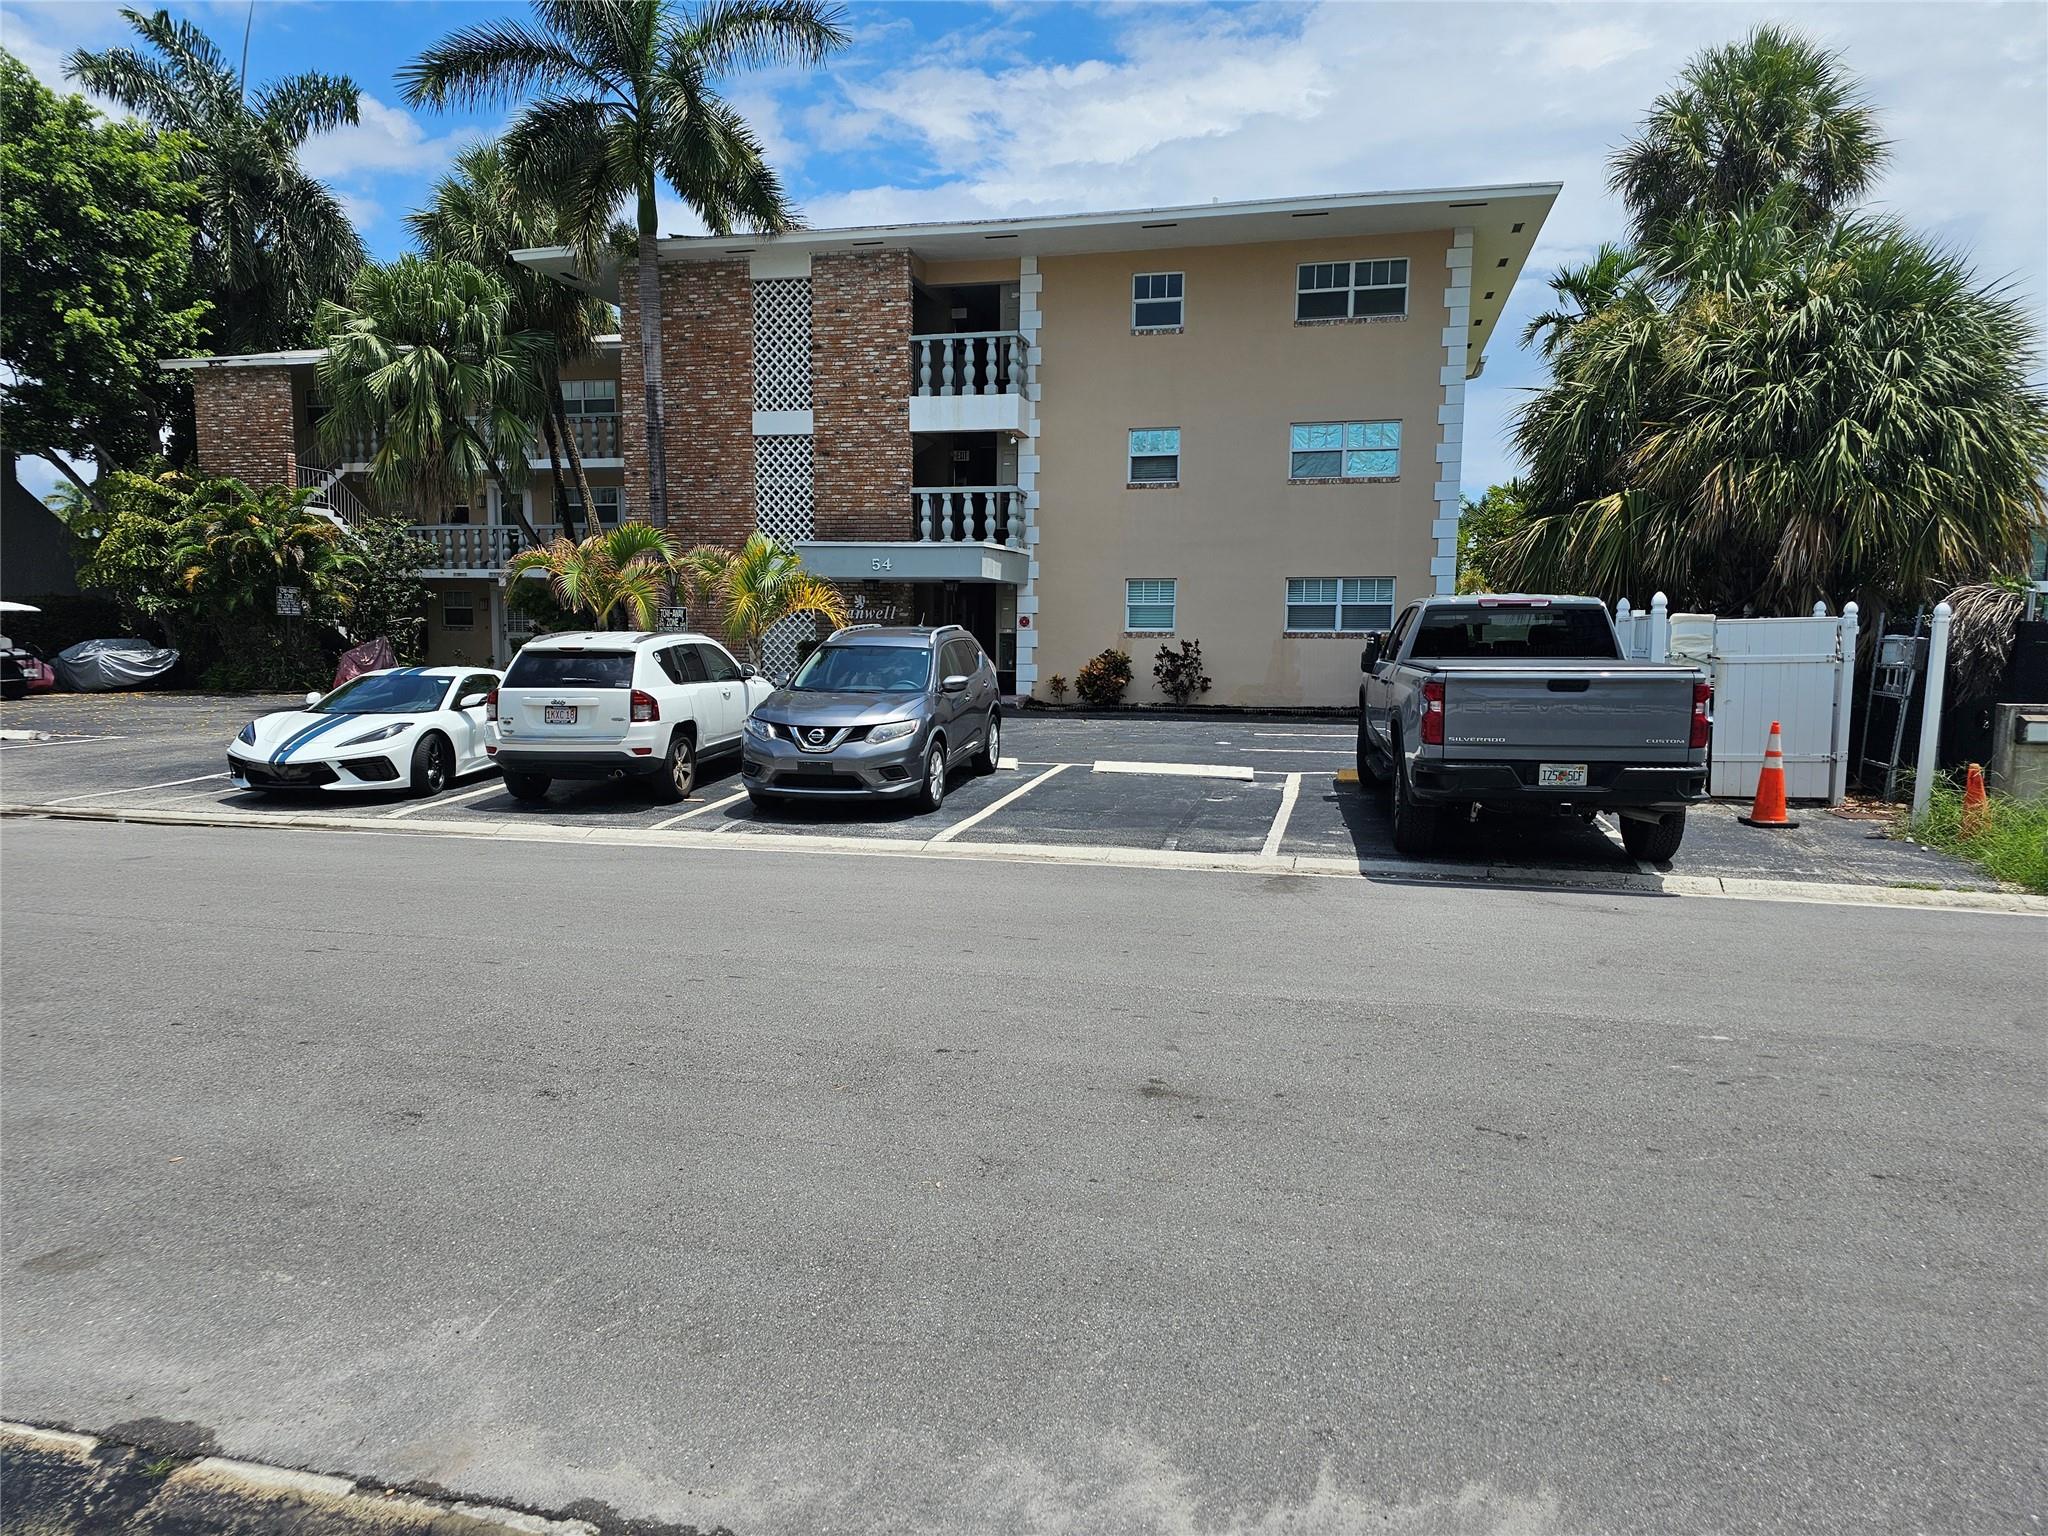
$375,000
1
bds
|
1
ba
|
550
sqft
|
built
1963
54 Isle Of Venice Dr, Fort Lauderdale, FL 33301
$-880
Cash flow
-12.2%
Cash-on-Cash Return
3.3%
Cap rate
0.5%
Rent to Value Ratio
Active
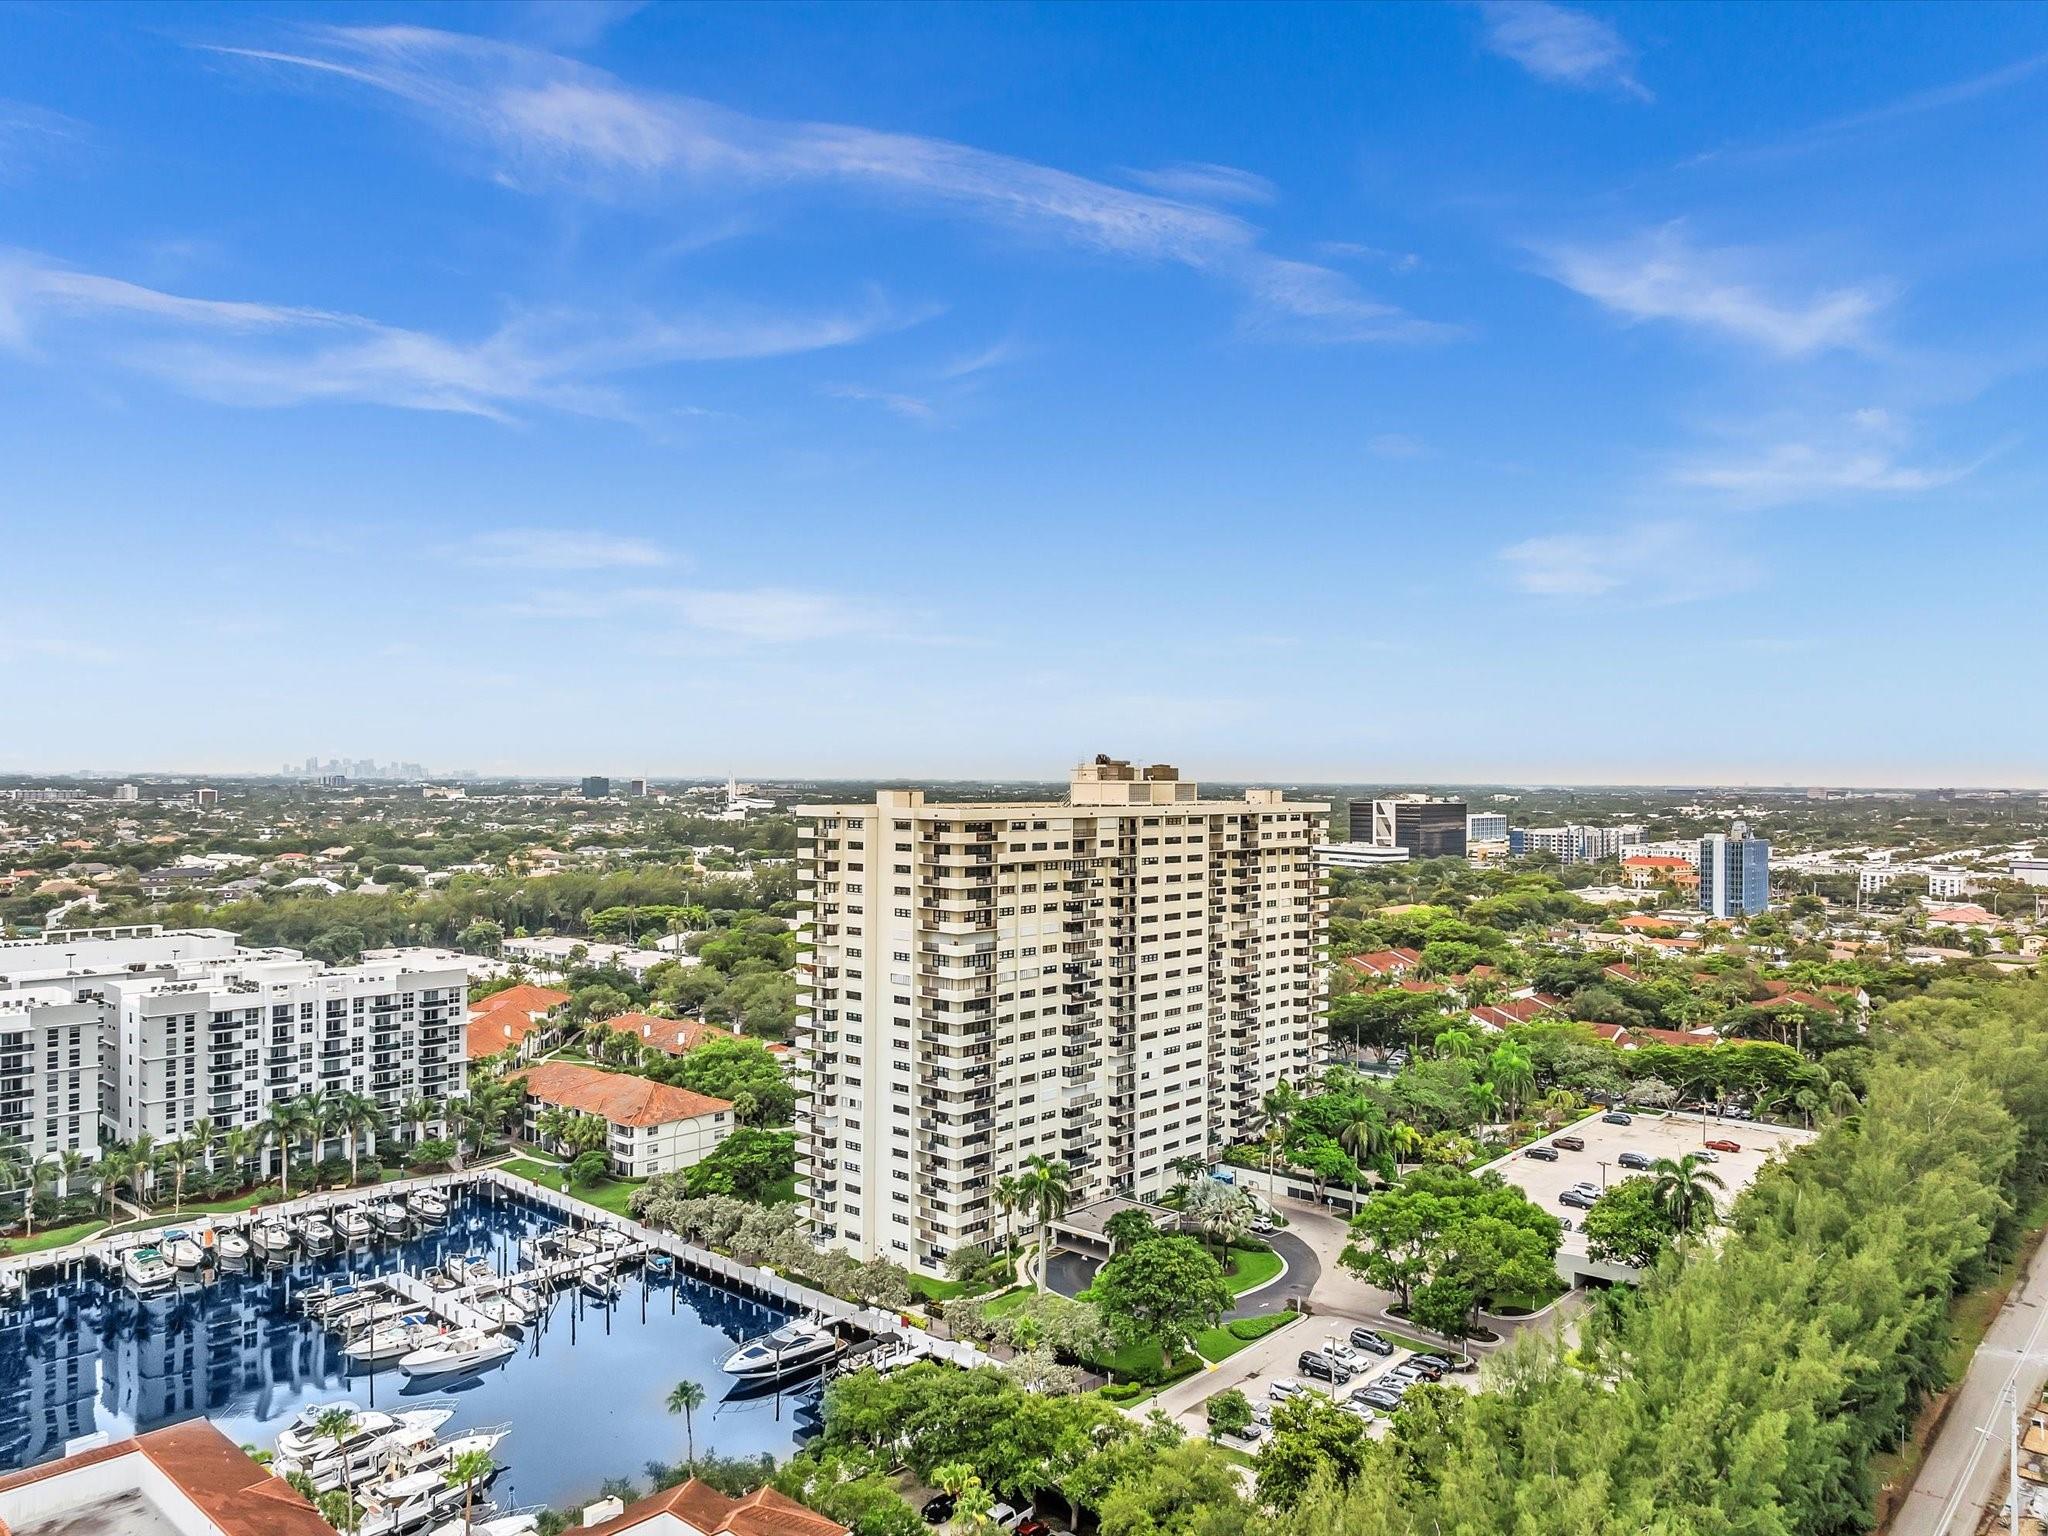
$489,500
2
bds
|
2
ba
|
1,290
sqft
|
built
1981
3200 Port Royale Dr N, Fort Lauderdale, FL 33308
$-2,343
Cash flow
-25.0%
Cash-on-Cash Return
0.4%
Cap rate
0.6%
Rent to Value Ratio
Active
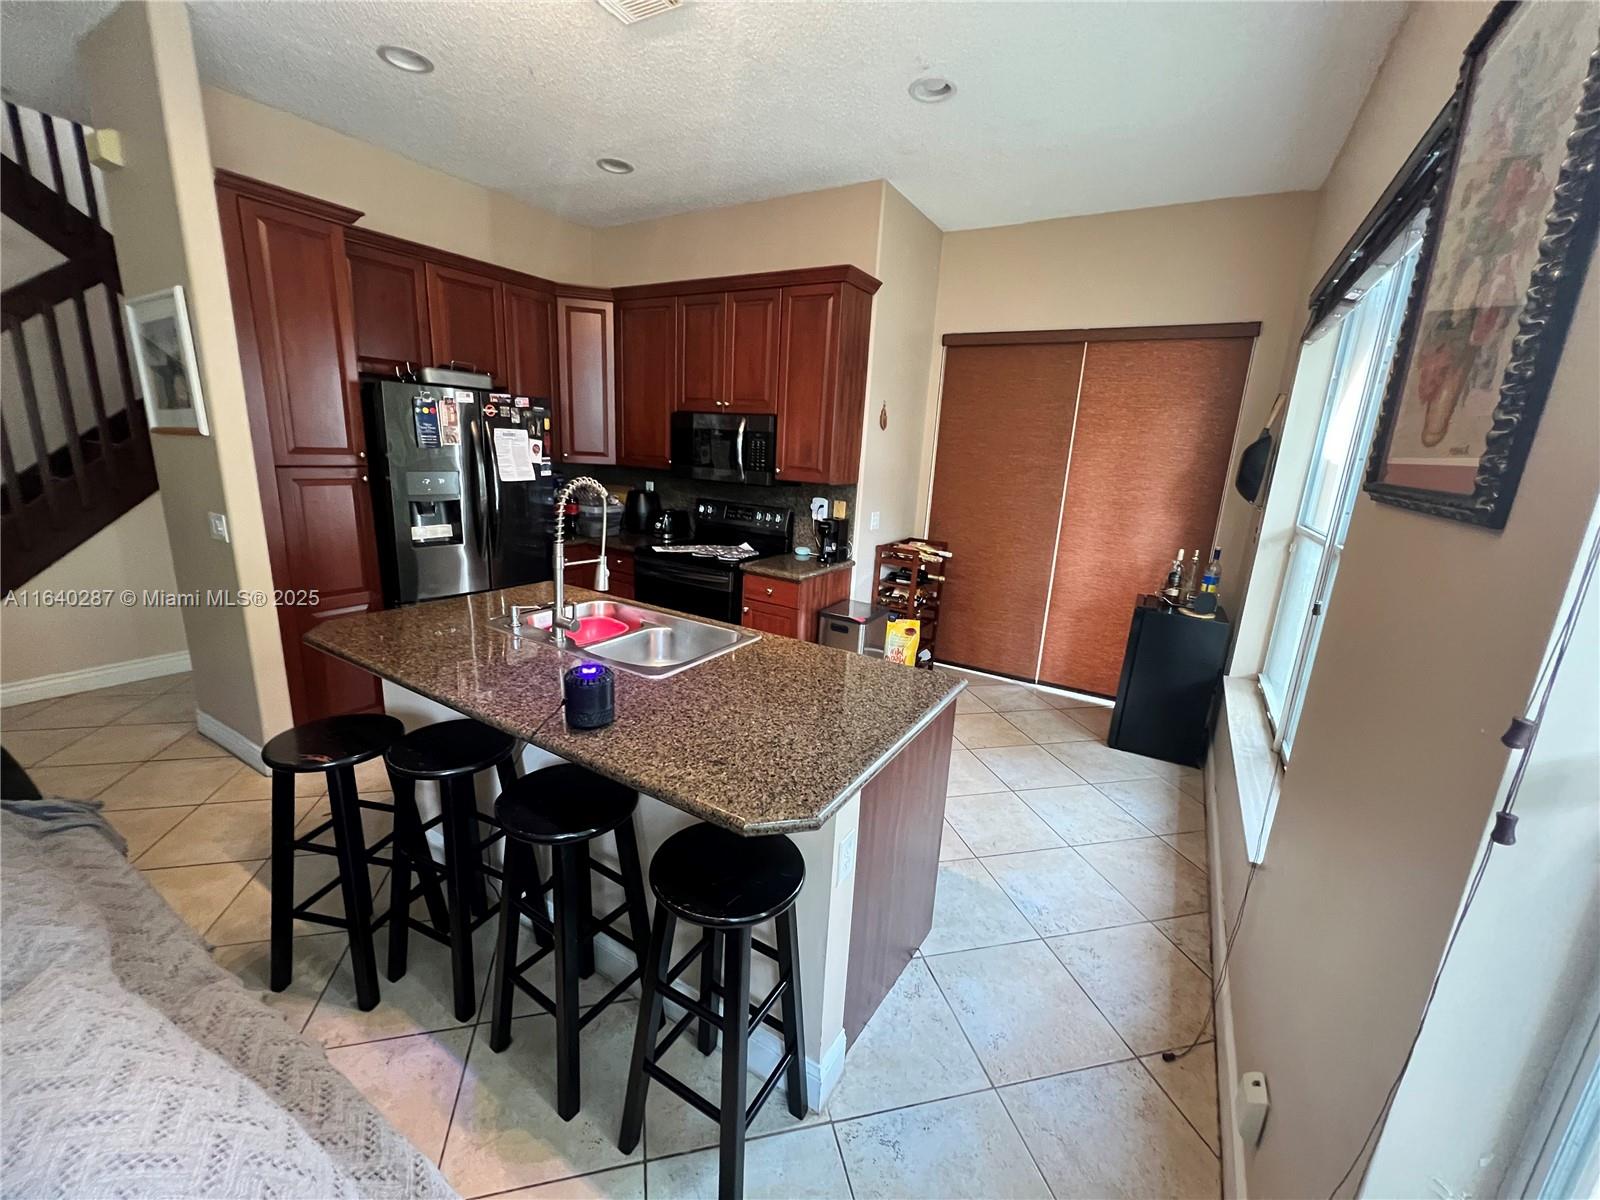
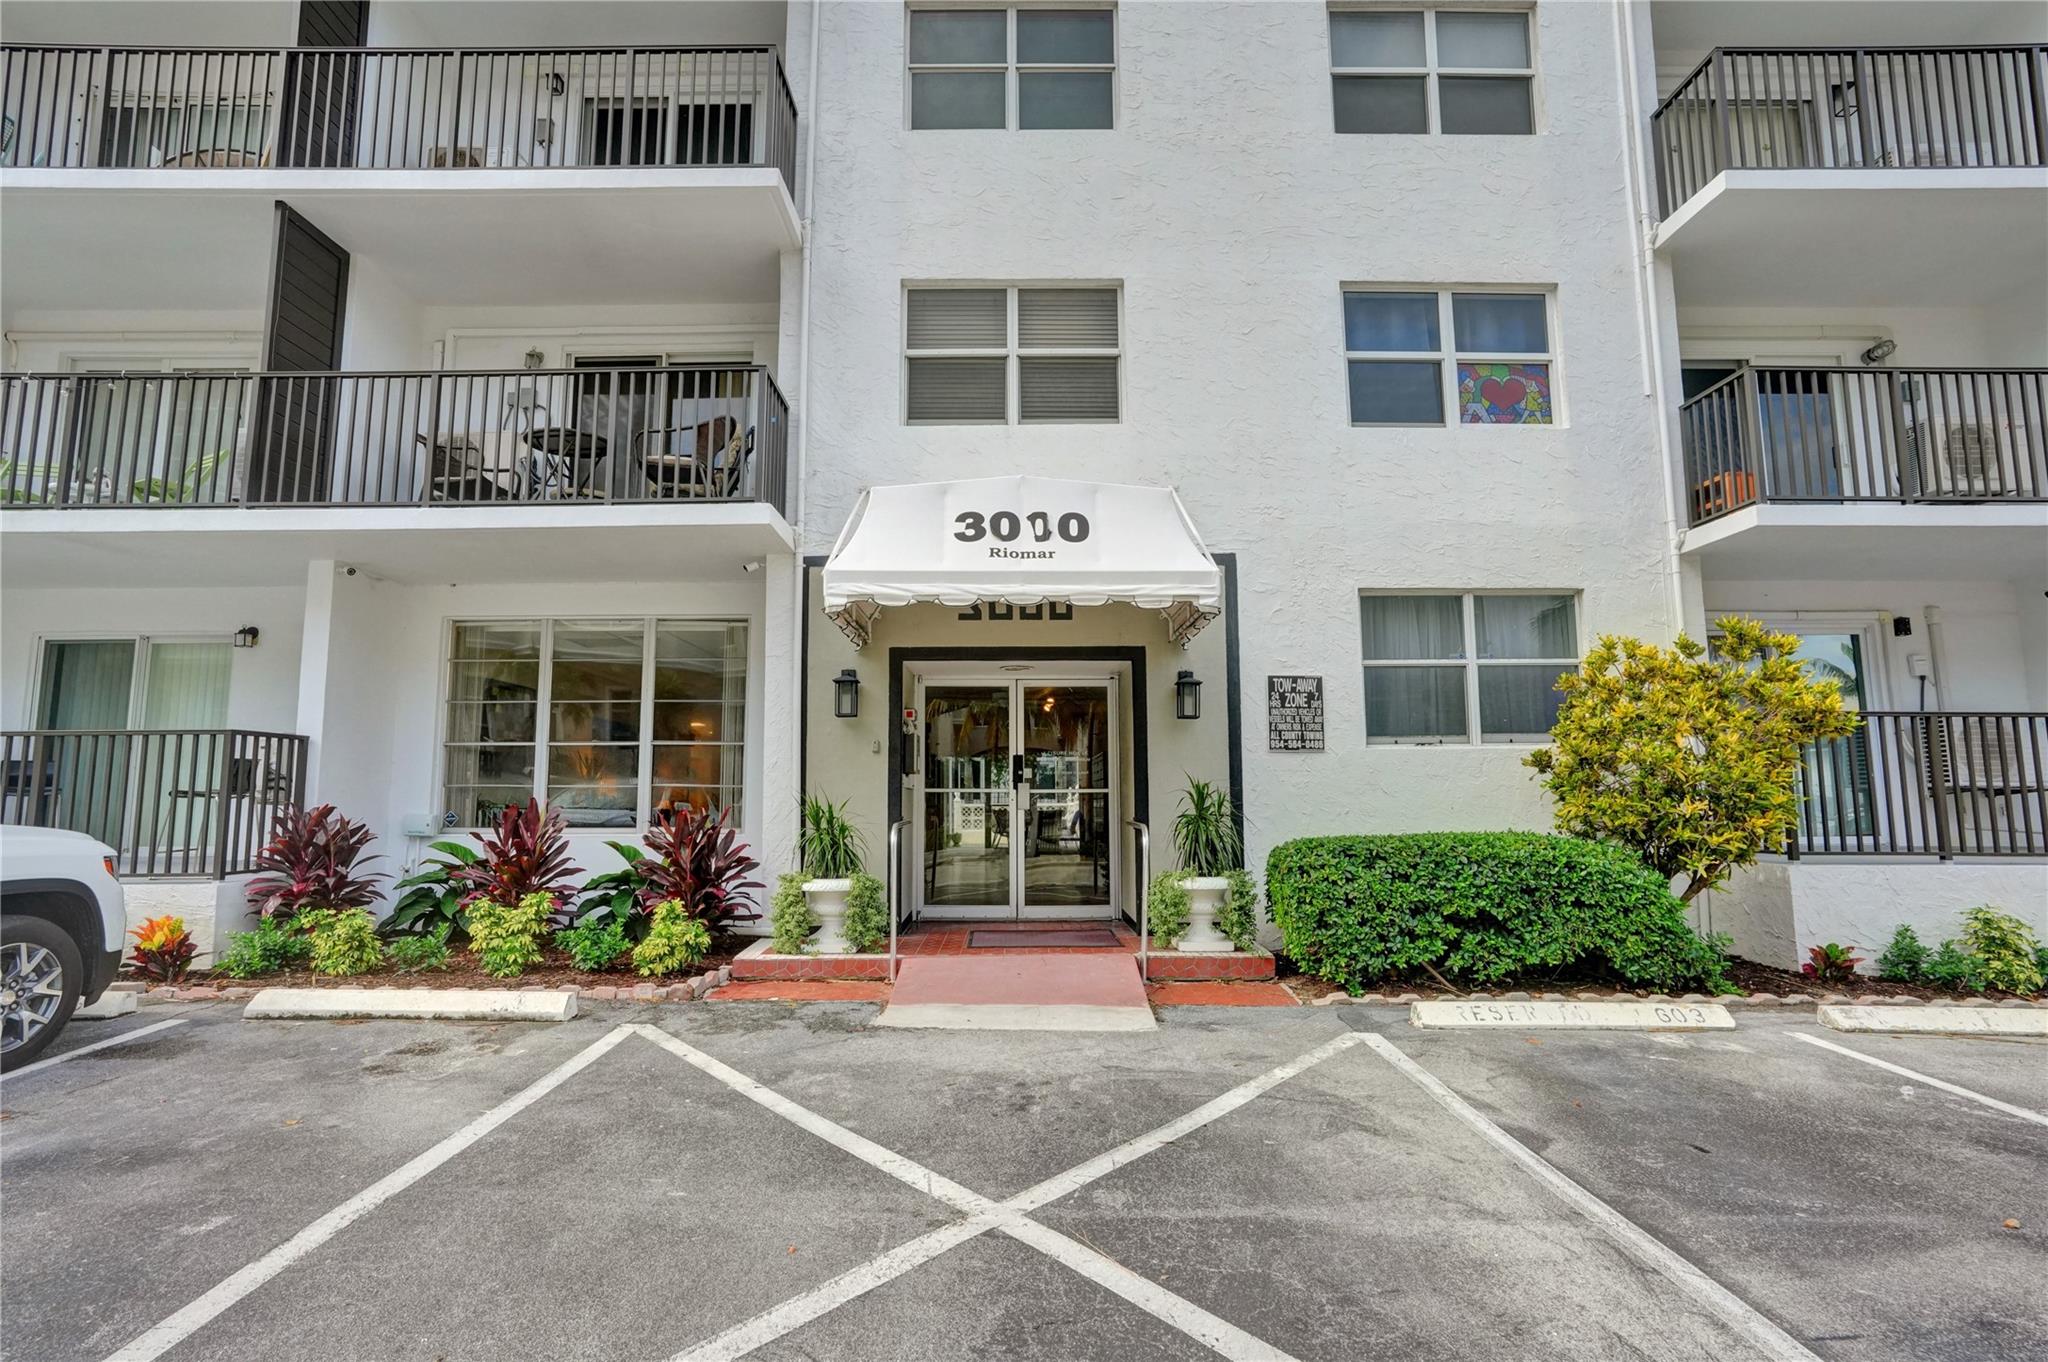
$329,000
1
bds
|
1
ba
|
640
sqft
|
built
1969
3000 Riomar St, Fort Lauderdale, FL 33304
$-862
Cash flow
-13.7%
Cash-on-Cash Return
3.0%
Cap rate
0.8%
Rent to Value Ratio
Active
$529,900
3
bds
|
2
ba
|
1,108
sqft
|
built
1949
1528 NE 1st Ave, Fort Lauderdale, FL 33304
$-1,714
Cash flow
-16.9%
Cash-on-Cash Return
2.3%
Cap rate
0.5%
Rent to Value Ratio

Active
$1,375,000
3
bds
|
3
ba
|
2,890
sqft
|
built
1994
20521 SW 54th Pl, Fort Lauderdale, FL 33332
$-2,981
Cash flow
-11.3%
Cash-on-Cash Return
3.5%
Cap rate
0.5%
Rent to Value Ratio
Active
$500,000
2
bds
|
2
ba
|
993
sqft
|
built
1972
3605 NE 32nd Ave, Fort Lauderdale, FL 33308
$-766
Cash flow
-8.0%
Cash-on-Cash Return
4.3%
Cap rate
0.6%
Rent to Value Ratio
Active
$1,195,000
3
bds
|
2
ba
|
2,055
sqft
|
built
2008
1616 NE 17th Ave, Fort Lauderdale, FL 33305
$-3,197
Cash flow
-14.0%
Cash-on-Cash Return
2.9%
Cap rate
0.5%
Rent to Value Ratio

Active
$449,900
2
bds
|
2
ba
|
1,070
sqft
|
built
1964
1510 SE 15th St, Fort Lauderdale, FL 33316
$-1,732
Cash flow
-20.1%
Cash-on-Cash Return
1.5%
Cap rate
0.6%
Rent to Value Ratio
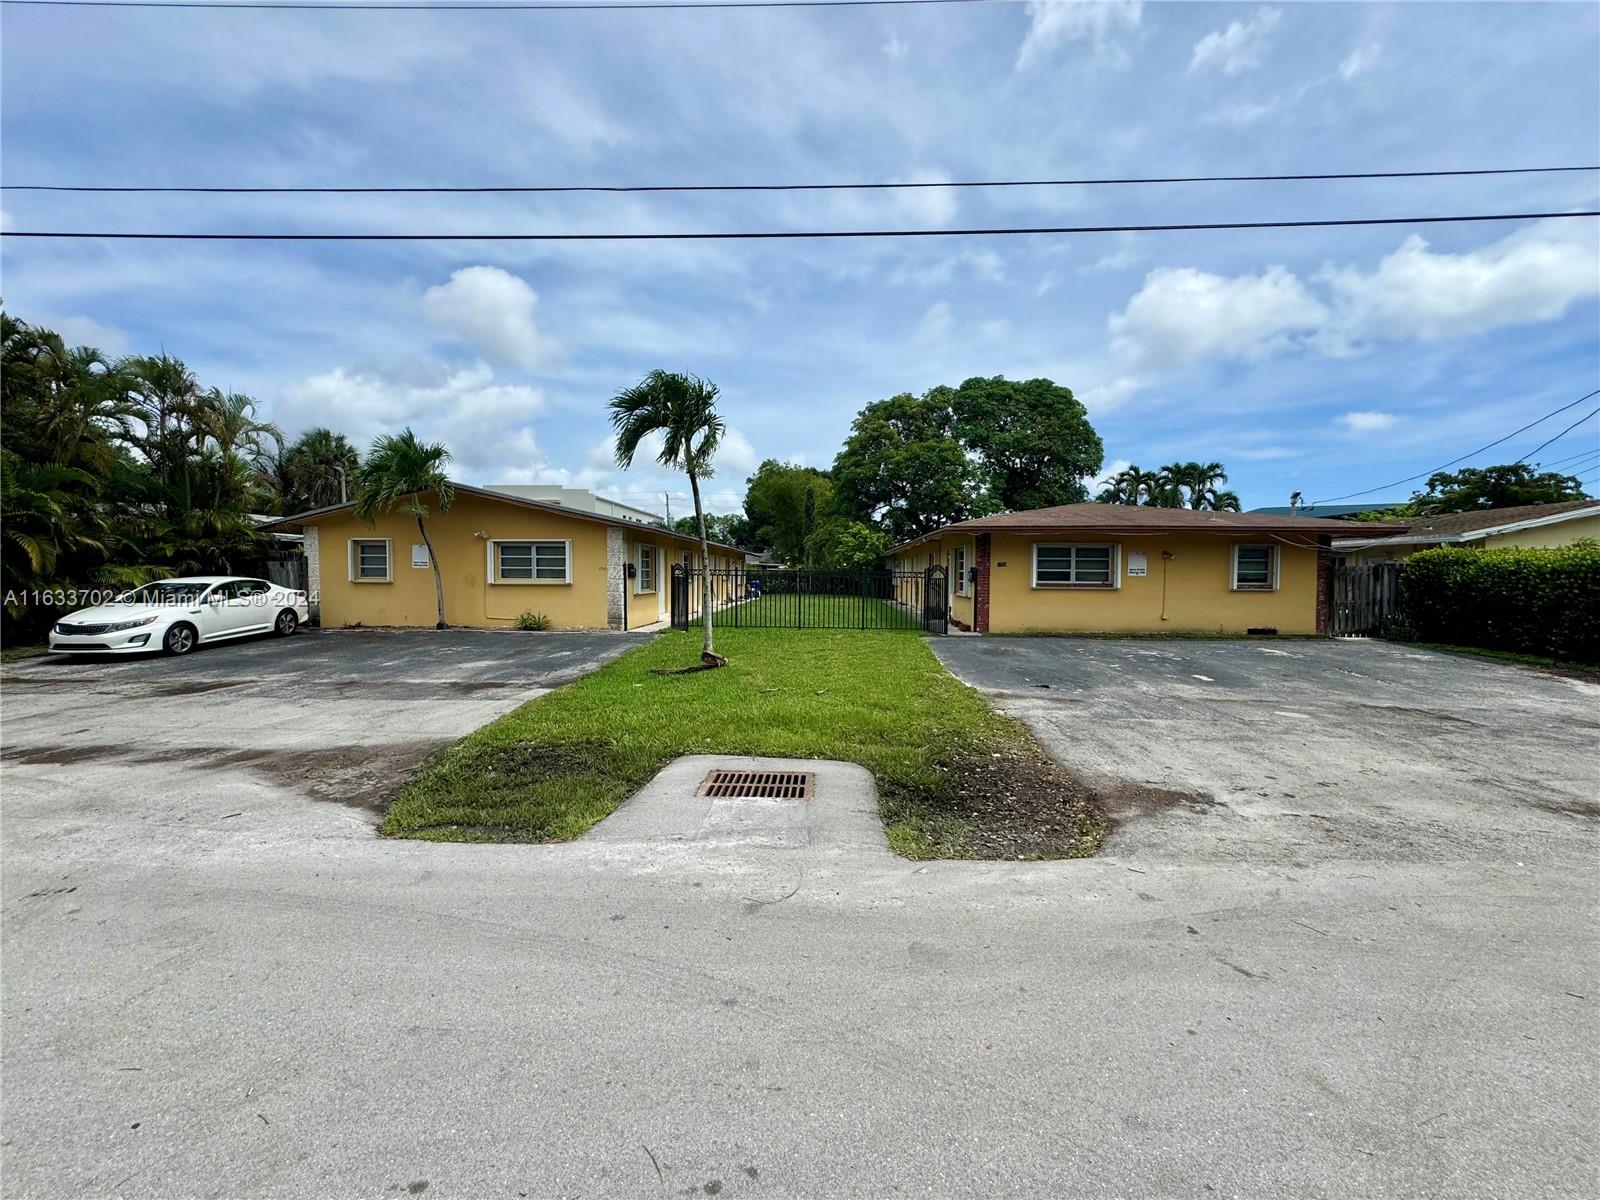
Active
$750,000
bds
|
0
ba
|
2,273
sqft
|
built
1970
1723 SW 21st St, Fort Lauderdale, FL 33315
$-3,100
Cash flow
-21.6%
Cash-on-Cash Return
1.2%
Cap rate
0.3%
Rent to Value Ratio

Active
$750,000
bds
|
0
ba
|
2,273
sqft
|
built
1970
1727 SW 21st St, Fort Lauderdale, FL 33315
$-3,238
Cash flow
-22.5%
Cash-on-Cash Return
1.0%
Cap rate
0.3%
Rent to Value Ratio
Active
$7,200,000
7
bds
|
8
ba
|
6,301
sqft
|
built
2003
7 Pelican Dr, Fort Lauderdale, FL 33301
$-38,301
Cash flow
-27.8%
Cash-on-Cash Return
-0.2%
Cap rate
0.1%
Rent to Value Ratio
Active
$1,495,000
3
bds
|
3
ba
|
2,100
sqft
|
built
2008
2631 Okeechobee Ln, Fort Lauderdale, FL 33312
$-2,672
Cash flow
-9.3%
Cash-on-Cash Return
4.0%
Cap rate
0.6%
Rent to Value Ratio
Active
$2,250,000
3
bds
|
4
ba
|
2,344
sqft
|
built
1978
359 SE 26th Ave, Fort Lauderdale, FL 33301
$-5,797
Cash flow
-13.4%
Cash-on-Cash Return
3.1%
Cap rate
0.4%
Rent to Value Ratio
Active
$935,000
bds
|
0
ba
|
2,076
sqft
|
built
1987
1114 SW 2nd Ct, Fort Lauderdale, FL 33301
$-4,374
Cash flow
-24.4%
Cash-on-Cash Return
0.5%
Cap rate
0.2%
Rent to Value Ratio
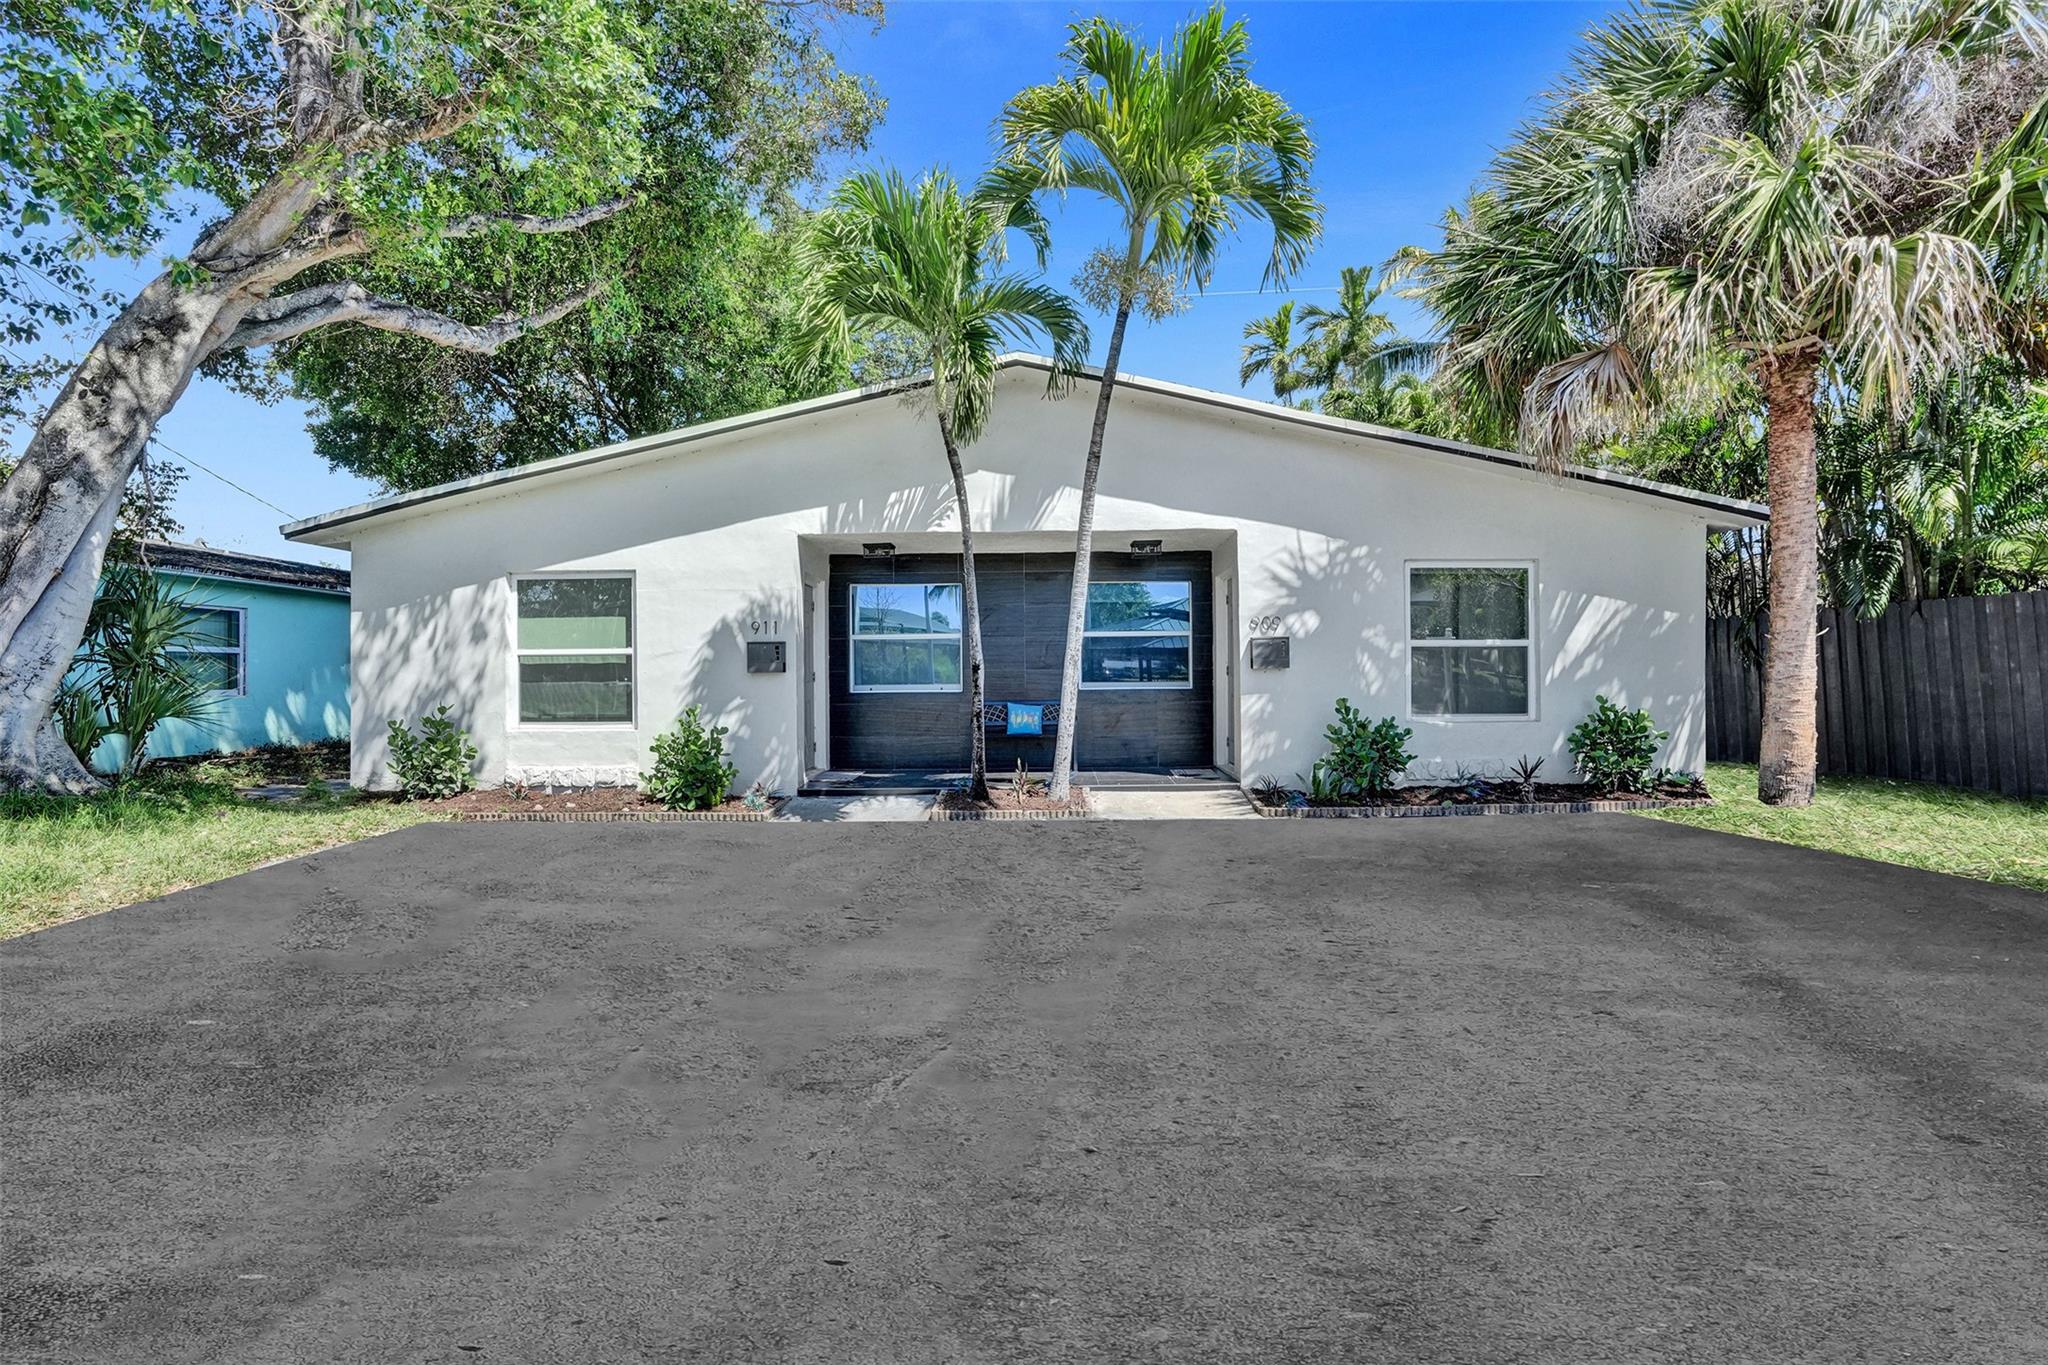
Active
$900,000
bds
|
0
ba
|
2,562
sqft
|
built
1970
909 SW 16th St, Fort Lauderdale, FL 33315
$-2,537
Cash flow
-14.7%
Cash-on-Cash Return
2.8%
Cap rate
0.4%
Rent to Value Ratio
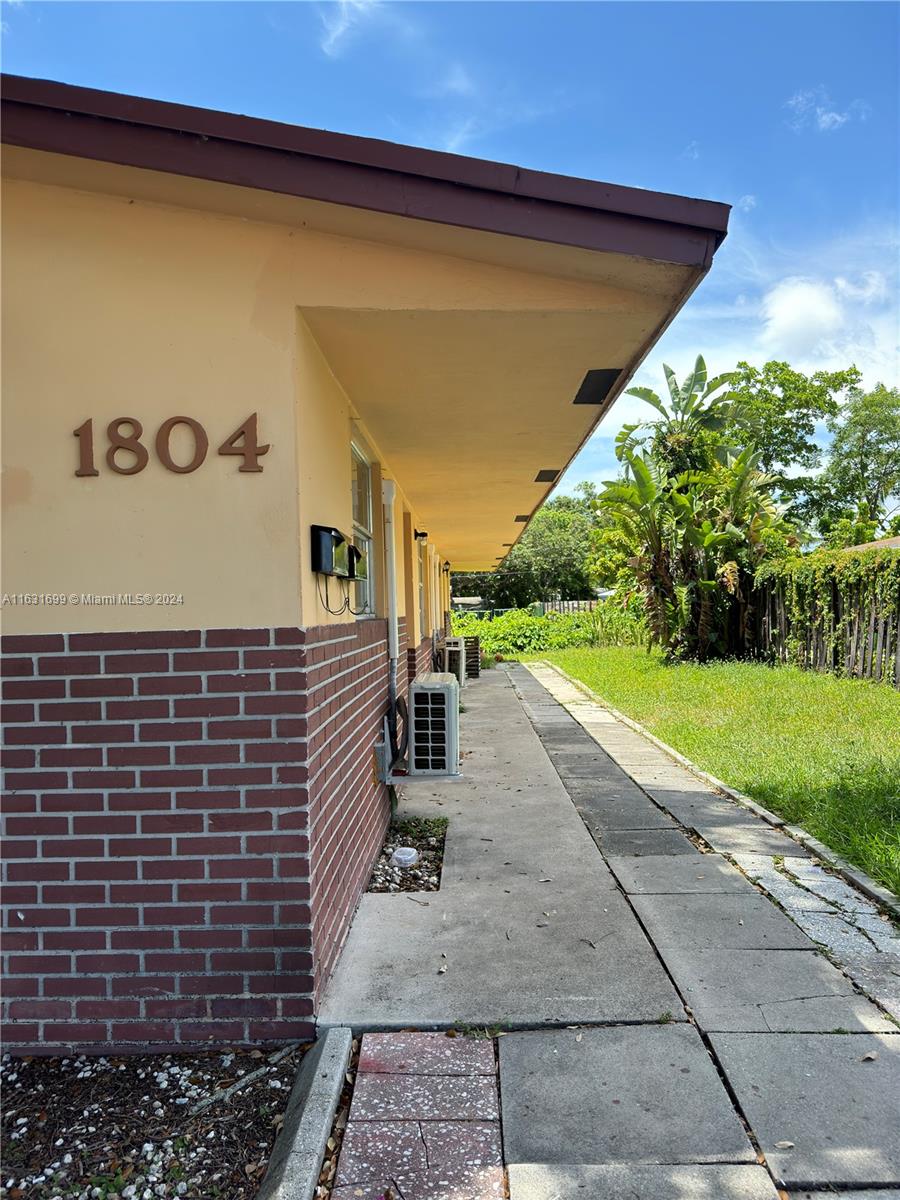
Active
$699,000
bds
|
0
ba
|
1,595
sqft
|
built
1969
1804 SW 20th St, Fort Lauderdale, FL 33315
$-3,035
Cash flow
-22.7%
Cash-on-Cash Return
0.9%
Cap rate
0.3%
Rent to Value Ratio
Active
$299,000
2
bds
|
2
ba
|
1,200
sqft
|
built
1965
2141 NE 68th St, Fort Lauderdale, FL 33308
$-594
Cash flow
-10.4%
Cash-on-Cash Return
3.8%
Cap rate
0.8%
Rent to Value Ratio

Active
$475,000
2
bds
|
2
ba
|
1,245
sqft
|
built
2005
100 N Federal Hwy, Fort Lauderdale, FL 33301
$-2,255
Cash flow
-24.8%
Cash-on-Cash Return
0.4%
Cap rate
0.6%
Rent to Value Ratio
Active
$585,000
2
bds
|
2
ba
|
1,611
sqft
|
built
1978
1160 N Federal Hwy, Fort Lauderdale, FL 33304
$-2,158
Cash flow
-19.2%
Cash-on-Cash Return
1.7%
Cap rate
0.6%
Rent to Value Ratio
Active
$315,000
2
bds
|
2
ba
|
840
sqft
|
built
1974
1777 SE 15th St, Fort Lauderdale, FL 33316
$-740
Cash flow
-12.3%
Cash-on-Cash Return
3.3%
Cap rate
0.9%
Rent to Value Ratio
Active
$349,900
2
bds
|
2
ba
|
1,250
sqft
|
built
1982
1101 River Reach Dr, Fort Lauderdale, FL 33315
$-1,499
Cash flow
-22.4%
Cash-on-Cash Return
1.0%
Cap rate
0.8%
Rent to Value Ratio
Active
$785,000
bds
|
0
ba
|
2,313
sqft
|
built
1967
830 SW 14th St, Fort Lauderdale, FL 33315
$-2,682
Cash flow
-17.8%
Cash-on-Cash Return
2.0%
Cap rate
0.3%
Rent to Value Ratio
Active
$4,650,000
5
bds
|
6
ba
|
6,195
sqft
|
built
2009
3061 NE 43rd St, Fort Lauderdale, FL 33308
$-21,656
Cash flow
-24.3%
Cash-on-Cash Return
0.6%
Cap rate
0.2%
Rent to Value Ratio