Fort Lauderdale, FL Investment Properties for Sale
Browse homes for sale and investment properties in Fort Lauderdale, FL. Refine your search by price, property type, or more.
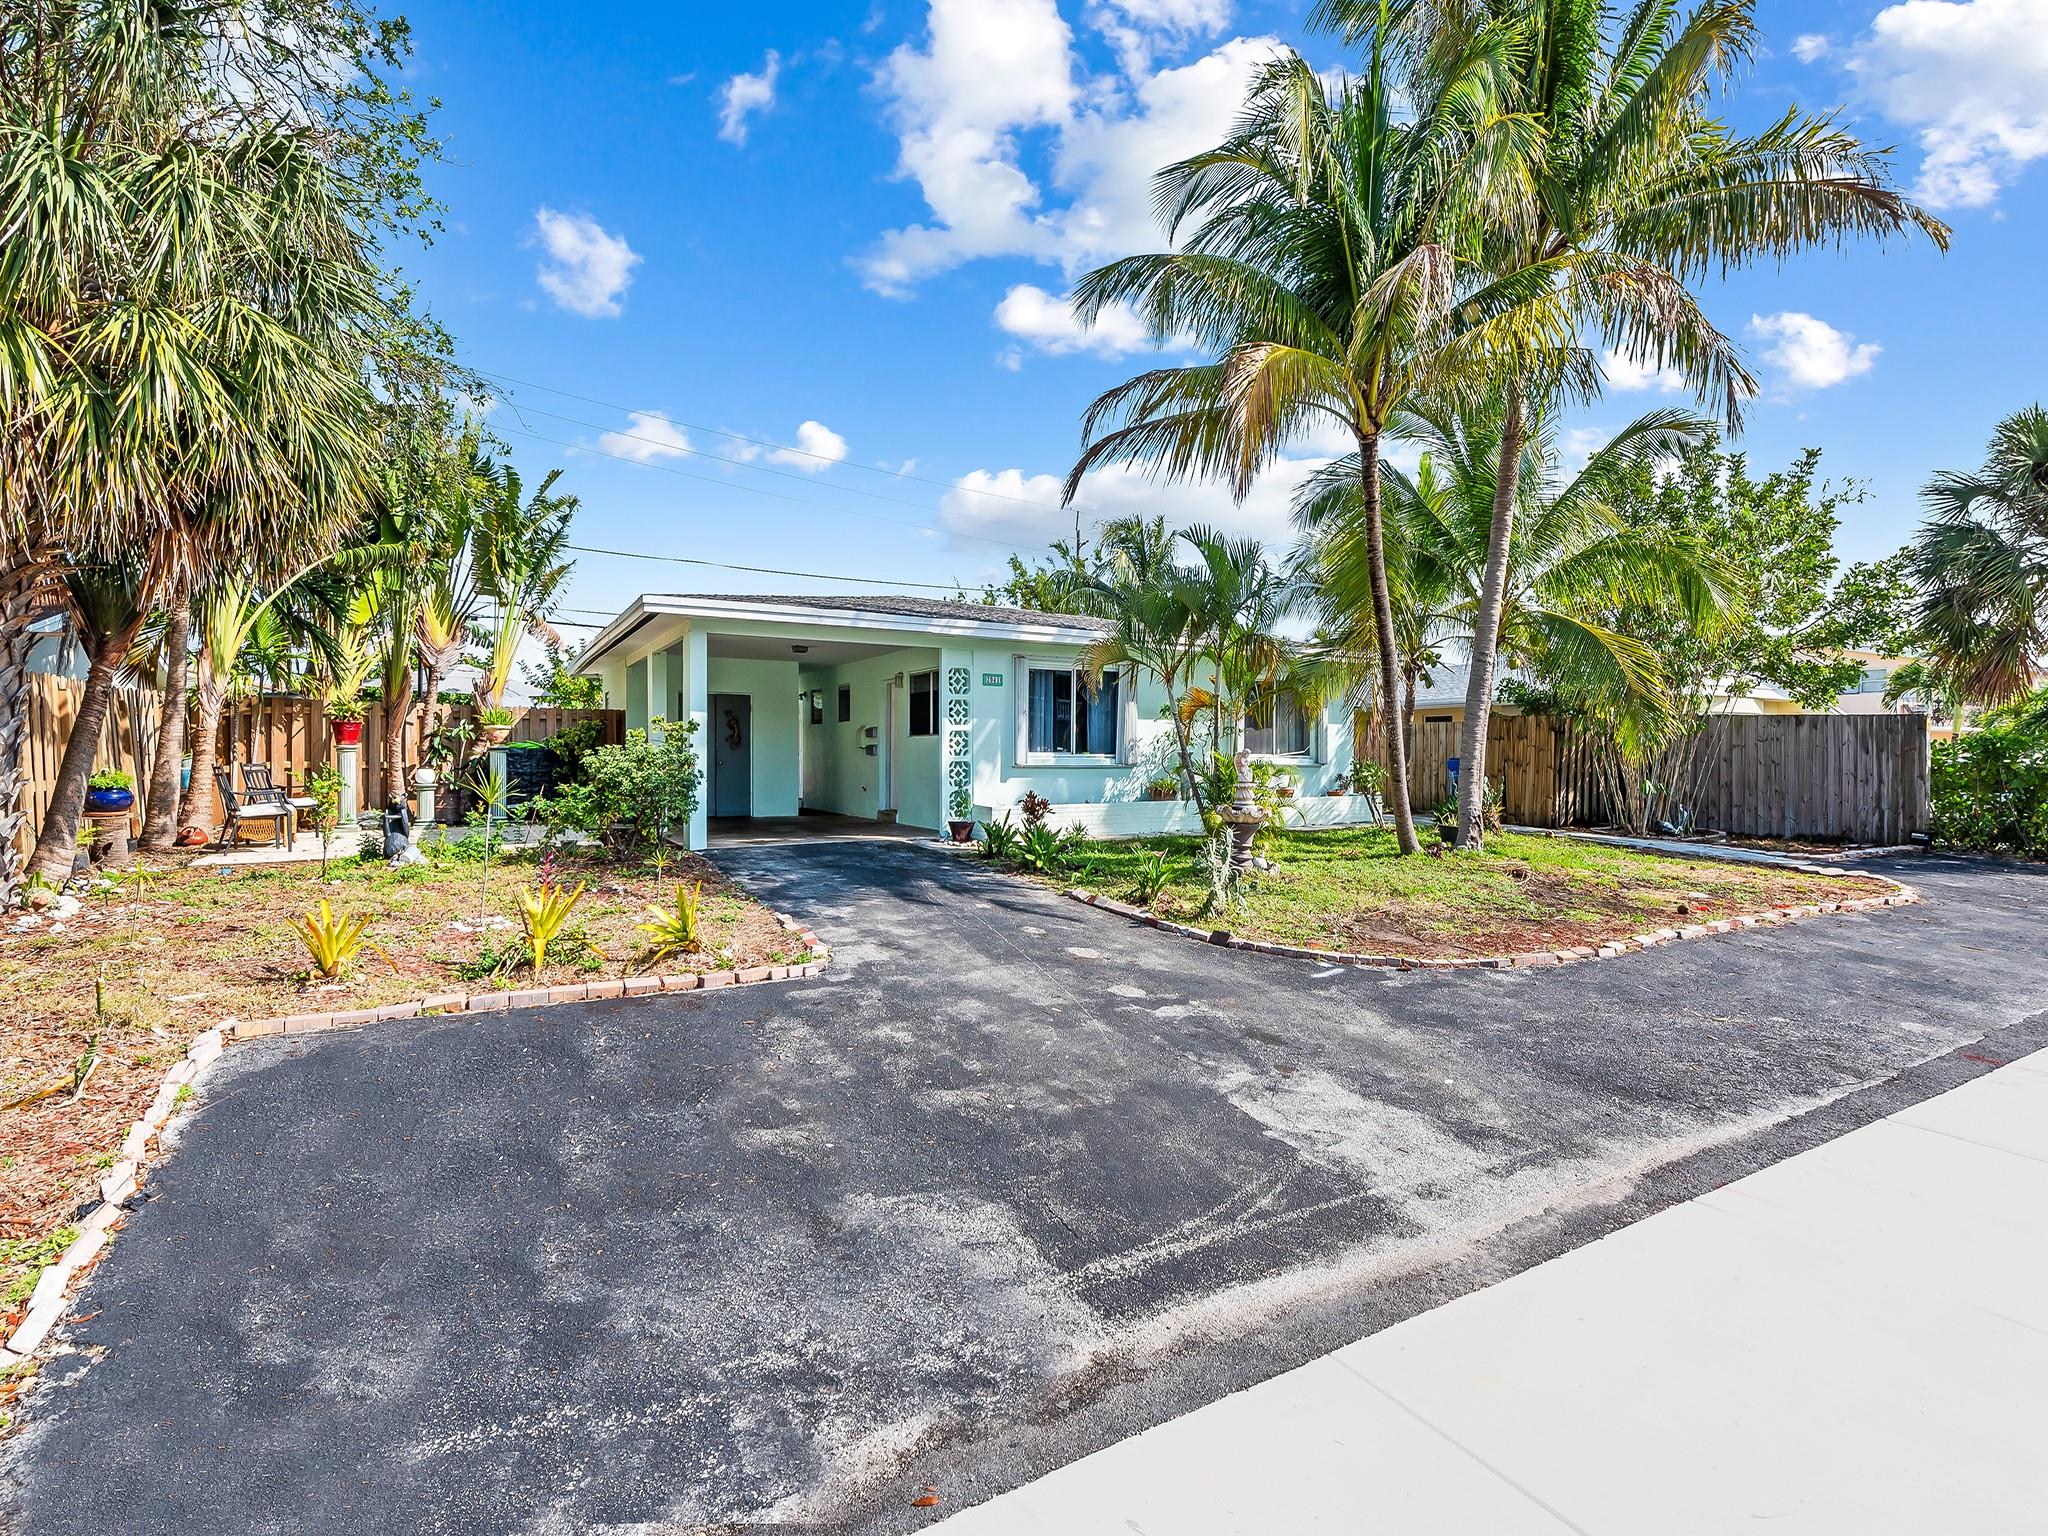
Best cash flowing properties in Fort Lauderdale, FL
Active
$235,000
2
bds
|
2
ba
|
1,008
sqft
|
built
1972
630 Tennis Club Dr, Fort Lauderdale, FL 33311
$-222
Cash flow
-4.9%
Cash-on-Cash Return
5.0%
Cap rate
1.3%
Rent to Value Ratio

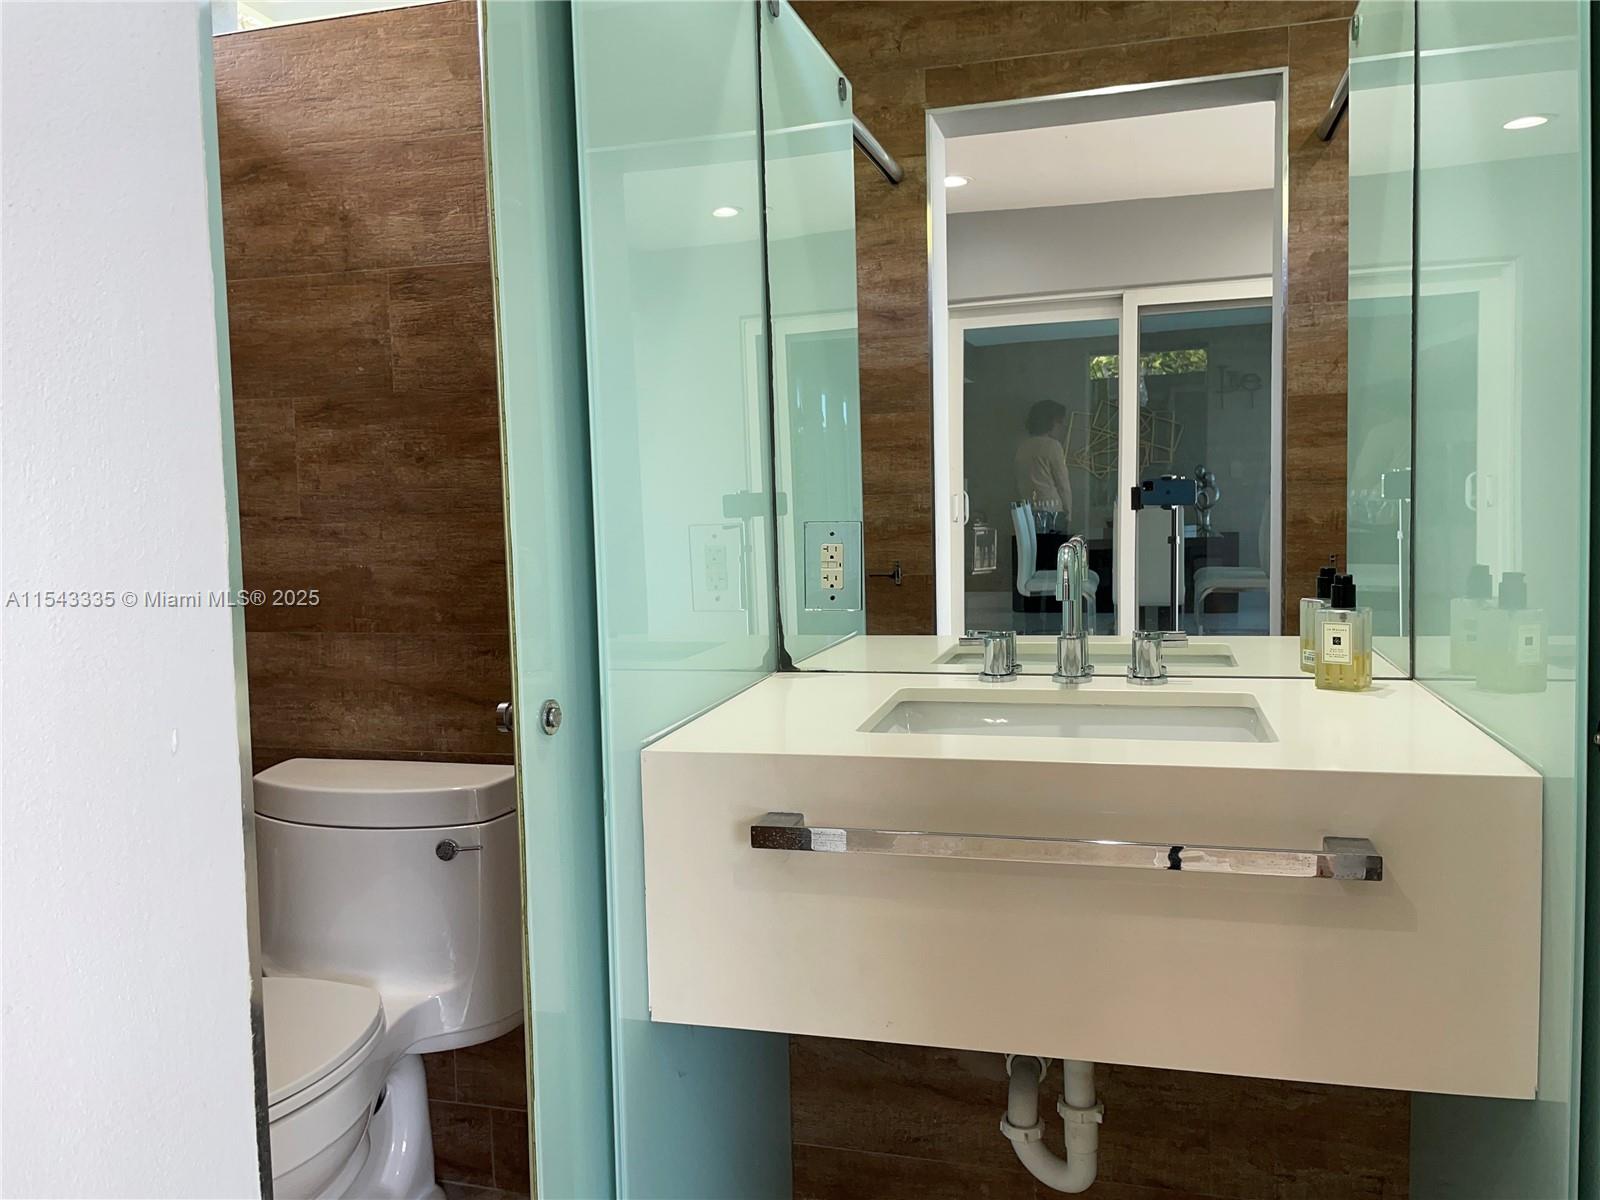
Active
$299,000
2
bds
|
2
ba
|
814
sqft
|
built
1973
1731 SE 15th St, Fort Lauderdale, FL 33316
$-247
Cash flow
-4.3%
Cash-on-Cash Return
5.2%
Cap rate
0.8%
Rent to Value Ratio
2,118 out of 2,494 properties for sale in Fort Lauderdale, FL
Limited Results Shown
Create a free account, or log in to reveal all property listings and enjoy the complete experience.
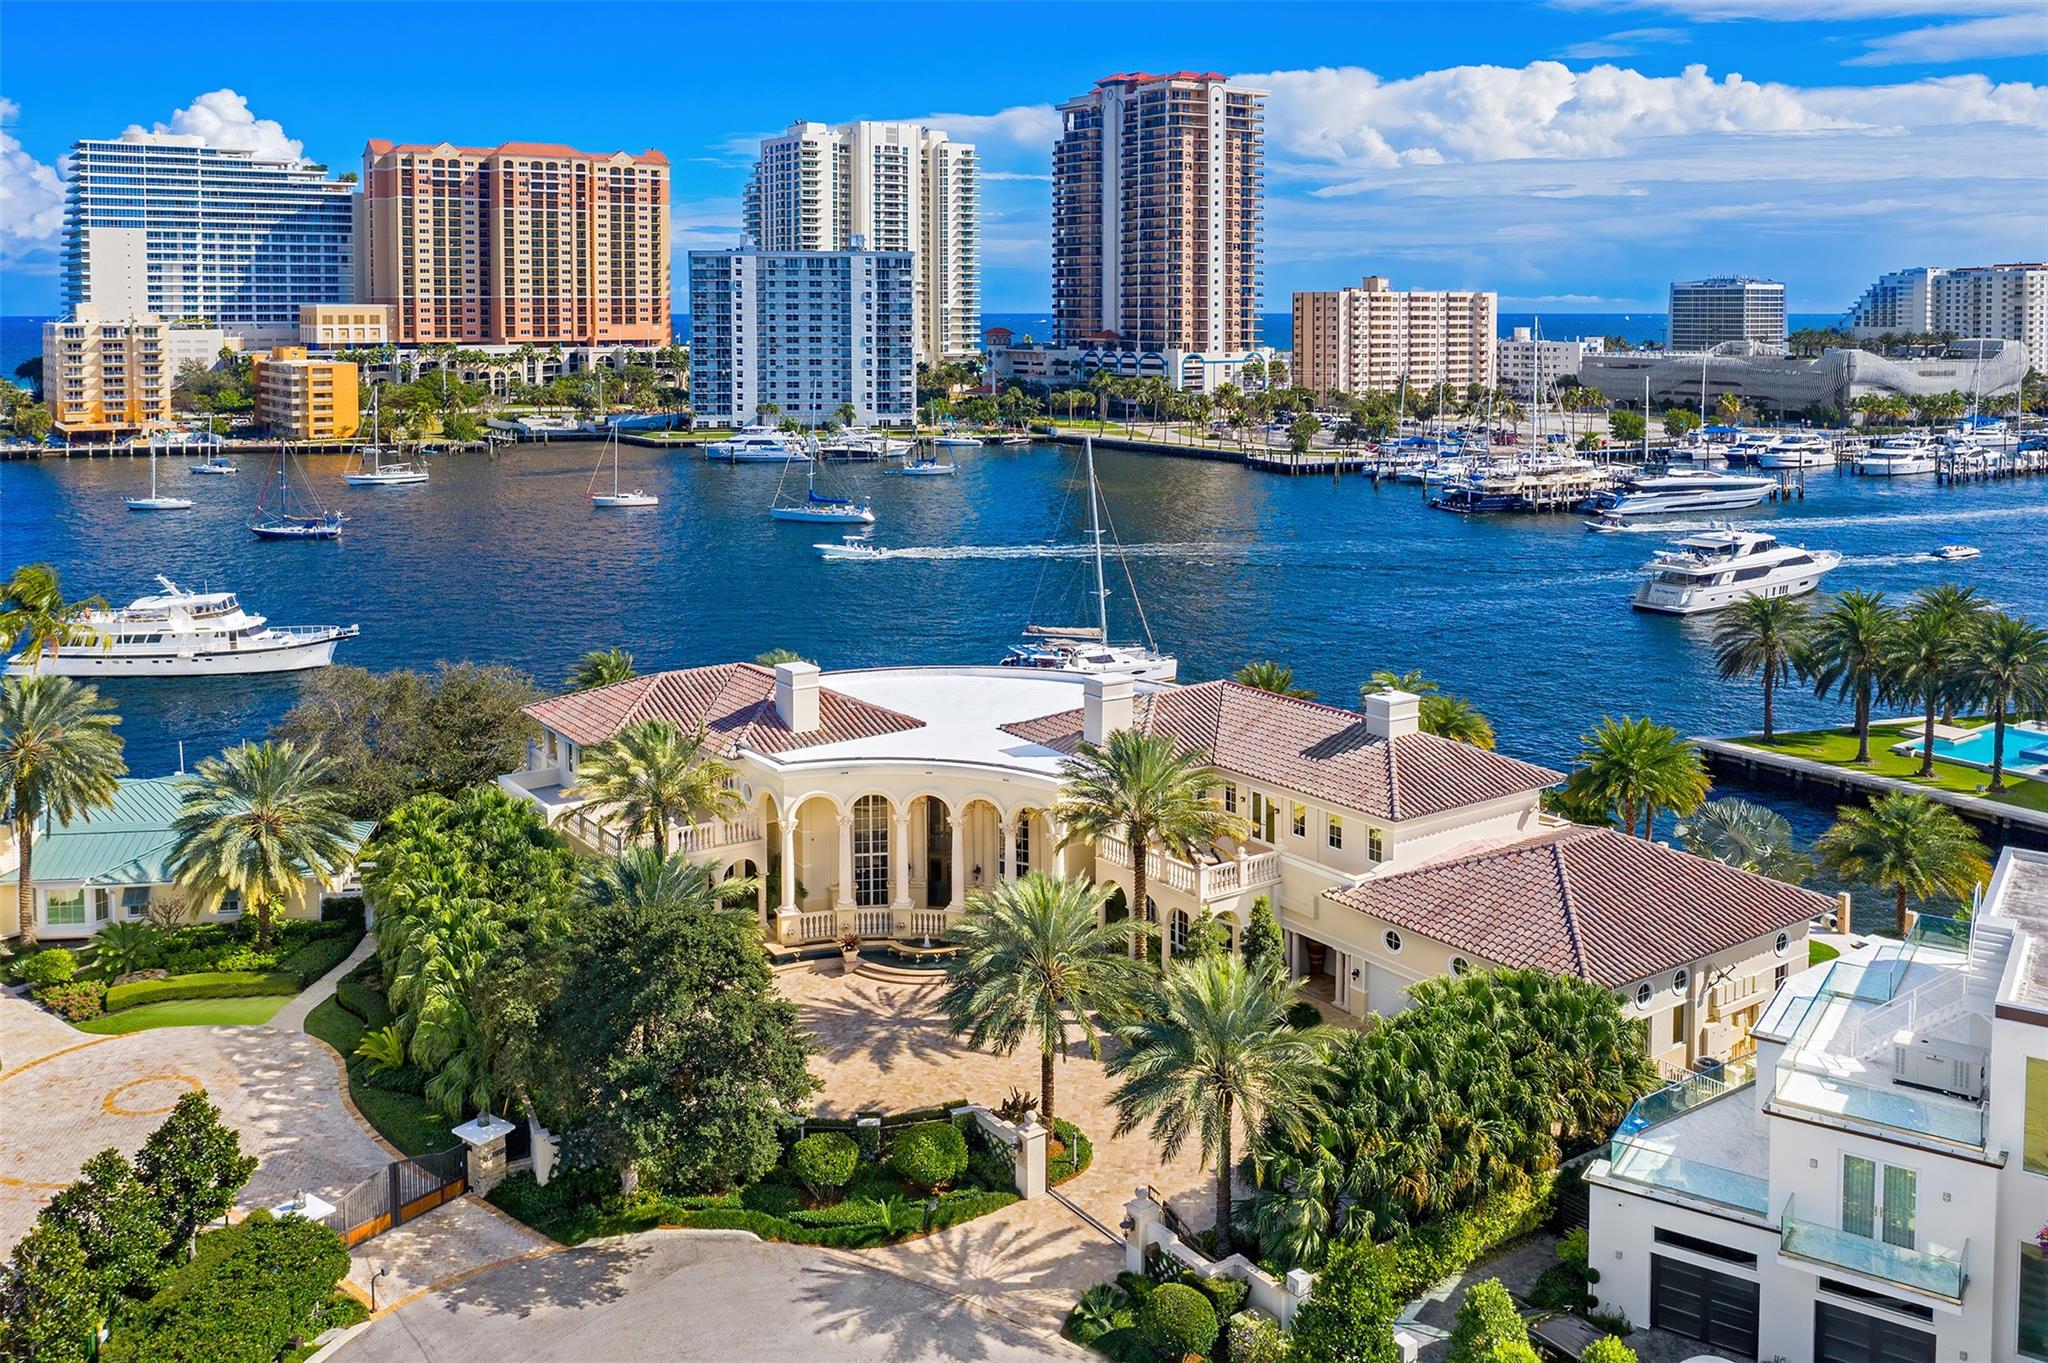
Active
$3,299,000
4
bds
|
4
ba
|
3,442
sqft
|
built
1950
924 S Rio Vista Blvd, Fort Lauderdale, FL 33316
$-11,972
Cash flow
-18.9%
Cash-on-Cash Return
1.8%
Cap rate
0.3%
Rent to Value Ratio
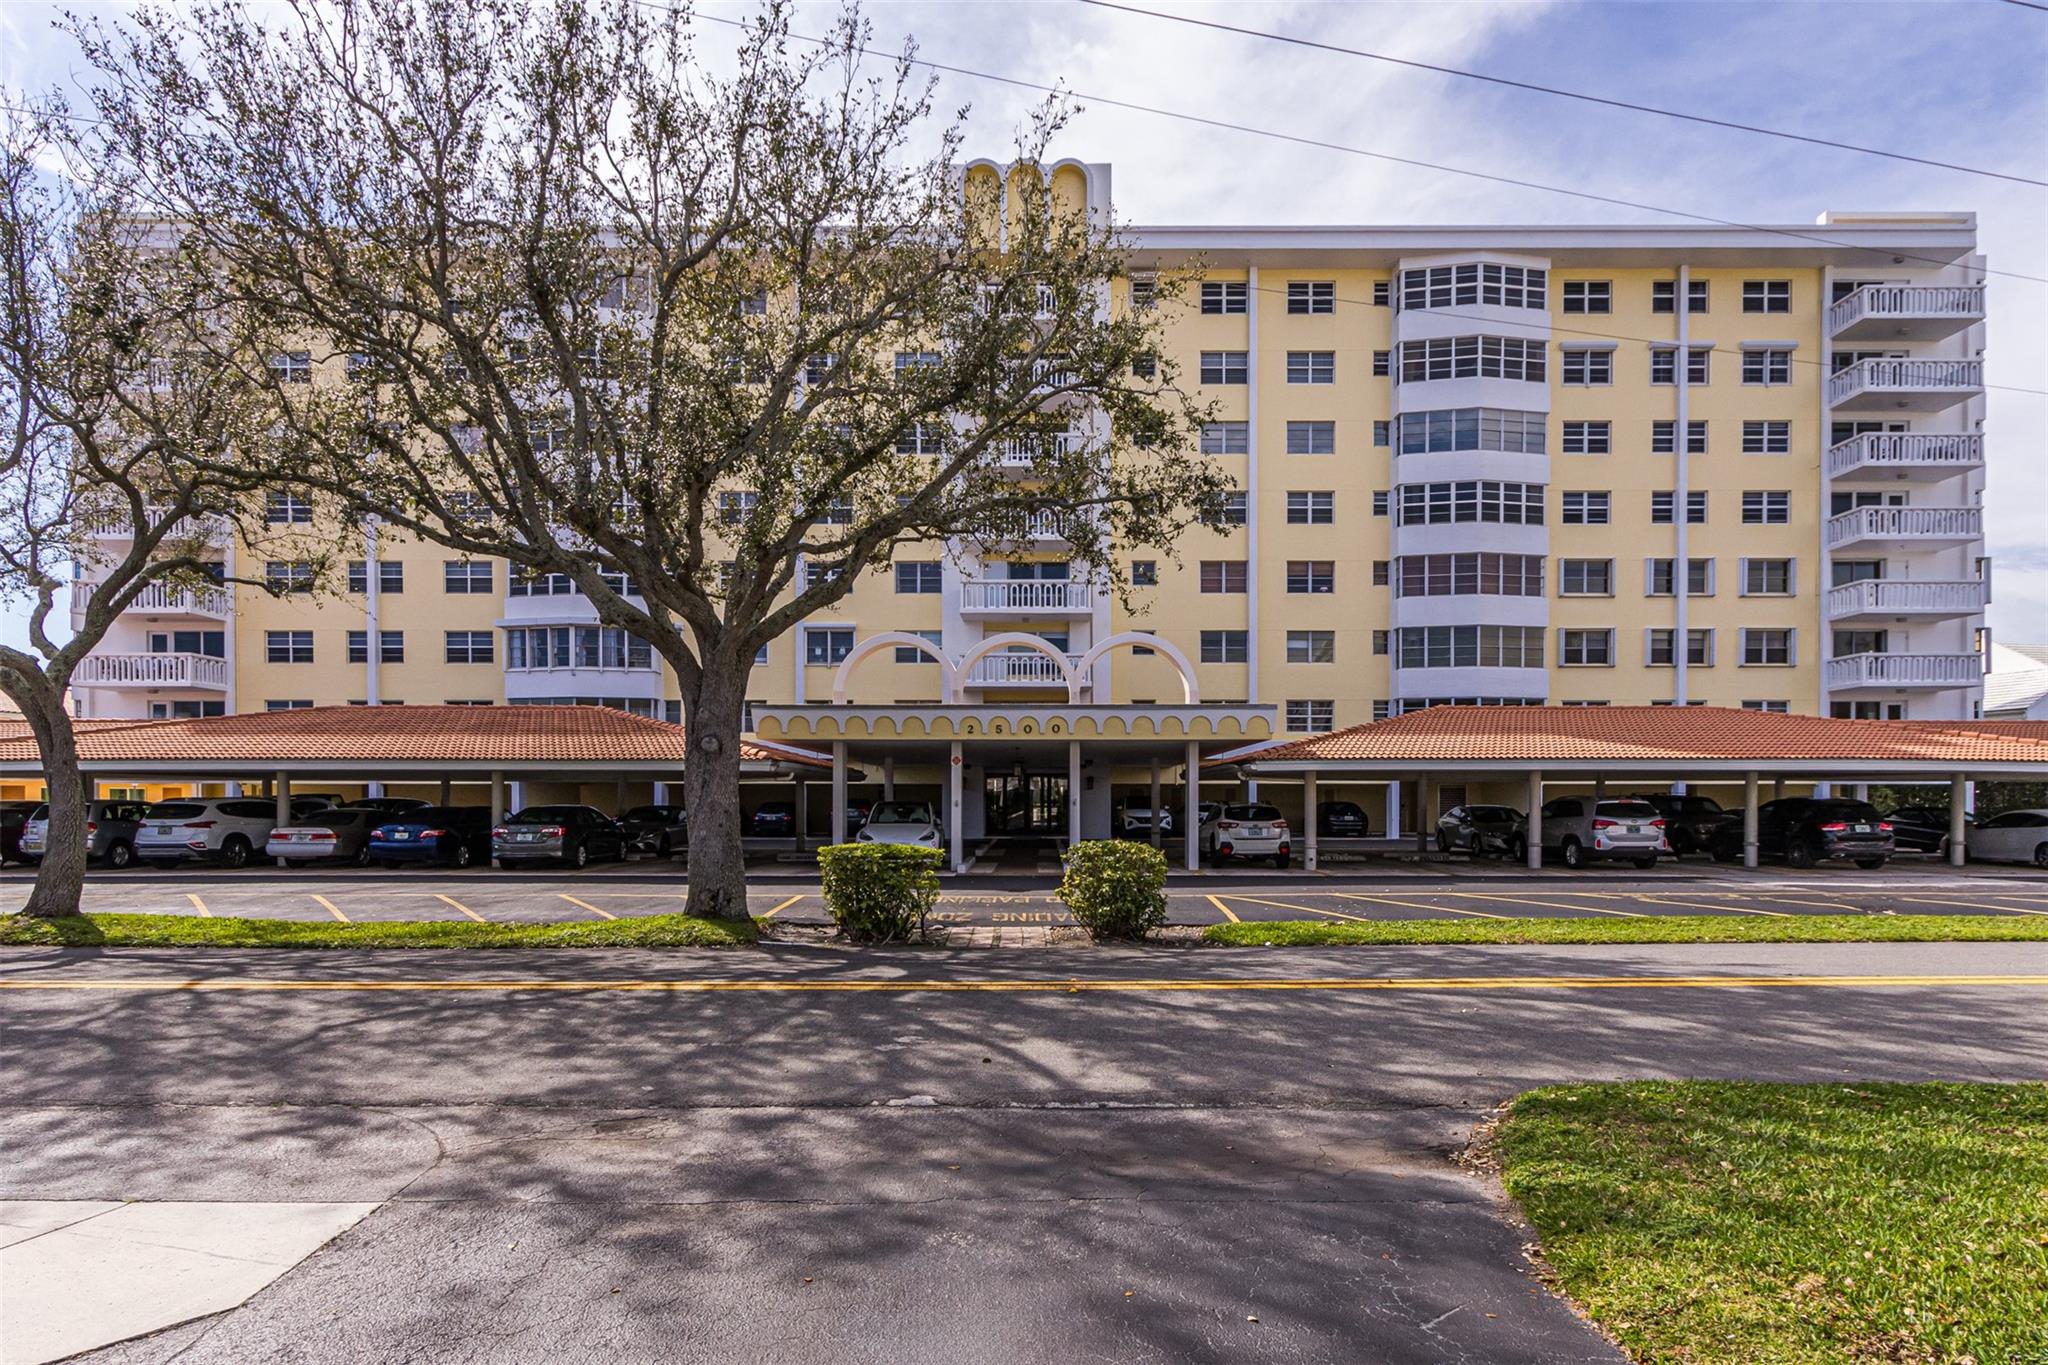
Active
$975,000
bds
|
0
ba
|
2,515
sqft
|
built
1962
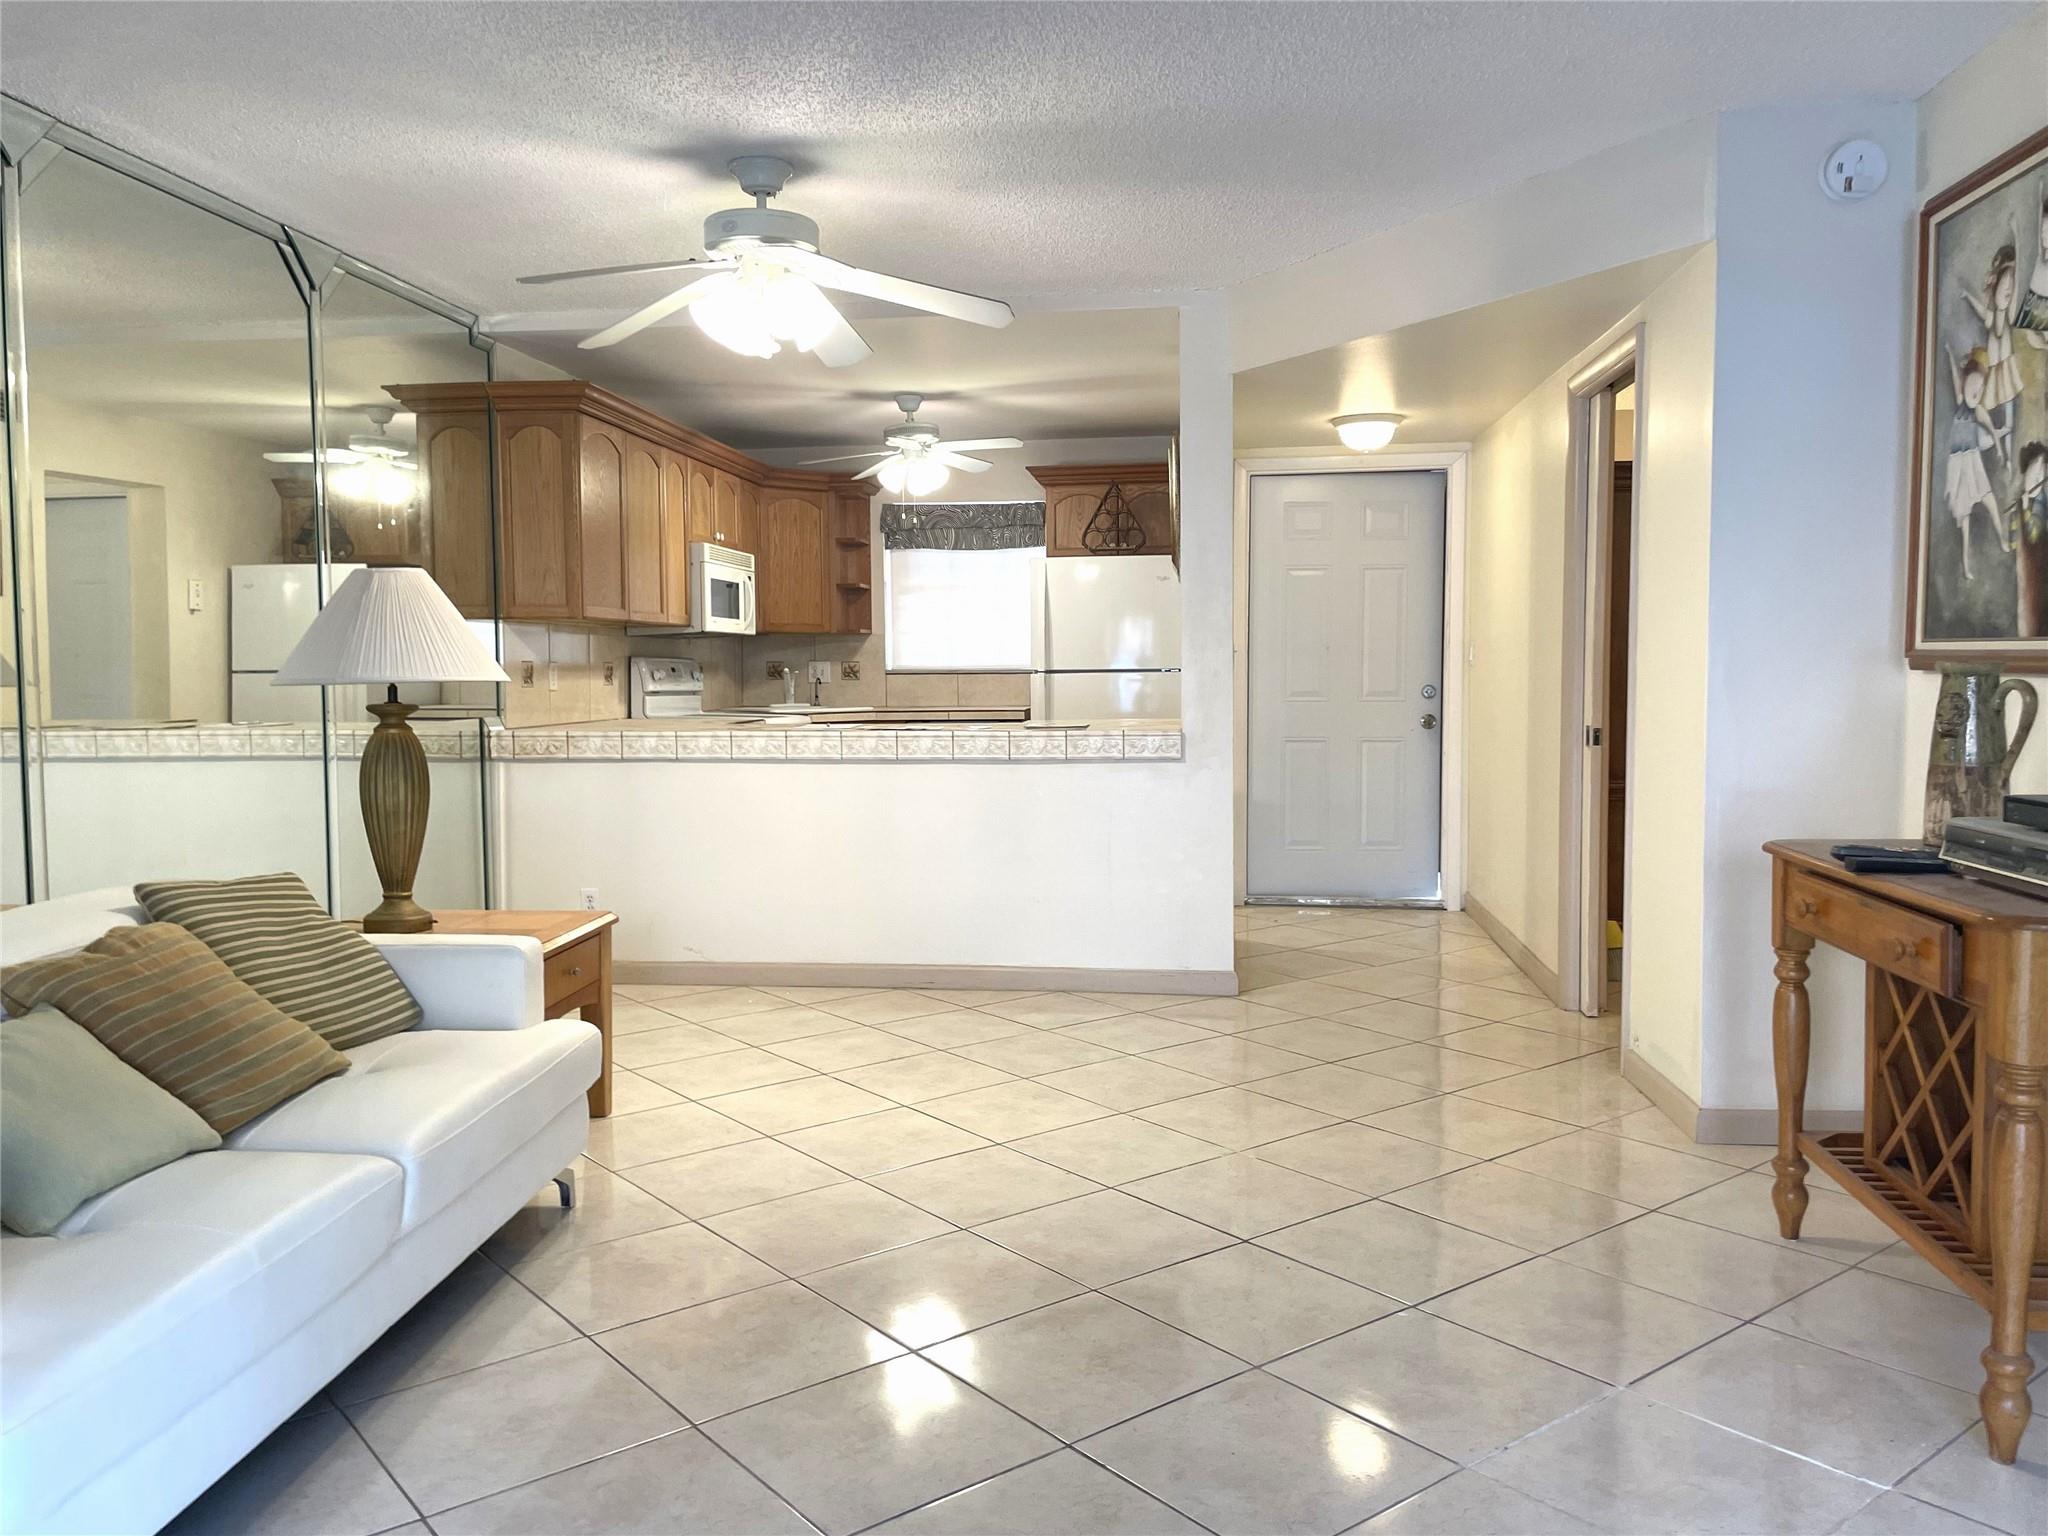
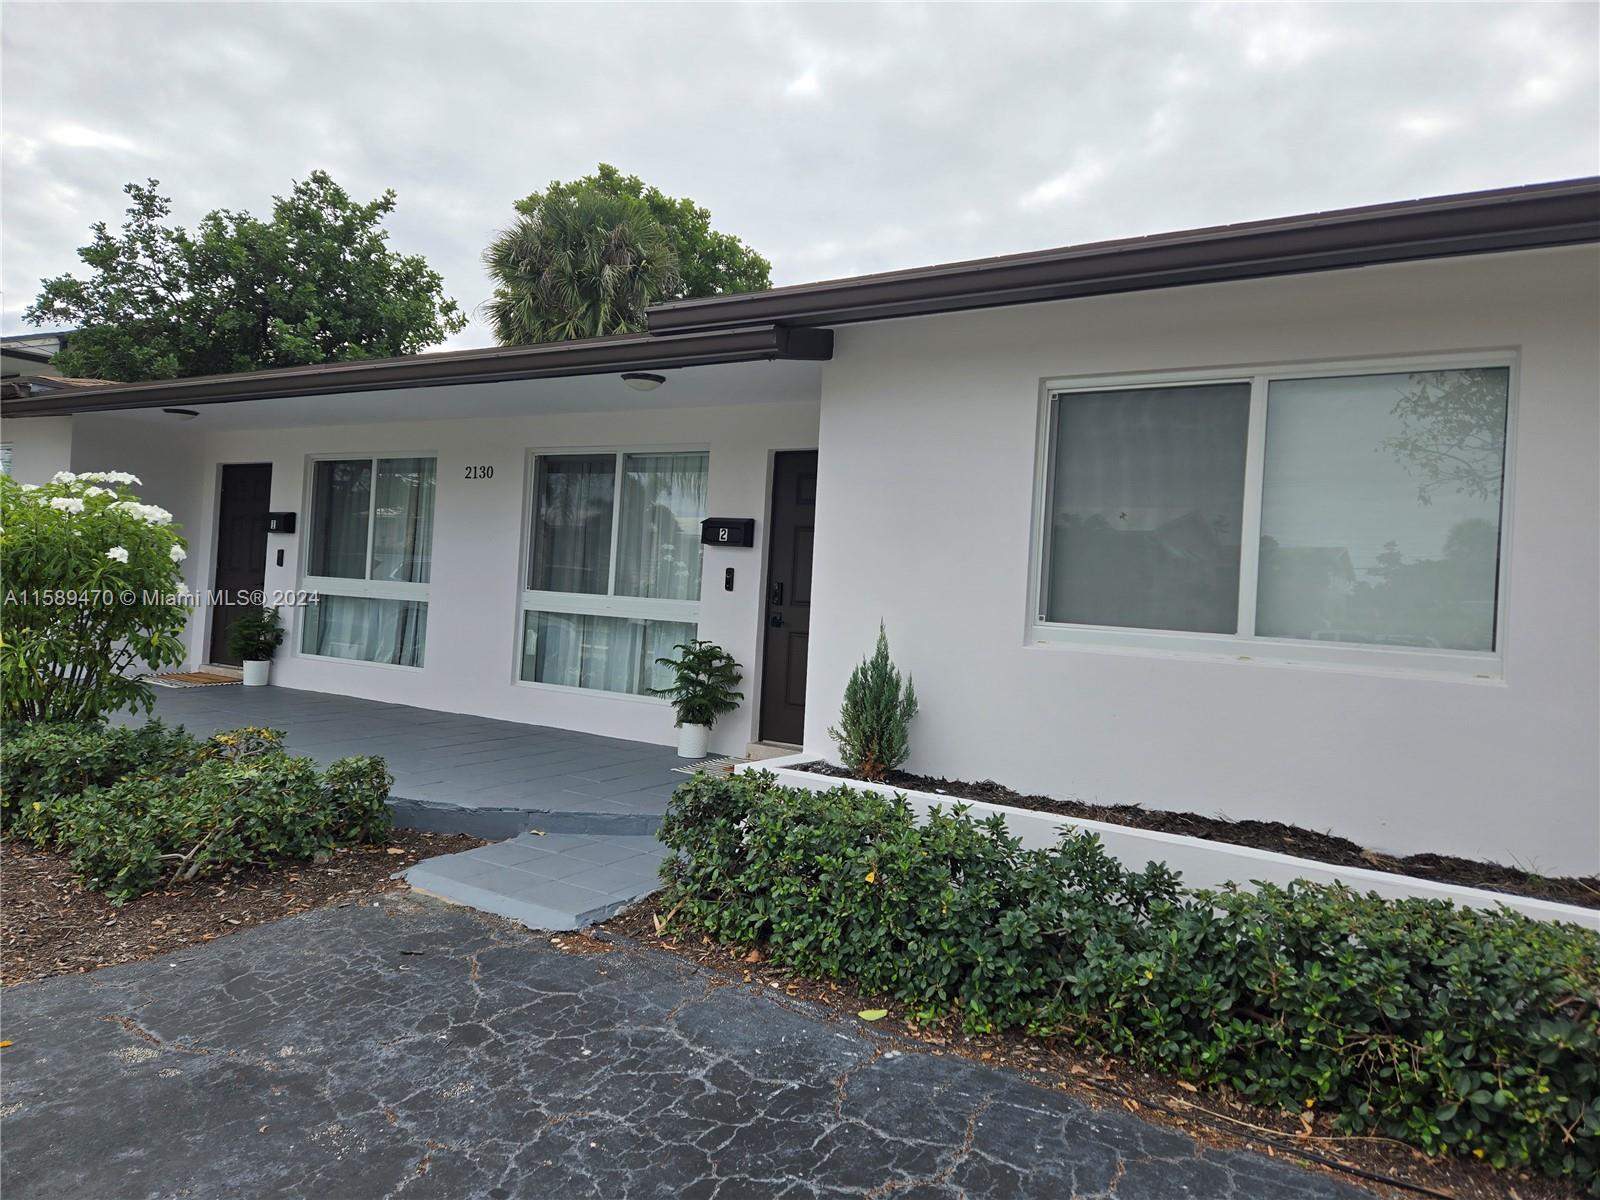
2130 NE 56th St, Fort Lauderdale, FL 33308
$-3,293
Cash flow
-17.6%
Cash-on-Cash Return
2.1%
Cap rate
0.4%
Rent to Value Ratio
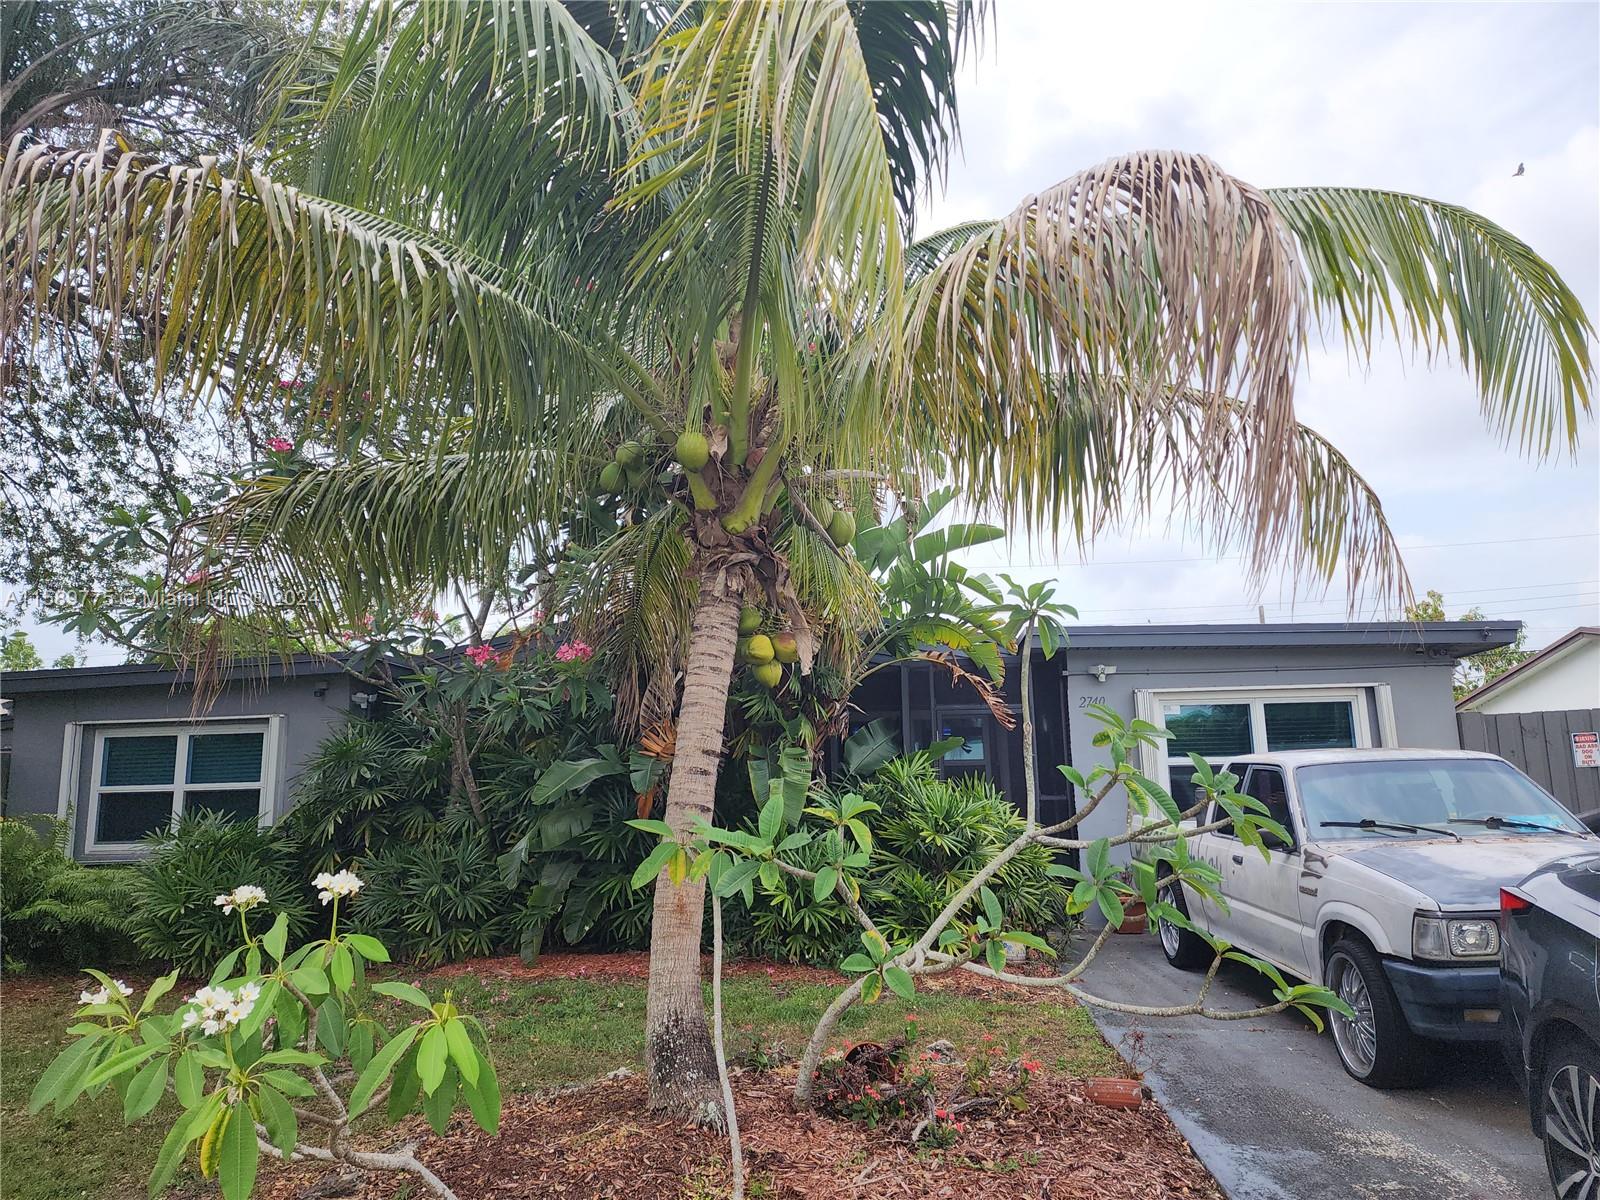
Active
$565,000
3
bds
|
2
ba
|
1,451
sqft
|
built
1956
2740 SW 46th Ct, Fort Lauderdale, FL 33312
$-629
Cash flow
-5.8%
Cash-on-Cash Return
4.8%
Cap rate
0.6%
Rent to Value Ratio

Active
$479,998
6
bds
|
2
ba
|
1,866
sqft
|
built
1960
2712 NW 14th St, Fort Lauderdale, FL 33311
$-1,056
Cash flow
-11.5%
Cash-on-Cash Return
3.5%
Cap rate
0.6%
Rent to Value Ratio
Active
$11,999,000
5
bds
|
8
ba
|
6,861
sqft
|
built
2019
1336 Seminole Dr, Fort Lauderdale, FL 33304
$-61,442
Cash flow
-26.7%
Cash-on-Cash Return
0.0%
Cap rate
0.1%
Rent to Value Ratio
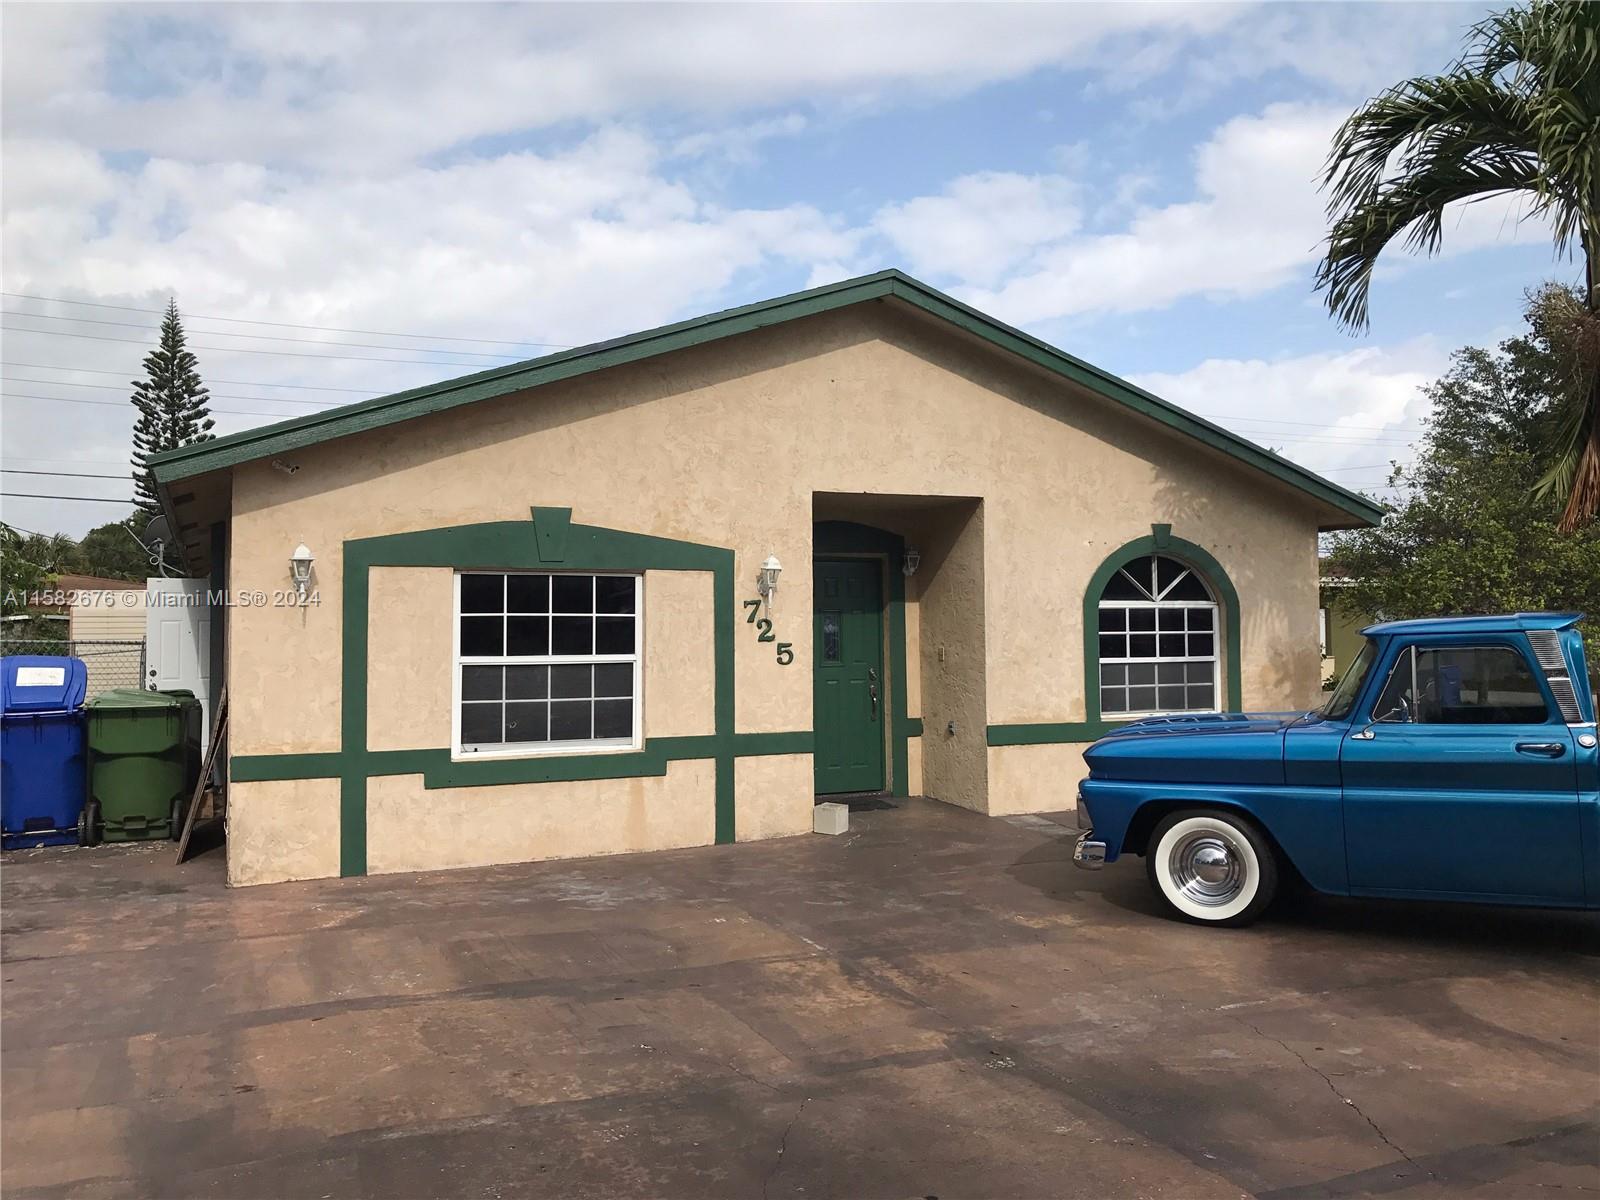
Active
$459,998
5
bds
|
2
ba
|
1,635
sqft
|
built
1997
725 NW 19th Ter, Fort Lauderdale, FL 33311
$-895
Cash flow
-10.2%
Cash-on-Cash Return
3.8%
Cap rate
0.6%
Rent to Value Ratio
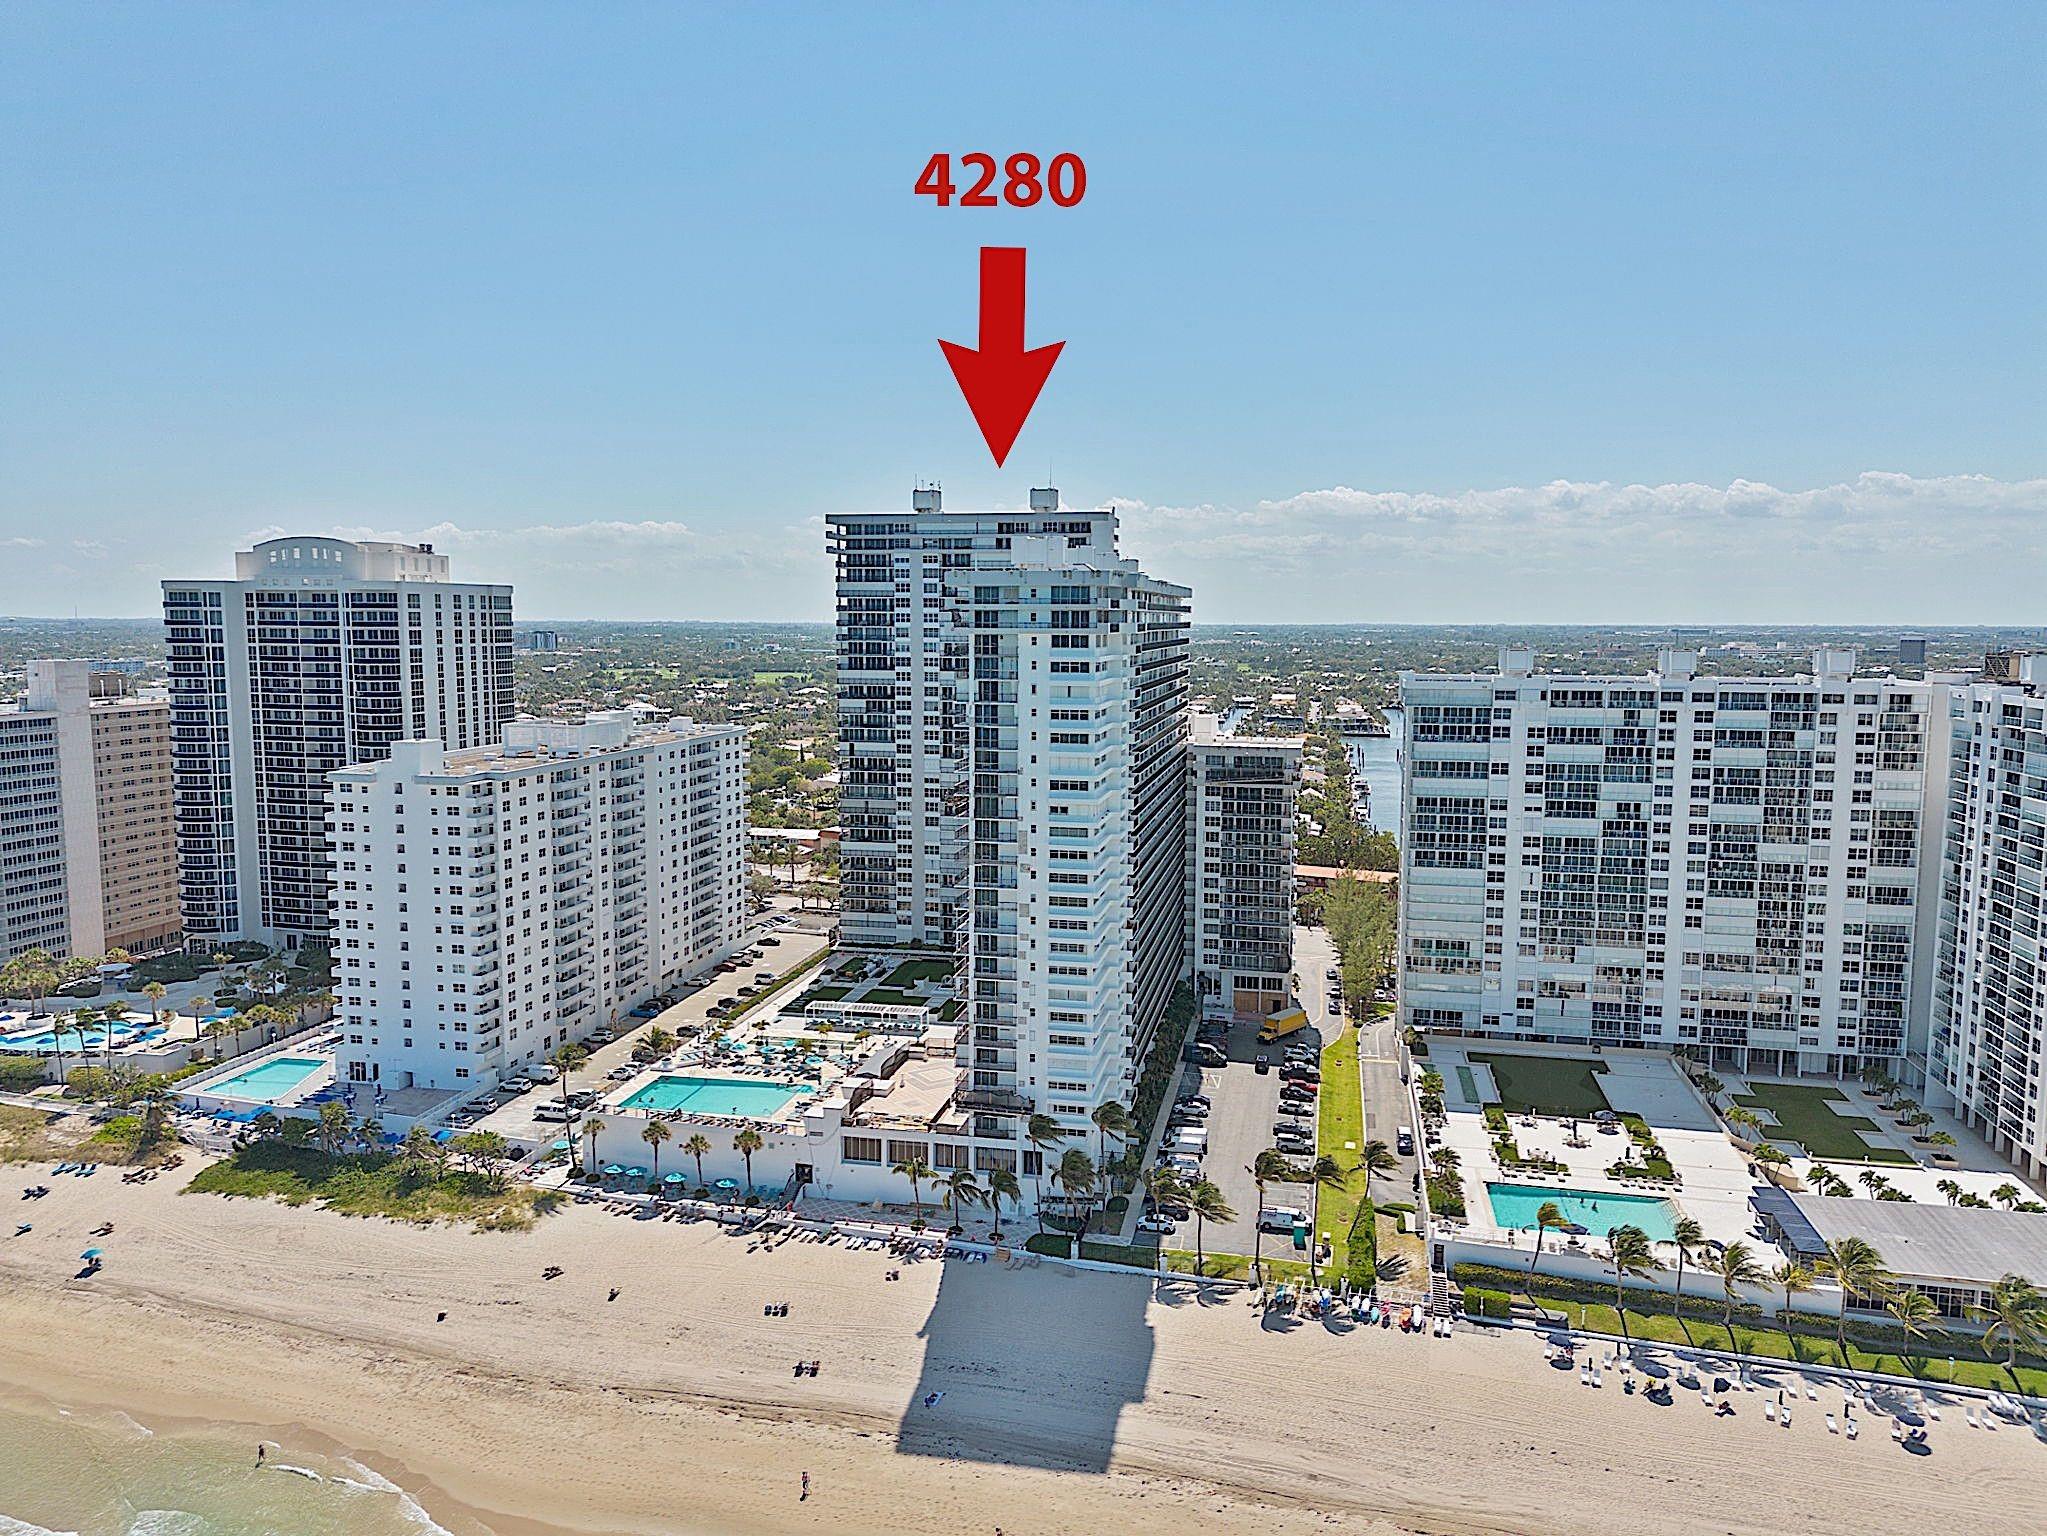
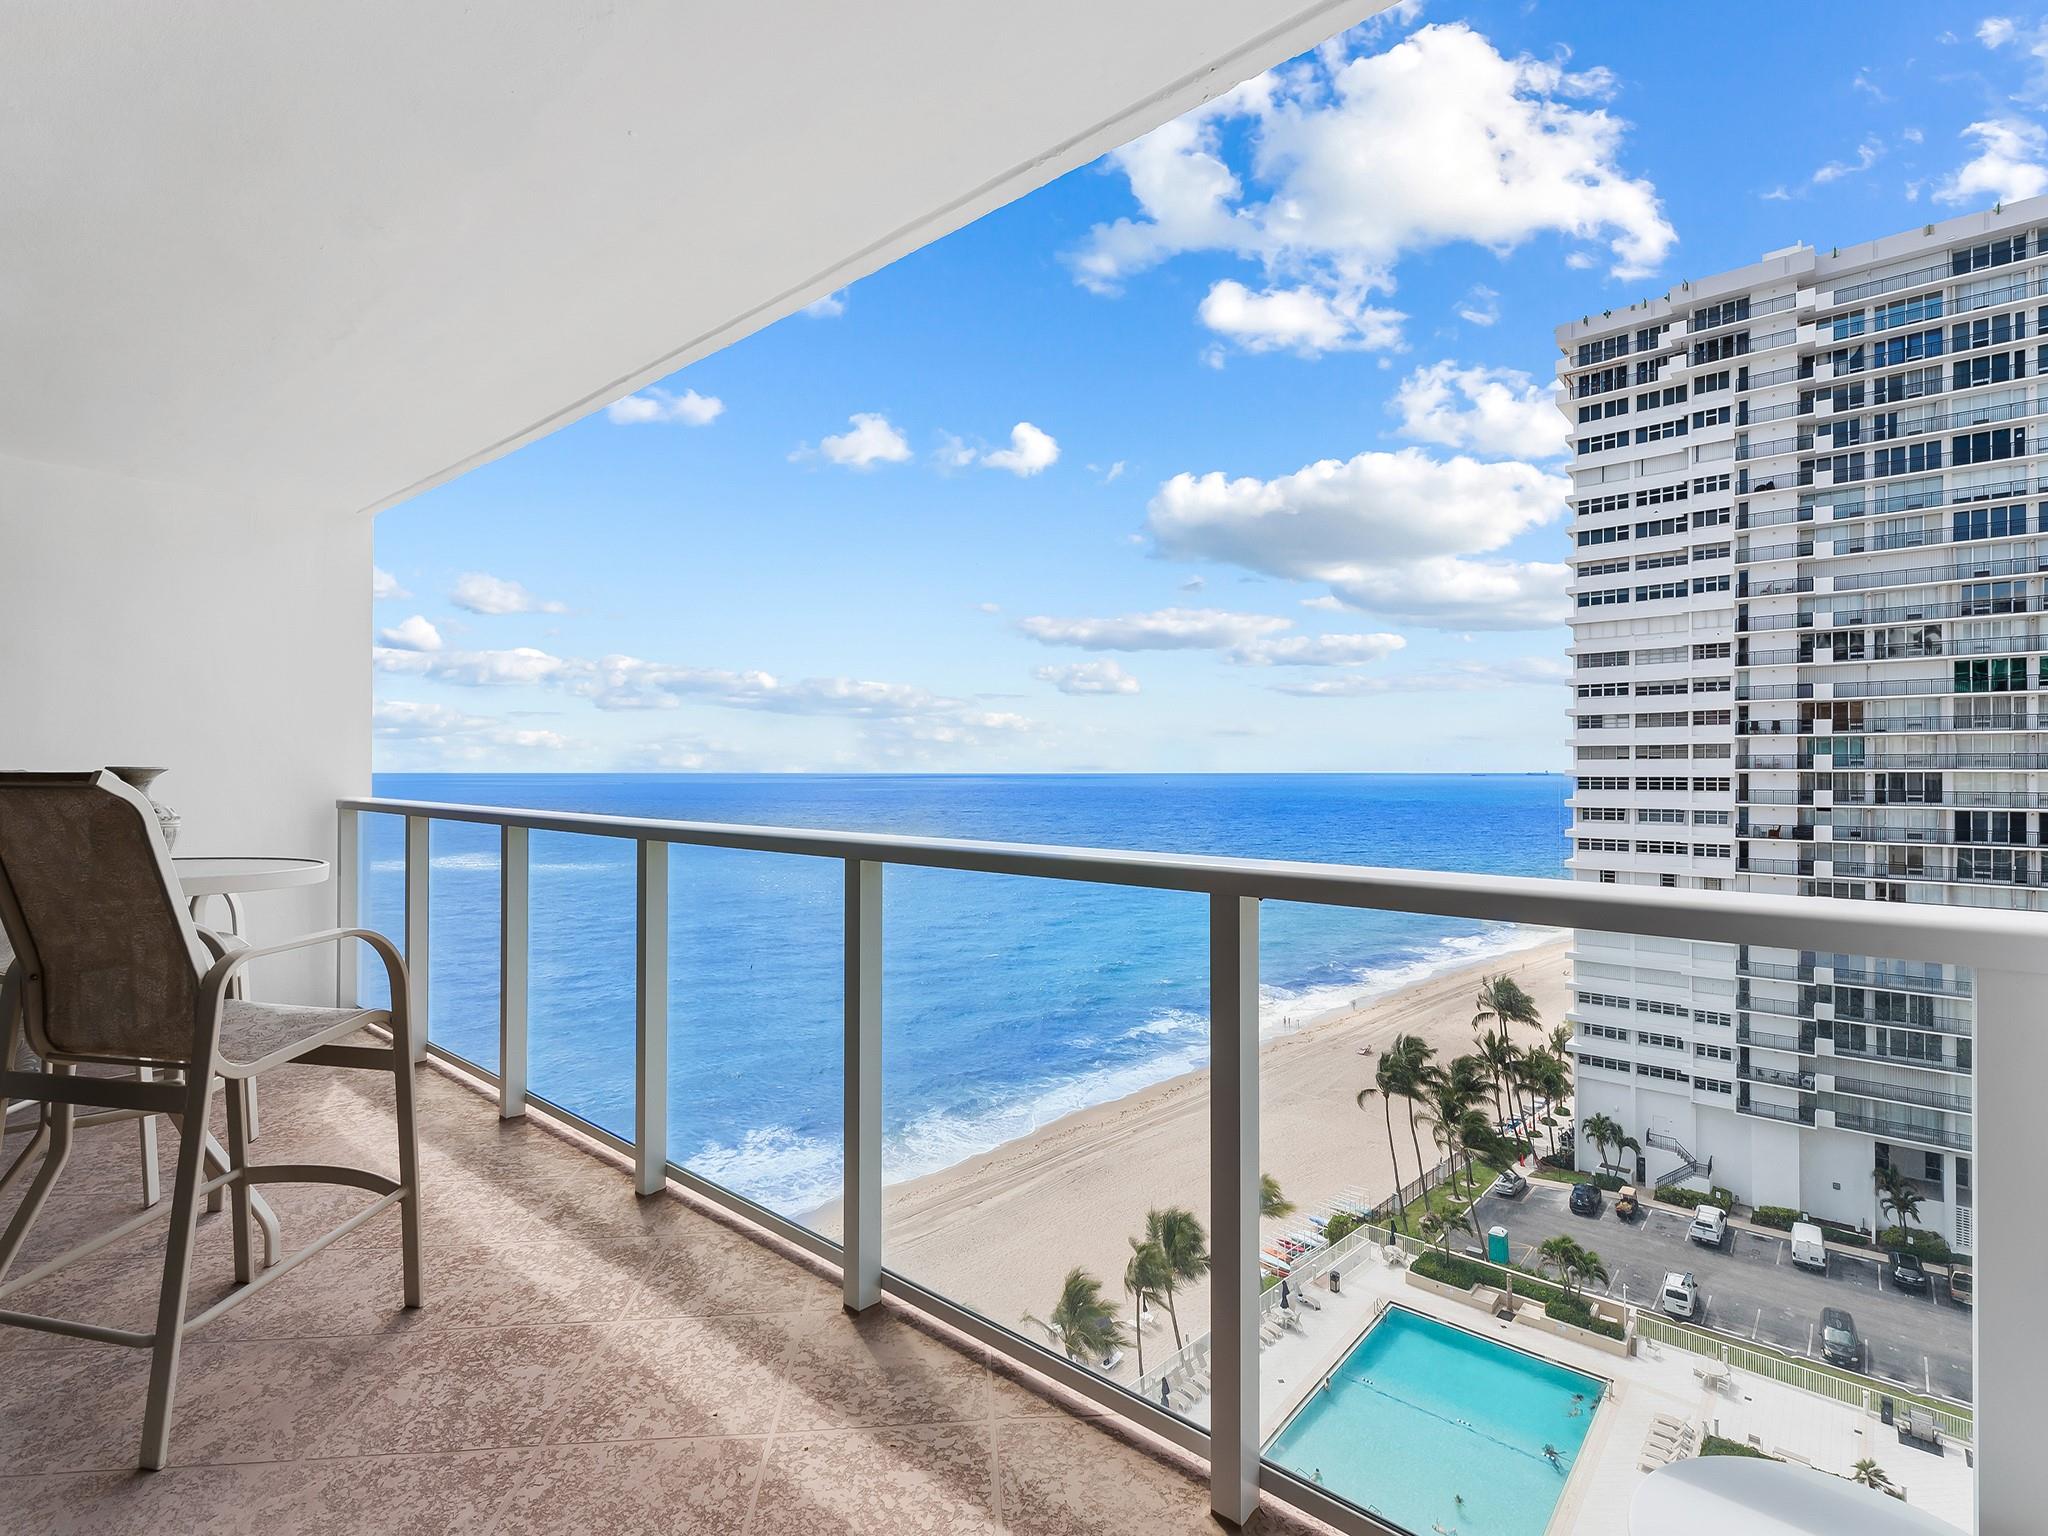
Active
$550,000
1
bds
|
2
ba
|
1,450
sqft
|
built
1970
4280 Galt Ocean Dr, Fort Lauderdale, FL 33308
$-2,901
Cash flow
-27.5%
Cash-on-Cash Return
-0.2%
Cap rate
0.6%
Rent to Value Ratio
Active
$658,000
2
bds
|
2
ba
|
1,500
sqft
|
built
1974
936 Intracoastal Dr, Fort Lauderdale, FL 33304
$-2,934
Cash flow
-23.3%
Cash-on-Cash Return
0.8%
Cap rate
0.7%
Rent to Value Ratio
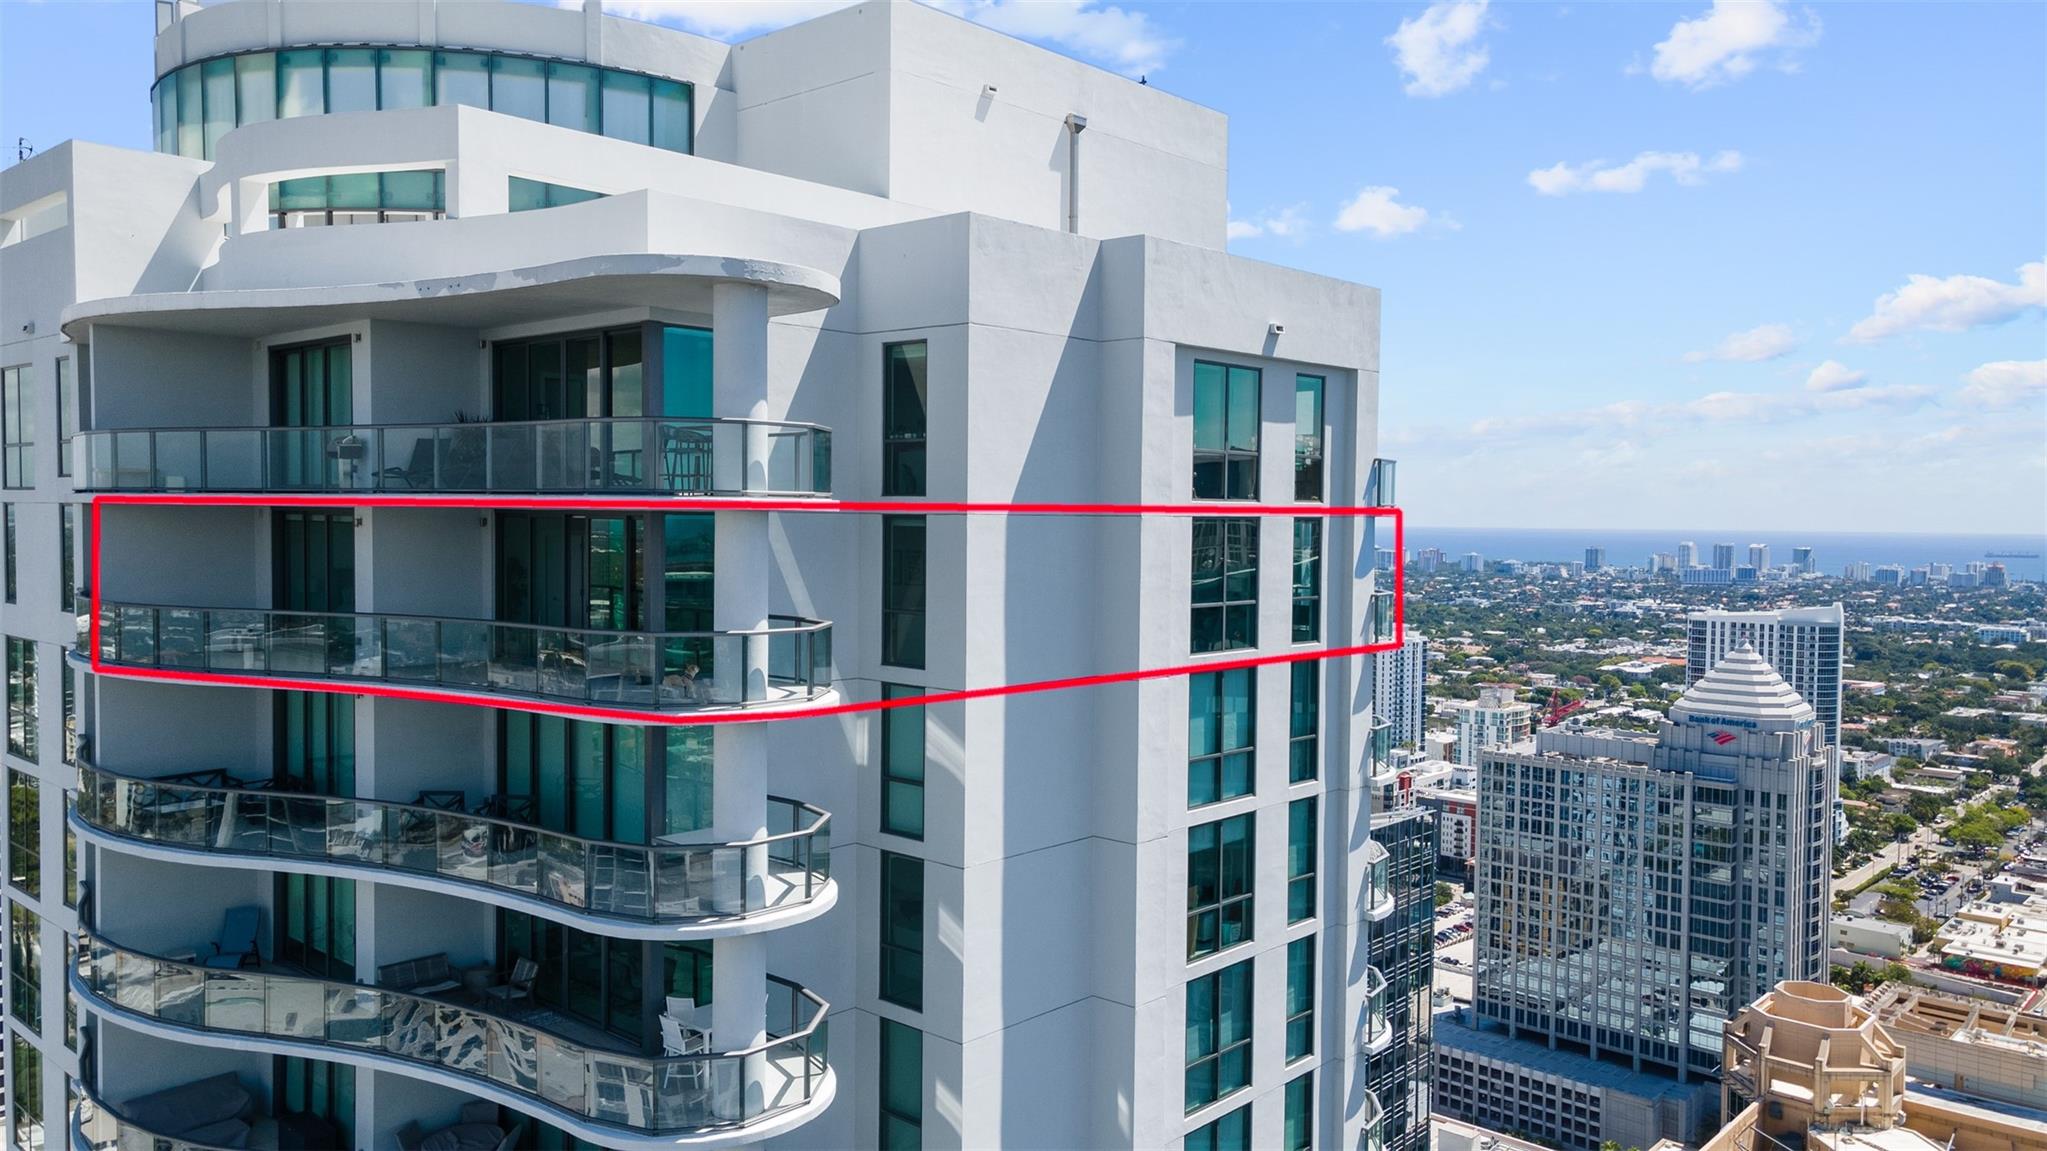
Active
$1,975,000
2
bds
|
3
ba
|
1,867
sqft
|
built
2020
100 E Las Olas Blvd, Fort Lauderdale, FL 33301
$-7,097
Cash flow
-18.7%
Cash-on-Cash Return
1.8%
Cap rate
0.6%
Rent to Value Ratio
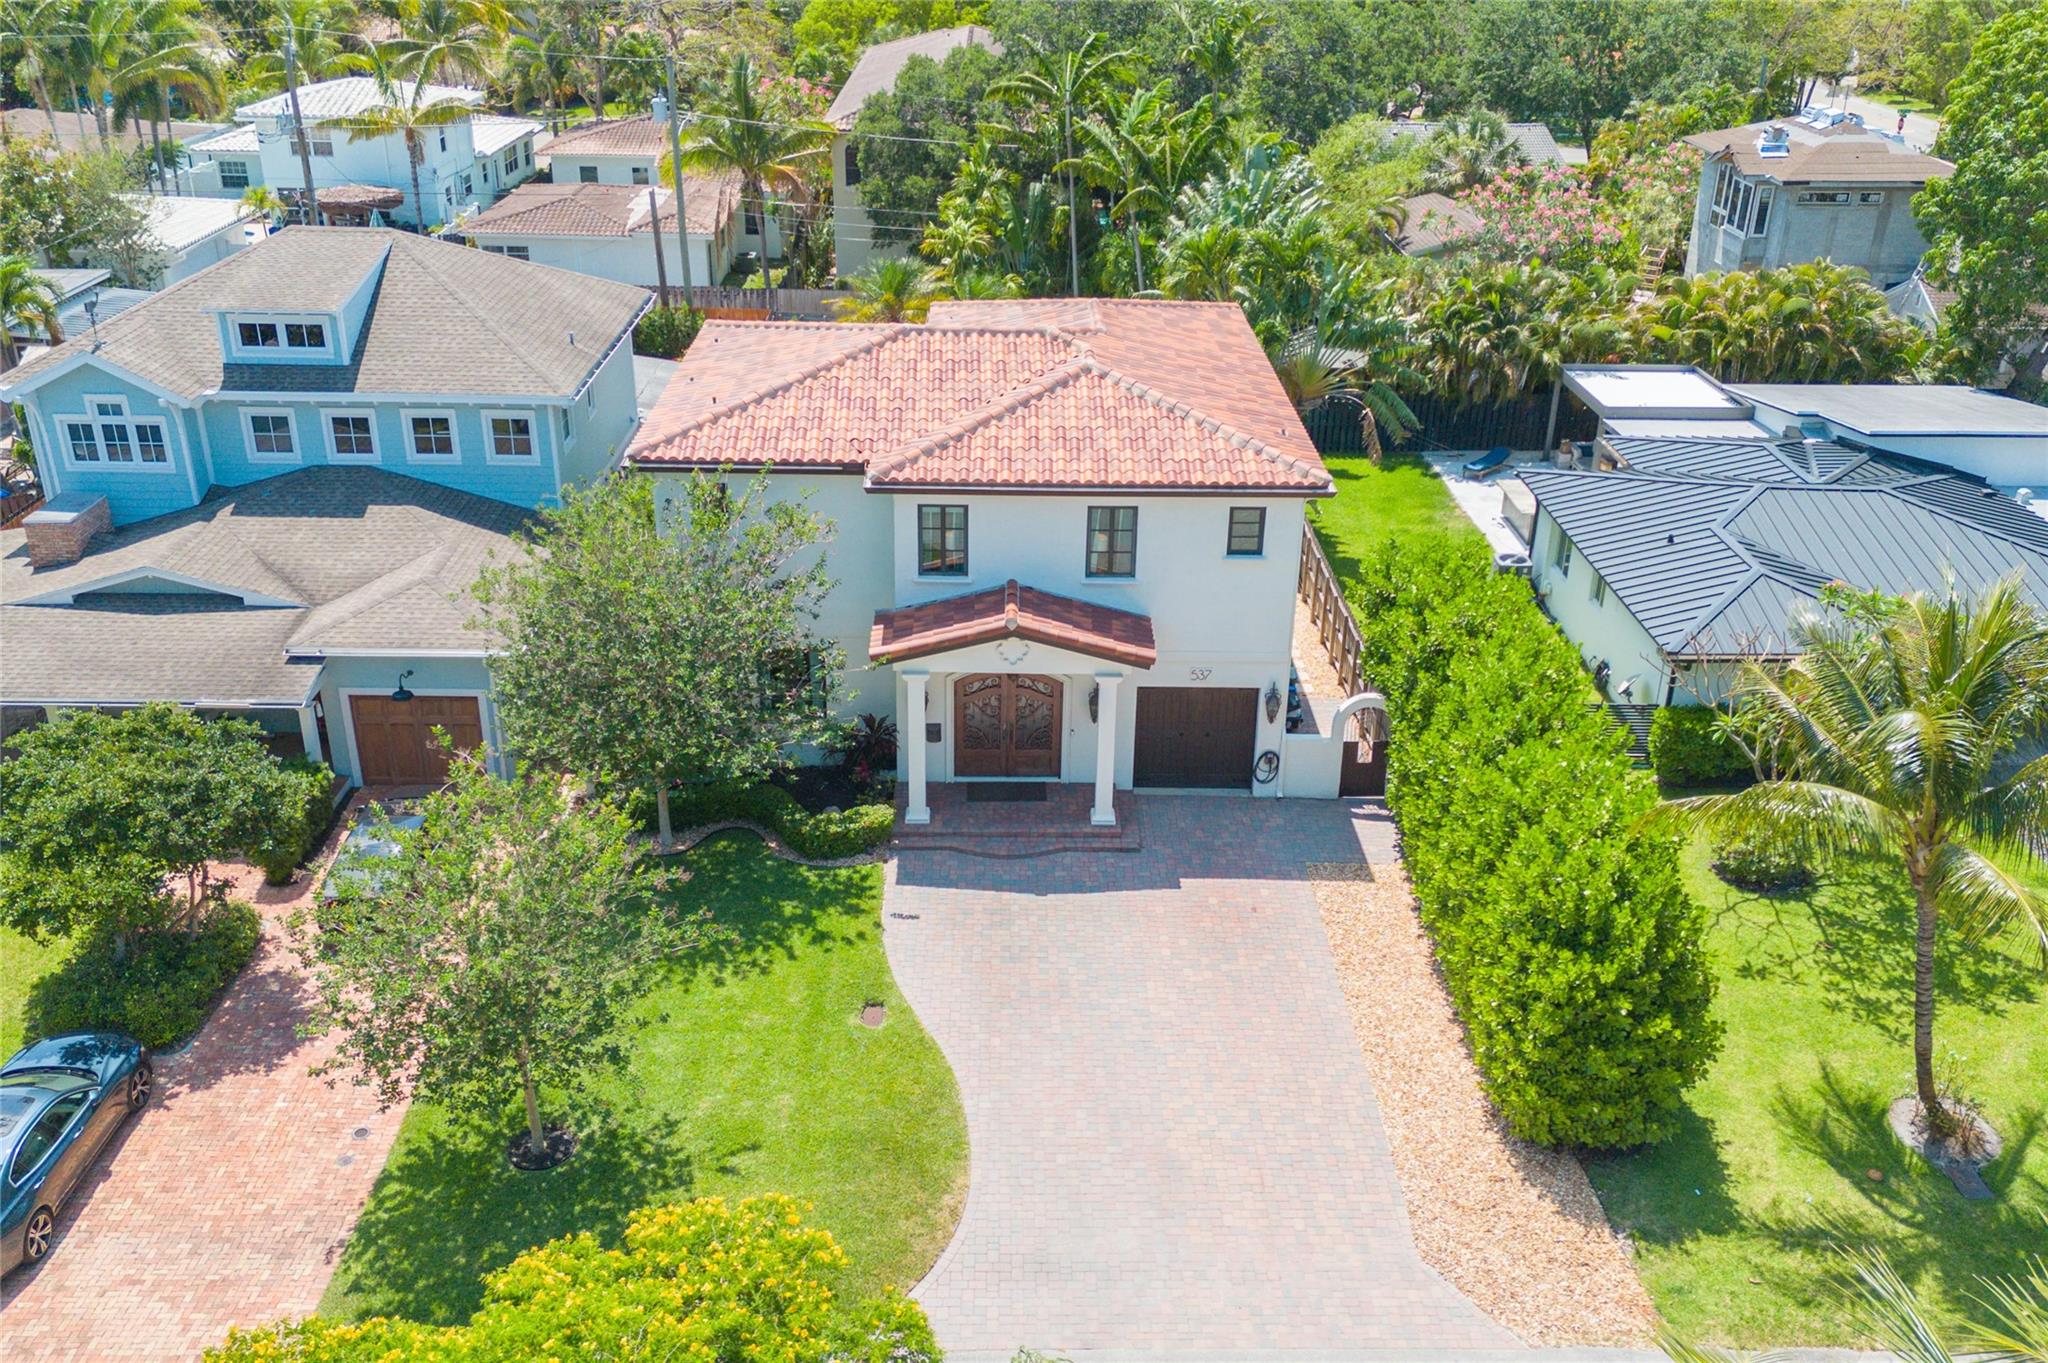
Active
$1,795,000
3
bds
|
4
ba
|
2,759
sqft
|
built
1959
537 NE 13th Ave, Fort Lauderdale, FL 33301
$-5,787
Cash flow
-16.8%
Cash-on-Cash Return
2.3%
Cap rate
0.5%
Rent to Value Ratio
Active
$489,000
2
bds
|
2
ba
|
1,100
sqft
|
built
1966
800 SE 4th St, Fort Lauderdale, FL 33301
$-2,079
Cash flow
-22.2%
Cash-on-Cash Return
1.0%
Cap rate
0.7%
Rent to Value Ratio
Active
$209,000
1
bds
|
1
ba
|
440
sqft
|
built
1964
2900 NE 30th St, Fort Lauderdale, FL 33306
$-743
Cash flow
-18.5%
Cash-on-Cash Return
1.9%
Cap rate
0.8%
Rent to Value Ratio
Active
$1,150,000
2
bds
|
2
ba
|
1,880
sqft
|
built
1969
2100 S Ocean Ln, Fort Lauderdale, FL 33316
$-3,837
Cash flow
-17.4%
Cash-on-Cash Return
2.1%
Cap rate
0.6%
Rent to Value Ratio
Active
$215,000
1
bds
|
1
ba
|
896
sqft
|
built
1978
1160 N Federal Hwy, Fort Lauderdale, FL 33304
$-817
Cash flow
-19.8%
Cash-on-Cash Return
1.6%
Cap rate
0.9%
Rent to Value Ratio
Active
$2,399,000
4
bds
|
5
ba
|
2,870
sqft
|
built
1972
1998 SW 16th Ct, Fort Lauderdale, FL 33312
$-5,600
Cash flow
-12.2%
Cash-on-Cash Return
3.3%
Cap rate
0.5%
Rent to Value Ratio
Active
$998,891
3
bds
|
2
ba
|
1,662
sqft
|
built
1953
2818 NE 21st Ave, Fort Lauderdale, FL 33306
$-2,658
Cash flow
-13.9%
Cash-on-Cash Return
3.0%
Cap rate
0.5%
Rent to Value Ratio
Active
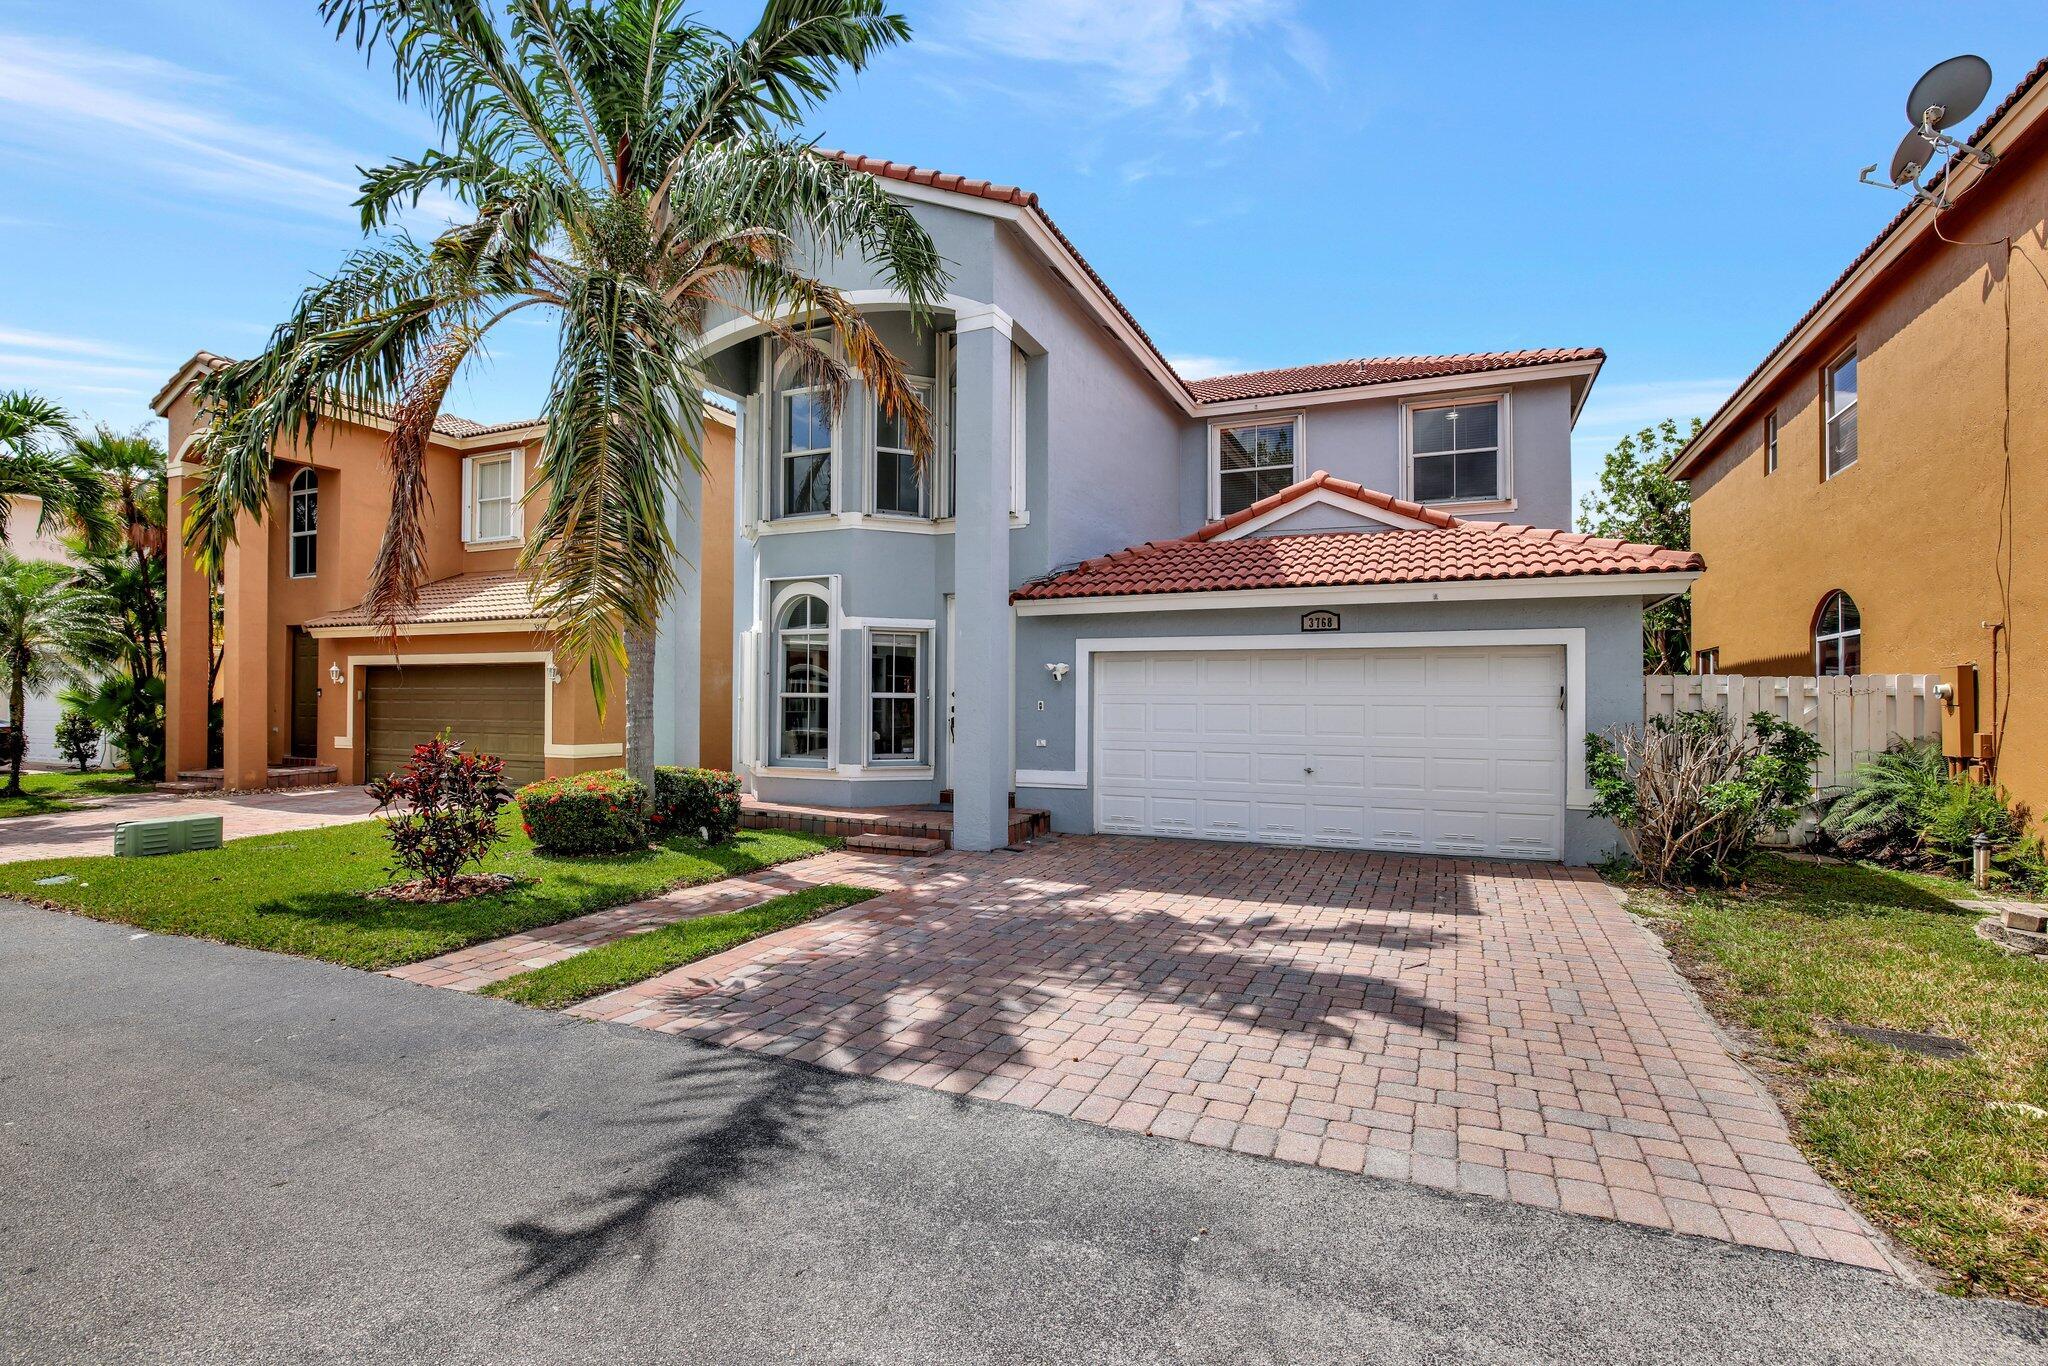
$743,000
4
bds
|
3
ba
|
2,184
sqft
|
built
2002
3768 SW 50th Ct, Fort Lauderdale, FL 33312
$-1,384
Cash flow
-9.7%
Cash-on-Cash Return
3.9%
Cap rate
0.6%
Rent to Value Ratio
Active
$699,000
2
bds
|
2
ba
|
1,450
sqft
|
built
1967
4300 N Ocean Blvd, Fort Lauderdale, FL 33308
$-1,636
Cash flow
-12.2%
Cash-on-Cash Return
3.3%
Cap rate
0.8%
Rent to Value Ratio
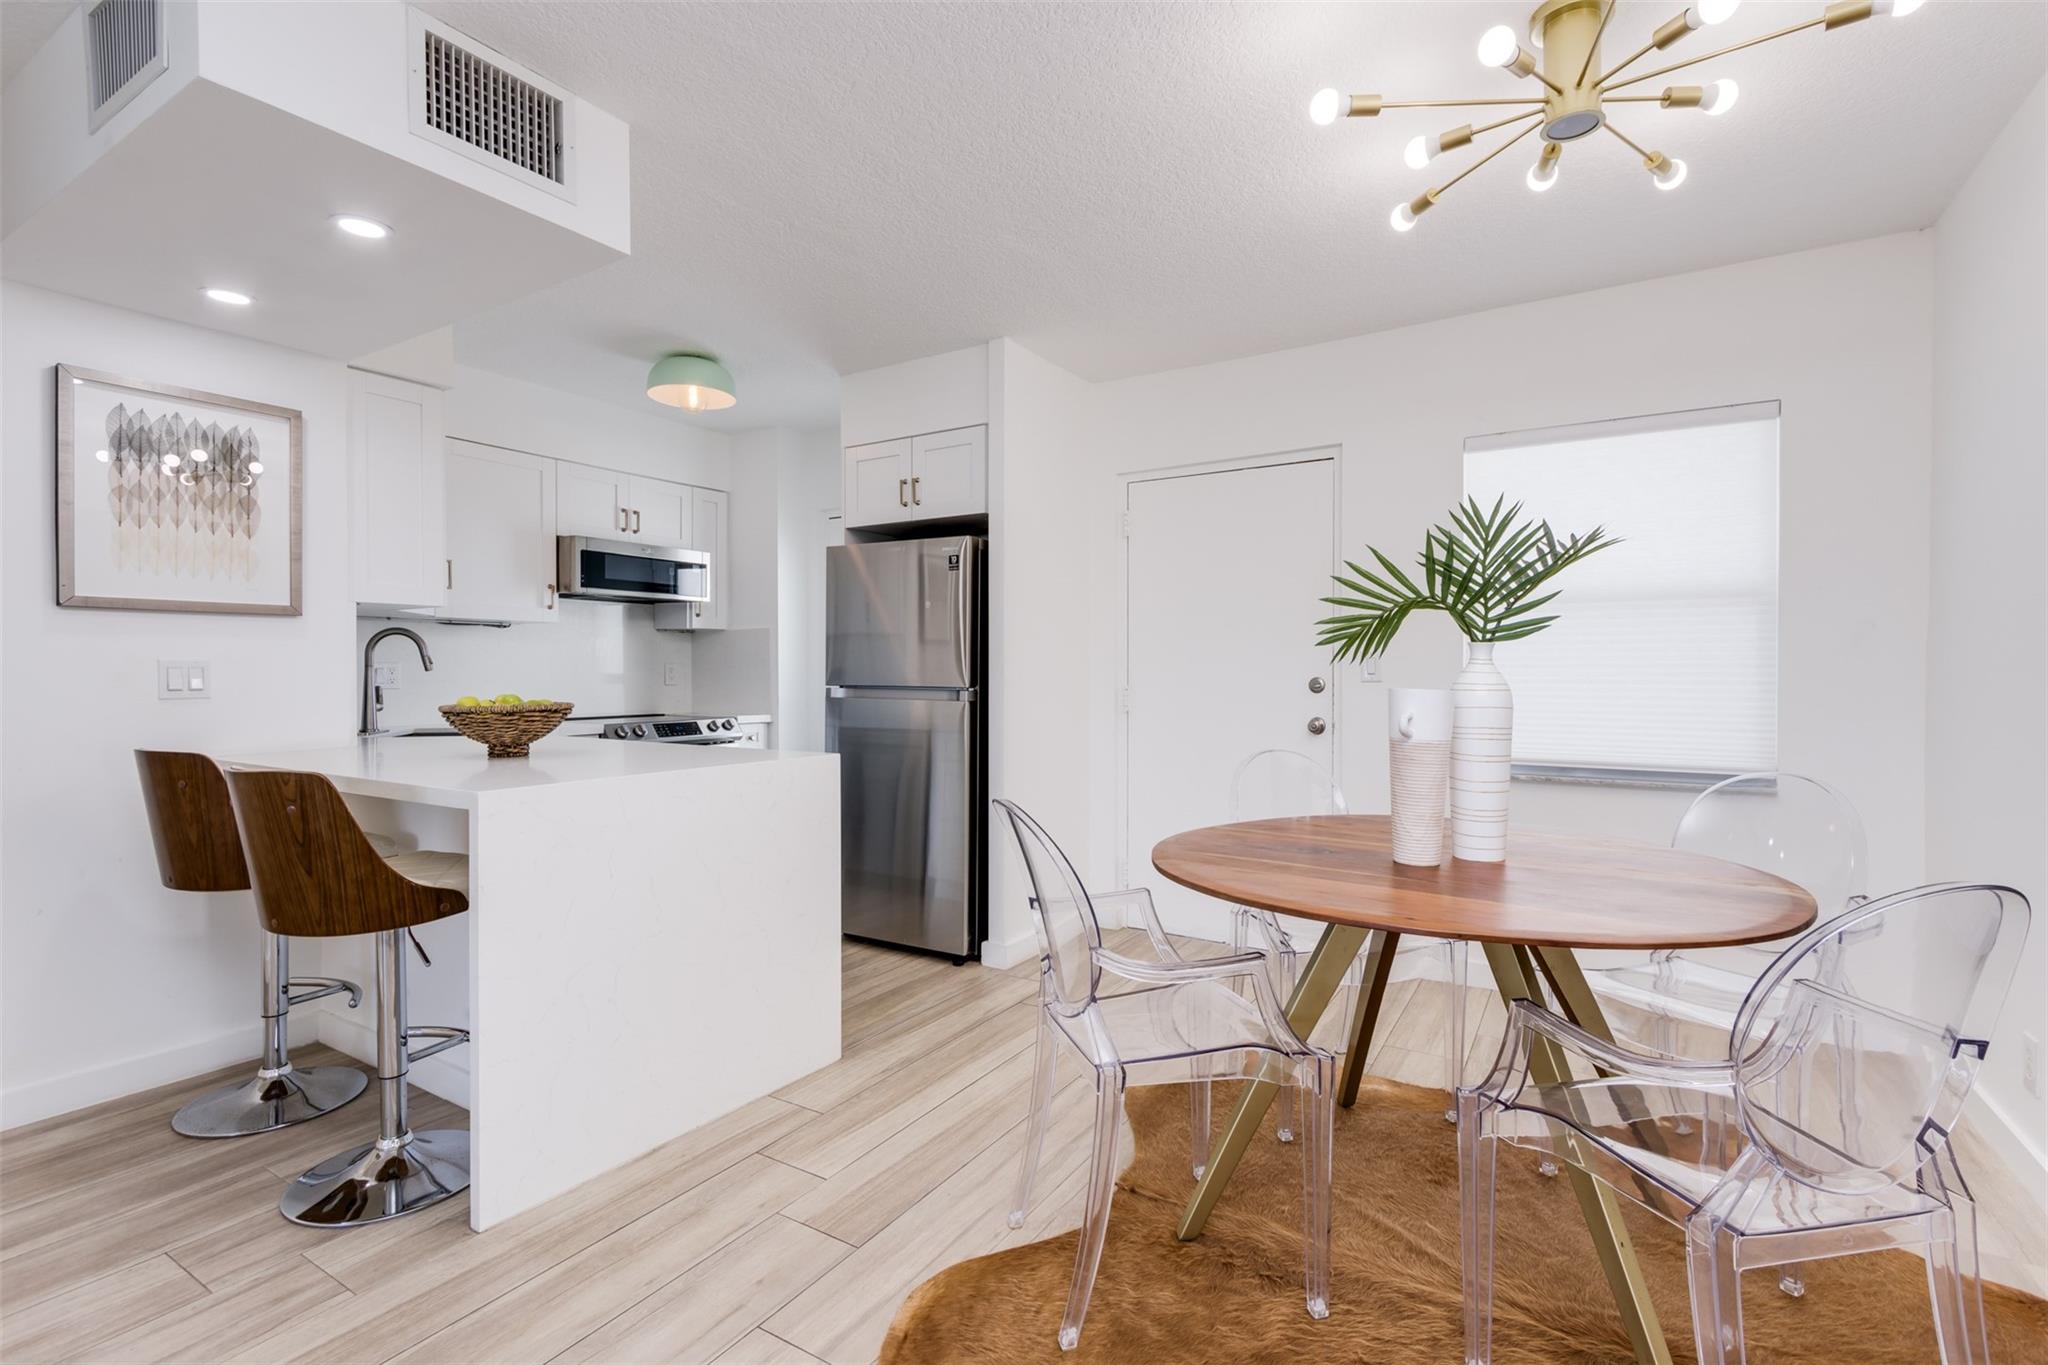
Active
$329,000
1
bds
|
1
ba
|
940
sqft
|
built
1980
2555 NE 11th St, Fort Lauderdale, FL 33304
$-361
Cash flow
-5.7%
Cash-on-Cash Return
4.8%
Cap rate
0.7%
Rent to Value Ratio
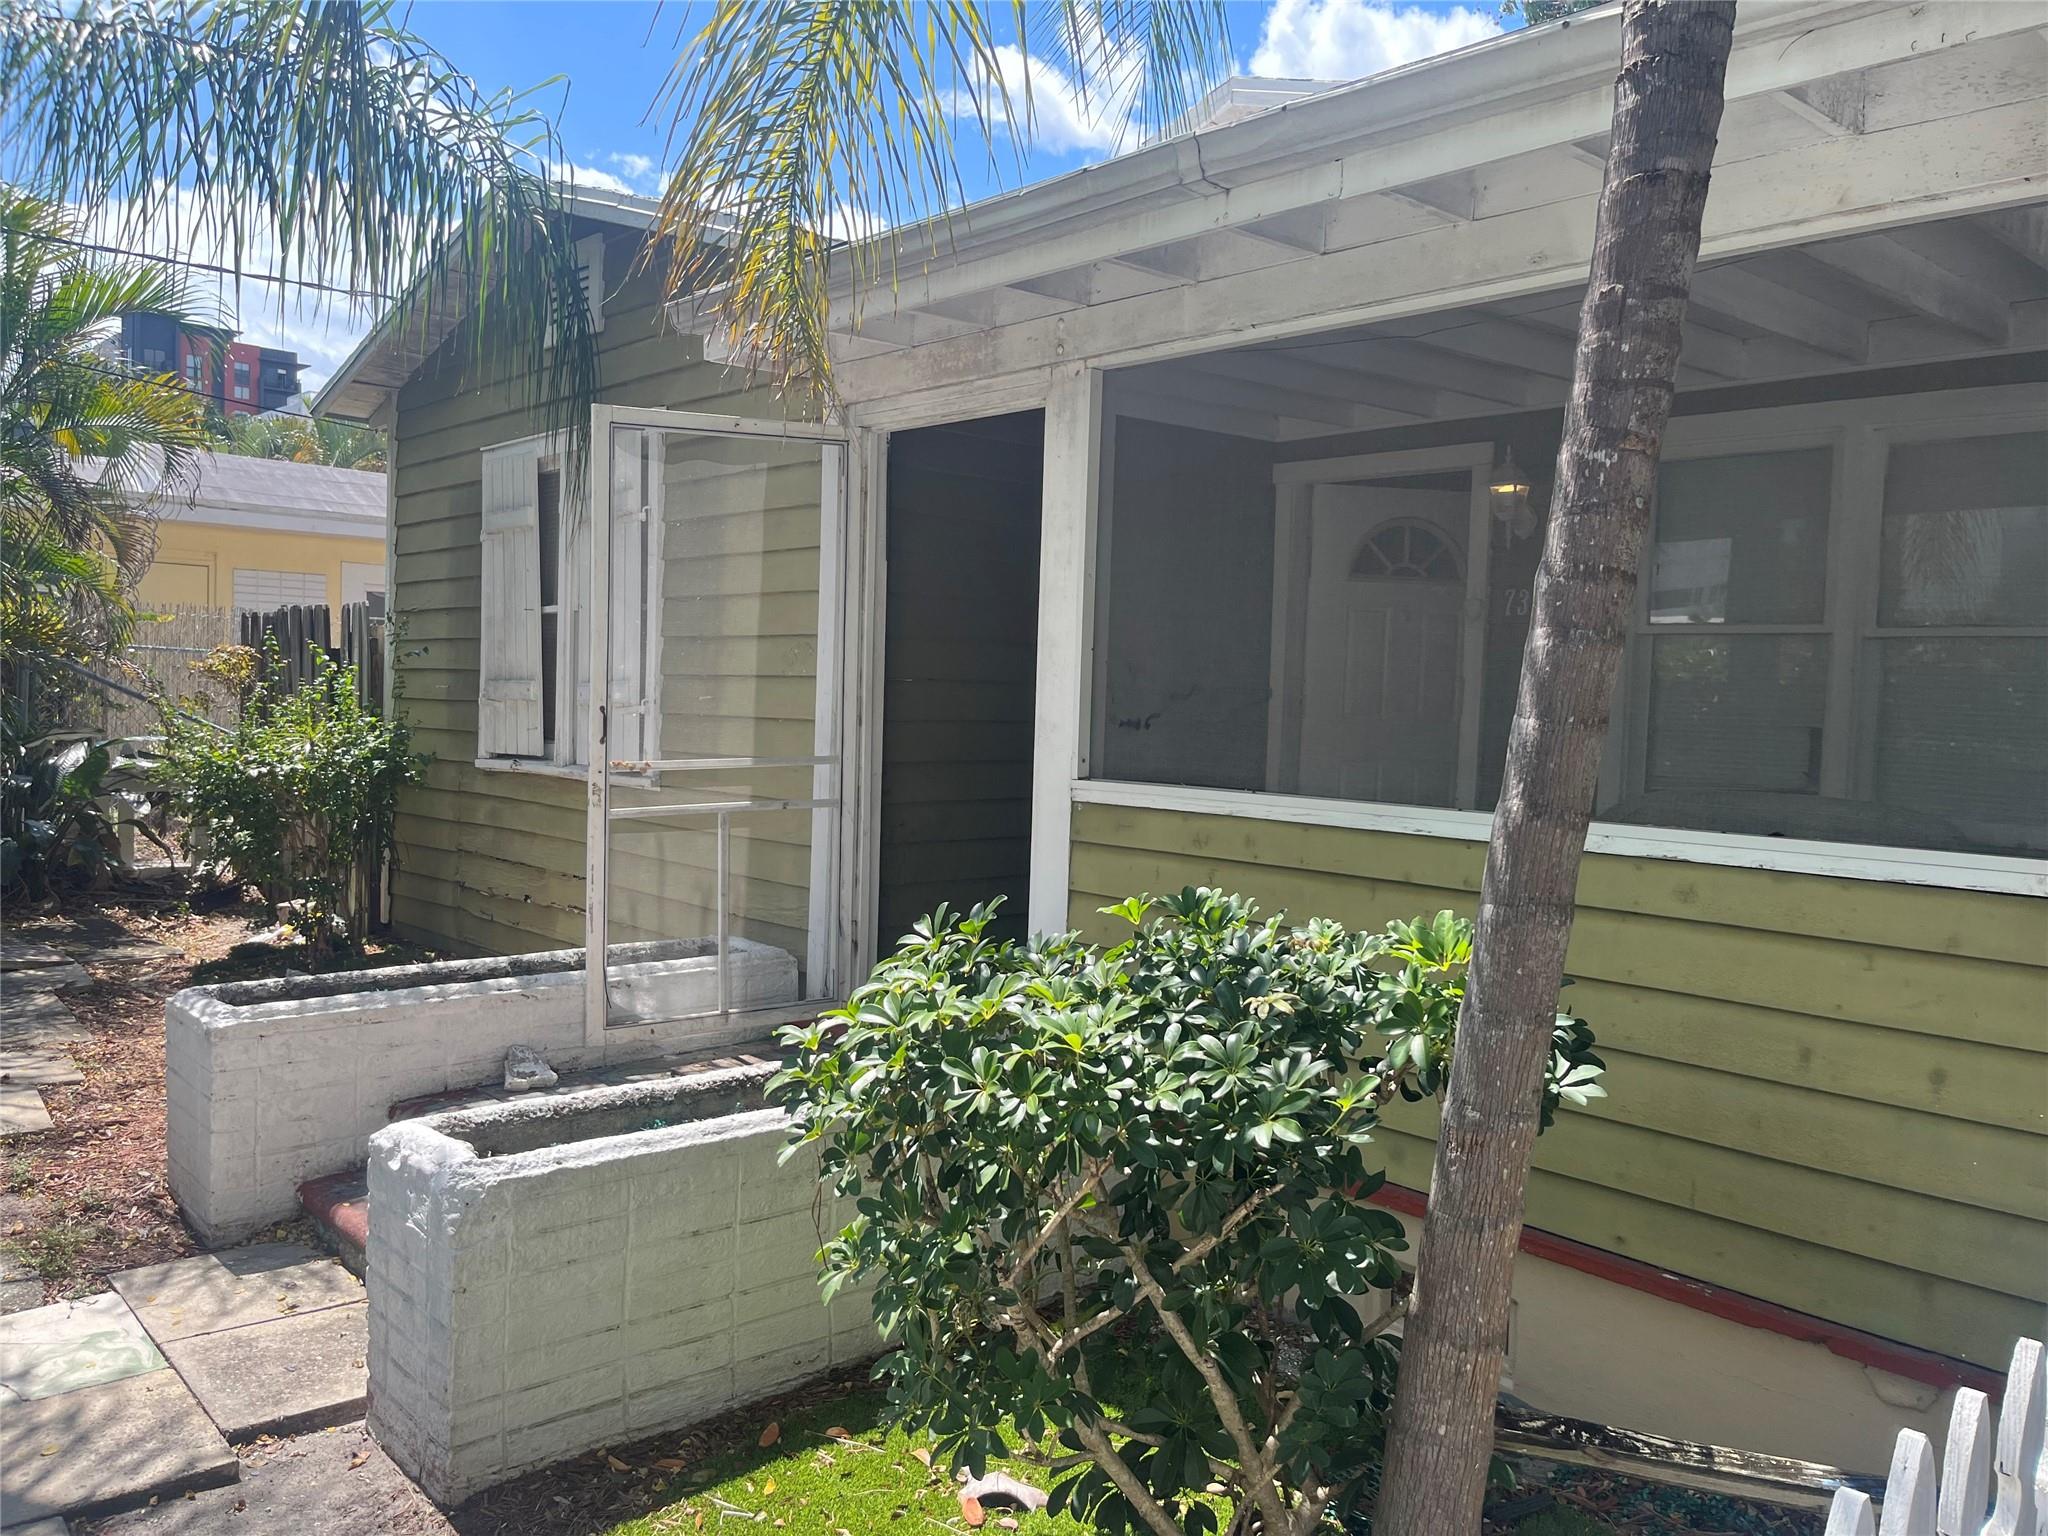
Active
$799,000
2
bds
|
2
ba
|
1,456
sqft
|
built
1946
739 NE 5th Ave, Fort Lauderdale, FL 33304
$-2,404
Cash flow
-15.7%
Cash-on-Cash Return
2.5%
Cap rate
0.4%
Rent to Value Ratio
Active
$325,000
2
bds
|
2
ba
|
870
sqft
|
built
1974
3105 NE 28th St, Fort Lauderdale, FL 33308
$-1,375
Cash flow
-22.1%
Cash-on-Cash Return
1.1%
Cap rate
0.8%
Rent to Value Ratio
Active
$299,000
2
bds
|
2
ba
|
814
sqft
|
built
1973
1731 SE 15th St, Fort Lauderdale, FL 33316
$-247
Cash flow
-4.3%
Cash-on-Cash Return
5.2%
Cap rate
0.8%
Rent to Value Ratio
Active
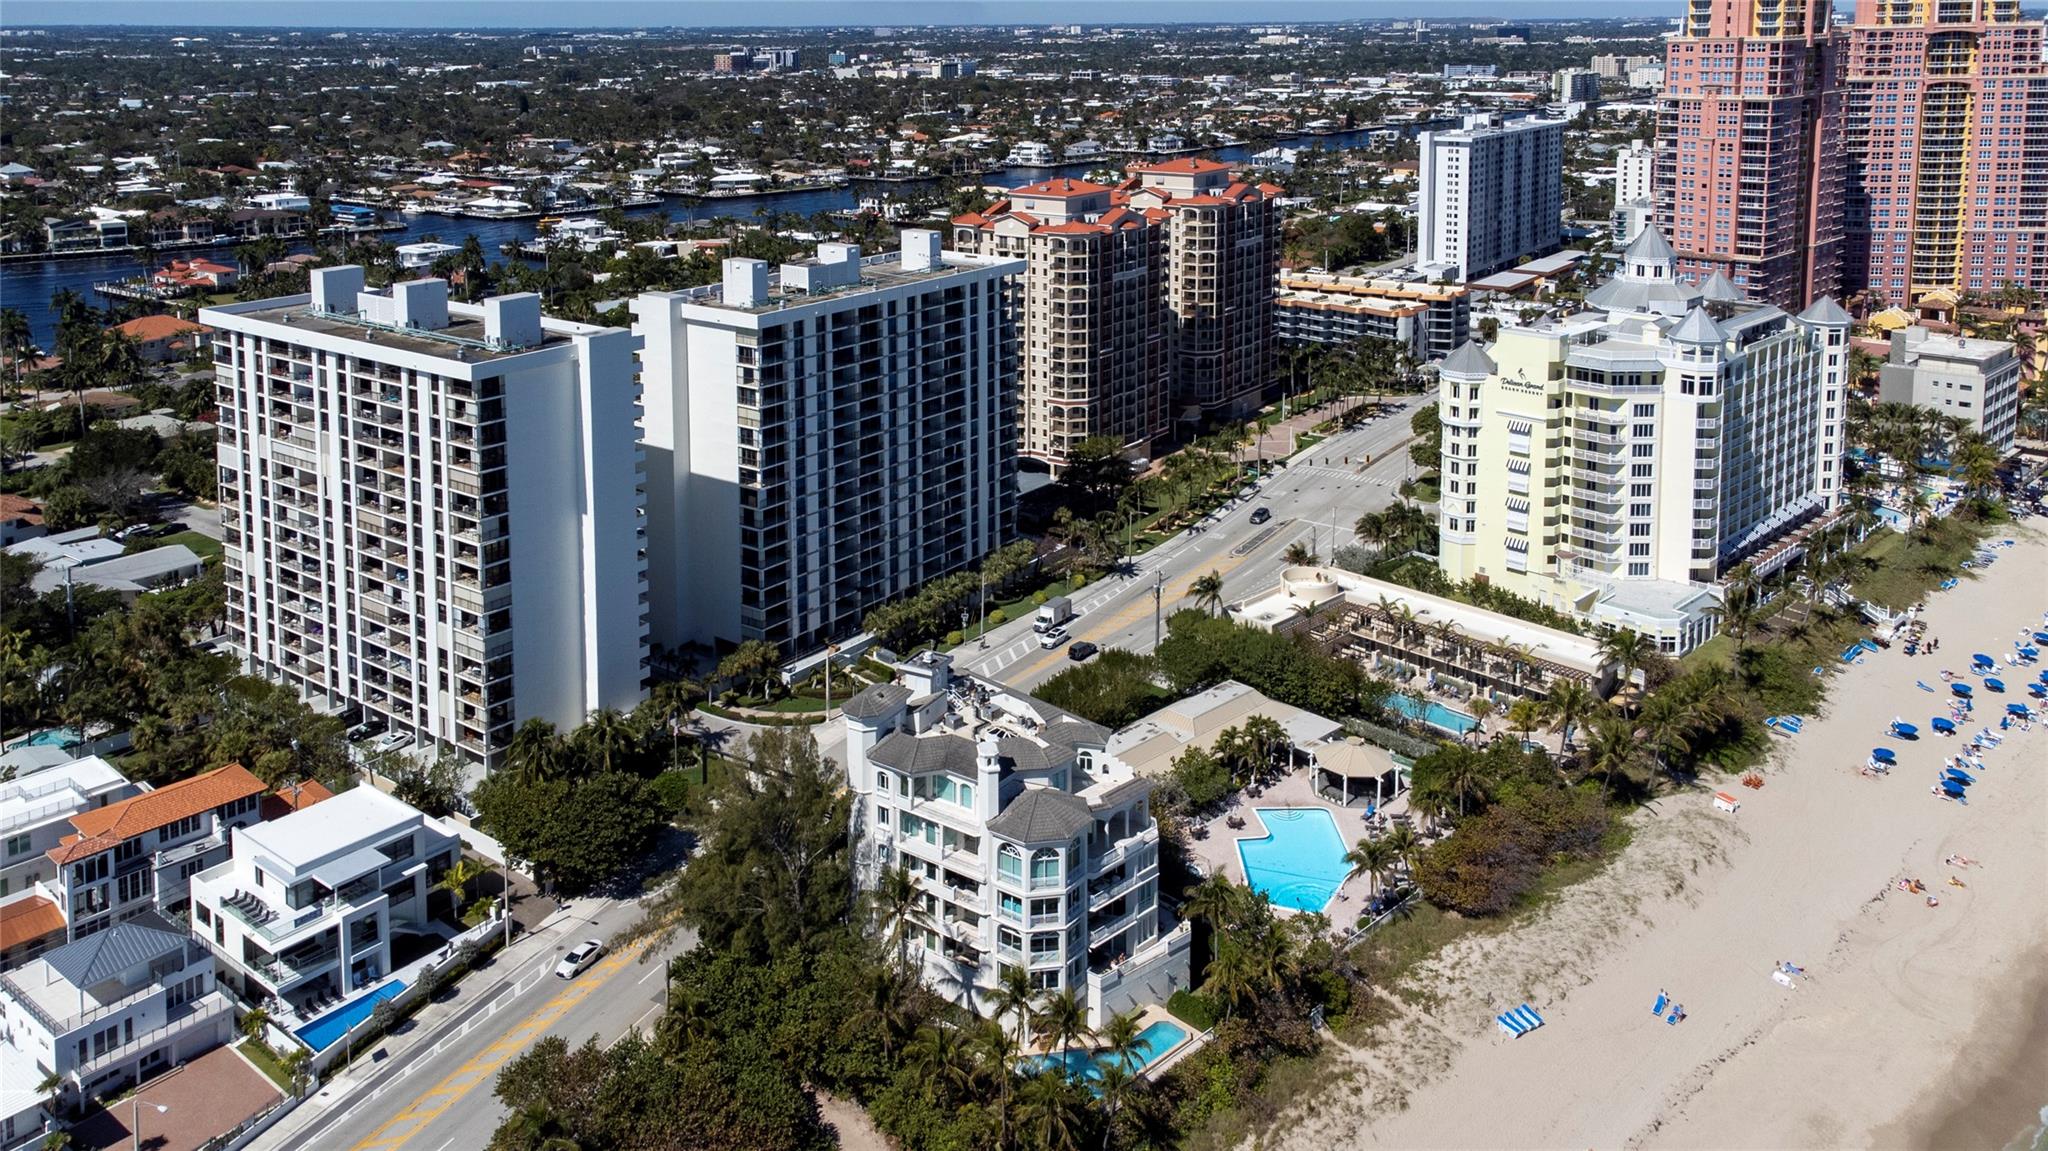
$475,000
1
bds
|
1
ba
|
900
sqft
|
built
1965
2100 S Ocean Dr, Fort Lauderdale, FL 33316
$-1,868
Cash flow
-20.5%
Cash-on-Cash Return
1.4%
Cap rate
0.7%
Rent to Value Ratio
Active
$1,845,000
3
bds
|
4
ba
|
2,195
sqft
|
built
2017
701 N Fort Lauderdale Beach Blvd, Fort Lauderdale, FL 33304
$-207,437
Cash flow
-586.6%
Cash-on-Cash Return
-128.8%
Cap rate
0.5%
Rent to Value Ratio
Active
$529,900
2
bds
|
2
ba
|
1,596
sqft
|
built
1971
4020 Galt Ocean Dr, Fort Lauderdale, FL 33308
$-1,986
Cash flow
-19.6%
Cash-on-Cash Return
1.6%
Cap rate
0.7%
Rent to Value Ratio
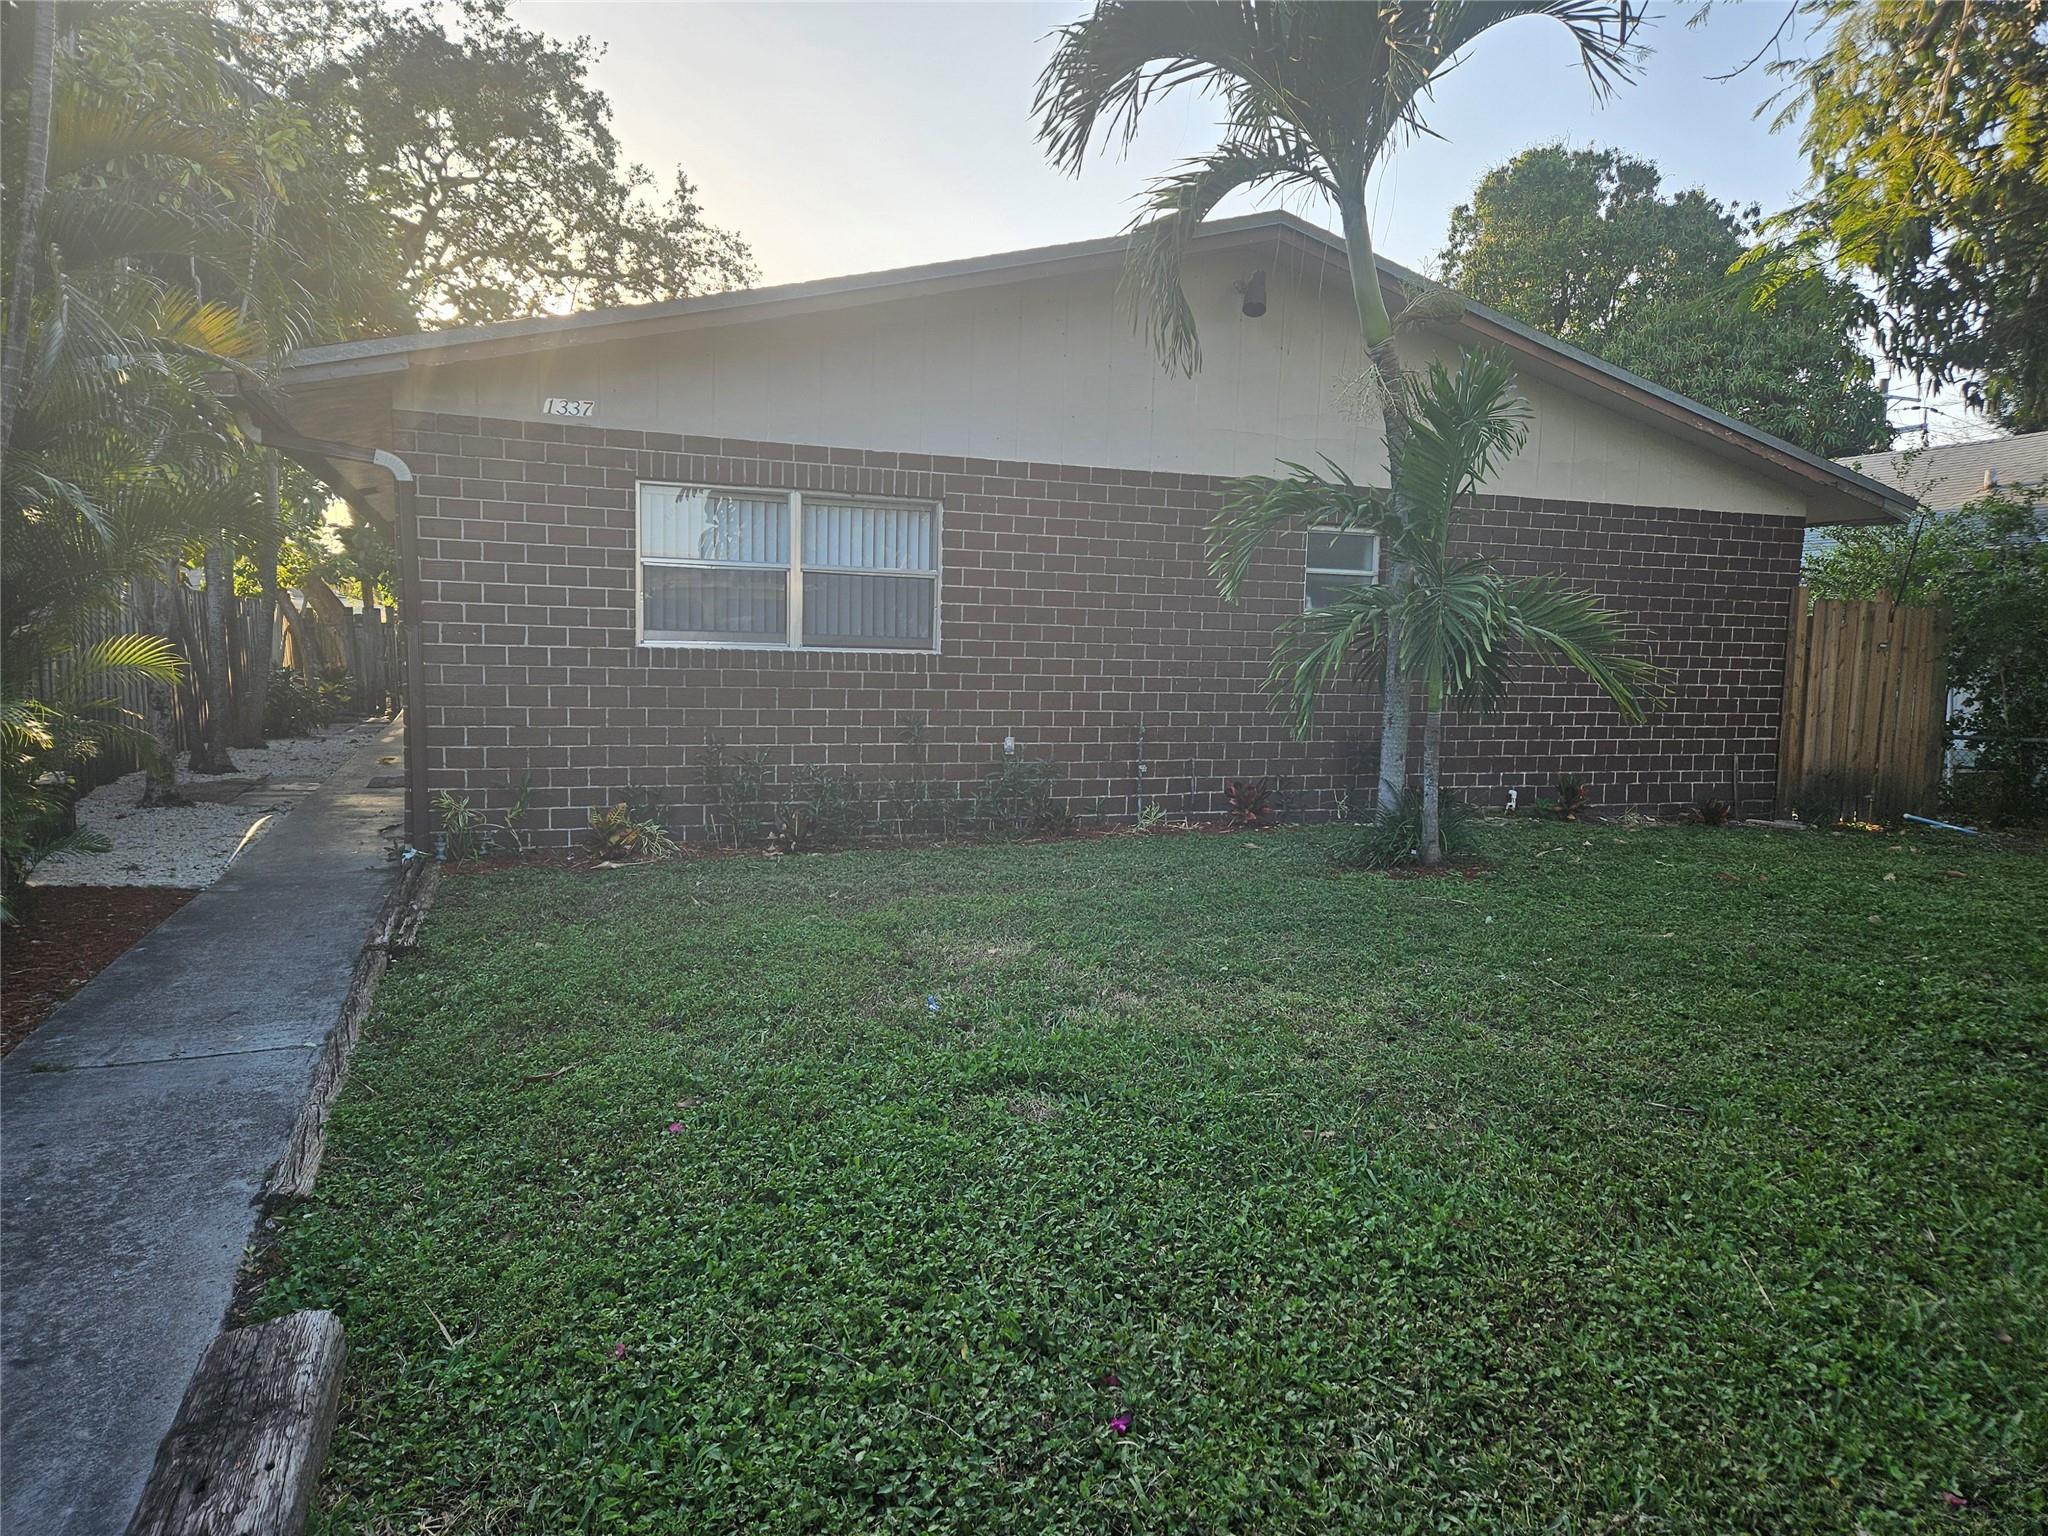
Active
$699,000
bds
|
0
ba
|
2,006
sqft
|
built
1976
1337 NW 3rd Ave, Fort Lauderdale, FL 33311
$-2,744
Cash flow
-20.5%
Cash-on-Cash Return
1.4%
Cap rate
0.3%
Rent to Value Ratio
Active under contract
$8,500,000
6
bds
|
9
ba
|
6,464
sqft
|
built
2020
633 Coral Way, Fort Lauderdale, FL 33301
$-45,005
Cash flow
-27.6%
Cash-on-Cash Return
-0.2%
Cap rate
0.1%
Rent to Value Ratio

Active
$1,160,000
2
bds
|
3
ba
|
1,869
sqft
|
built
2004
333 Las Olas Way, Fort Lauderdale, FL 33301
$-3,958
Cash flow
-17.8%
Cash-on-Cash Return
2.1%
Cap rate
0.6%
Rent to Value Ratio
Active
$425,000
2
bds
|
2
ba
|
1,218
sqft
|
built
1971
340 Sunset Dr, Fort Lauderdale, FL 33301
$-1,623
Cash flow
-19.9%
Cash-on-Cash Return
1.6%
Cap rate
0.7%
Rent to Value Ratio
Active
$1,395,000
3
bds
|
4
ba
|
2,097
sqft
|
built
2020
3030 N Ocean Blvd, Fort Lauderdale, FL 33308
$-4,430
Cash flow
-16.6%
Cash-on-Cash Return
2.3%
Cap rate
0.7%
Rent to Value Ratio
Active
$620,000
bds
|
0
ba
|
1,713
sqft
|
built
1958
2041 NE 56th St, Fort Lauderdale, FL 33308
$-2,607
Cash flow
-21.9%
Cash-on-Cash Return
1.1%
Cap rate
0.3%
Rent to Value Ratio
Active
$3,385,000
3
bds
|
4
ba
|
0
sqft
|
built
1953
404 Coconut Isle Dr, Fort Lauderdale, FL 33301
$-14,823
Cash flow
-22.8%
Cash-on-Cash Return
0.9%
Cap rate
0.3%
Rent to Value Ratio
Active
$419,900
2
bds
|
2
ba
|
1,262
sqft
|
built
1967
2500 NE 48th Ln, Fort Lauderdale, FL 33308
$-1,351
Cash flow
-16.8%
Cash-on-Cash Return
2.3%
Cap rate
0.7%
Rent to Value Ratio
Active
$235,000
2
bds
|
2
ba
|
1,008
sqft
|
built
1972
630 Tennis Club Dr, Fort Lauderdale, FL 33311
$-222
Cash flow
-4.9%
Cash-on-Cash Return
5.0%
Cap rate
1.3%
Rent to Value Ratio
Active
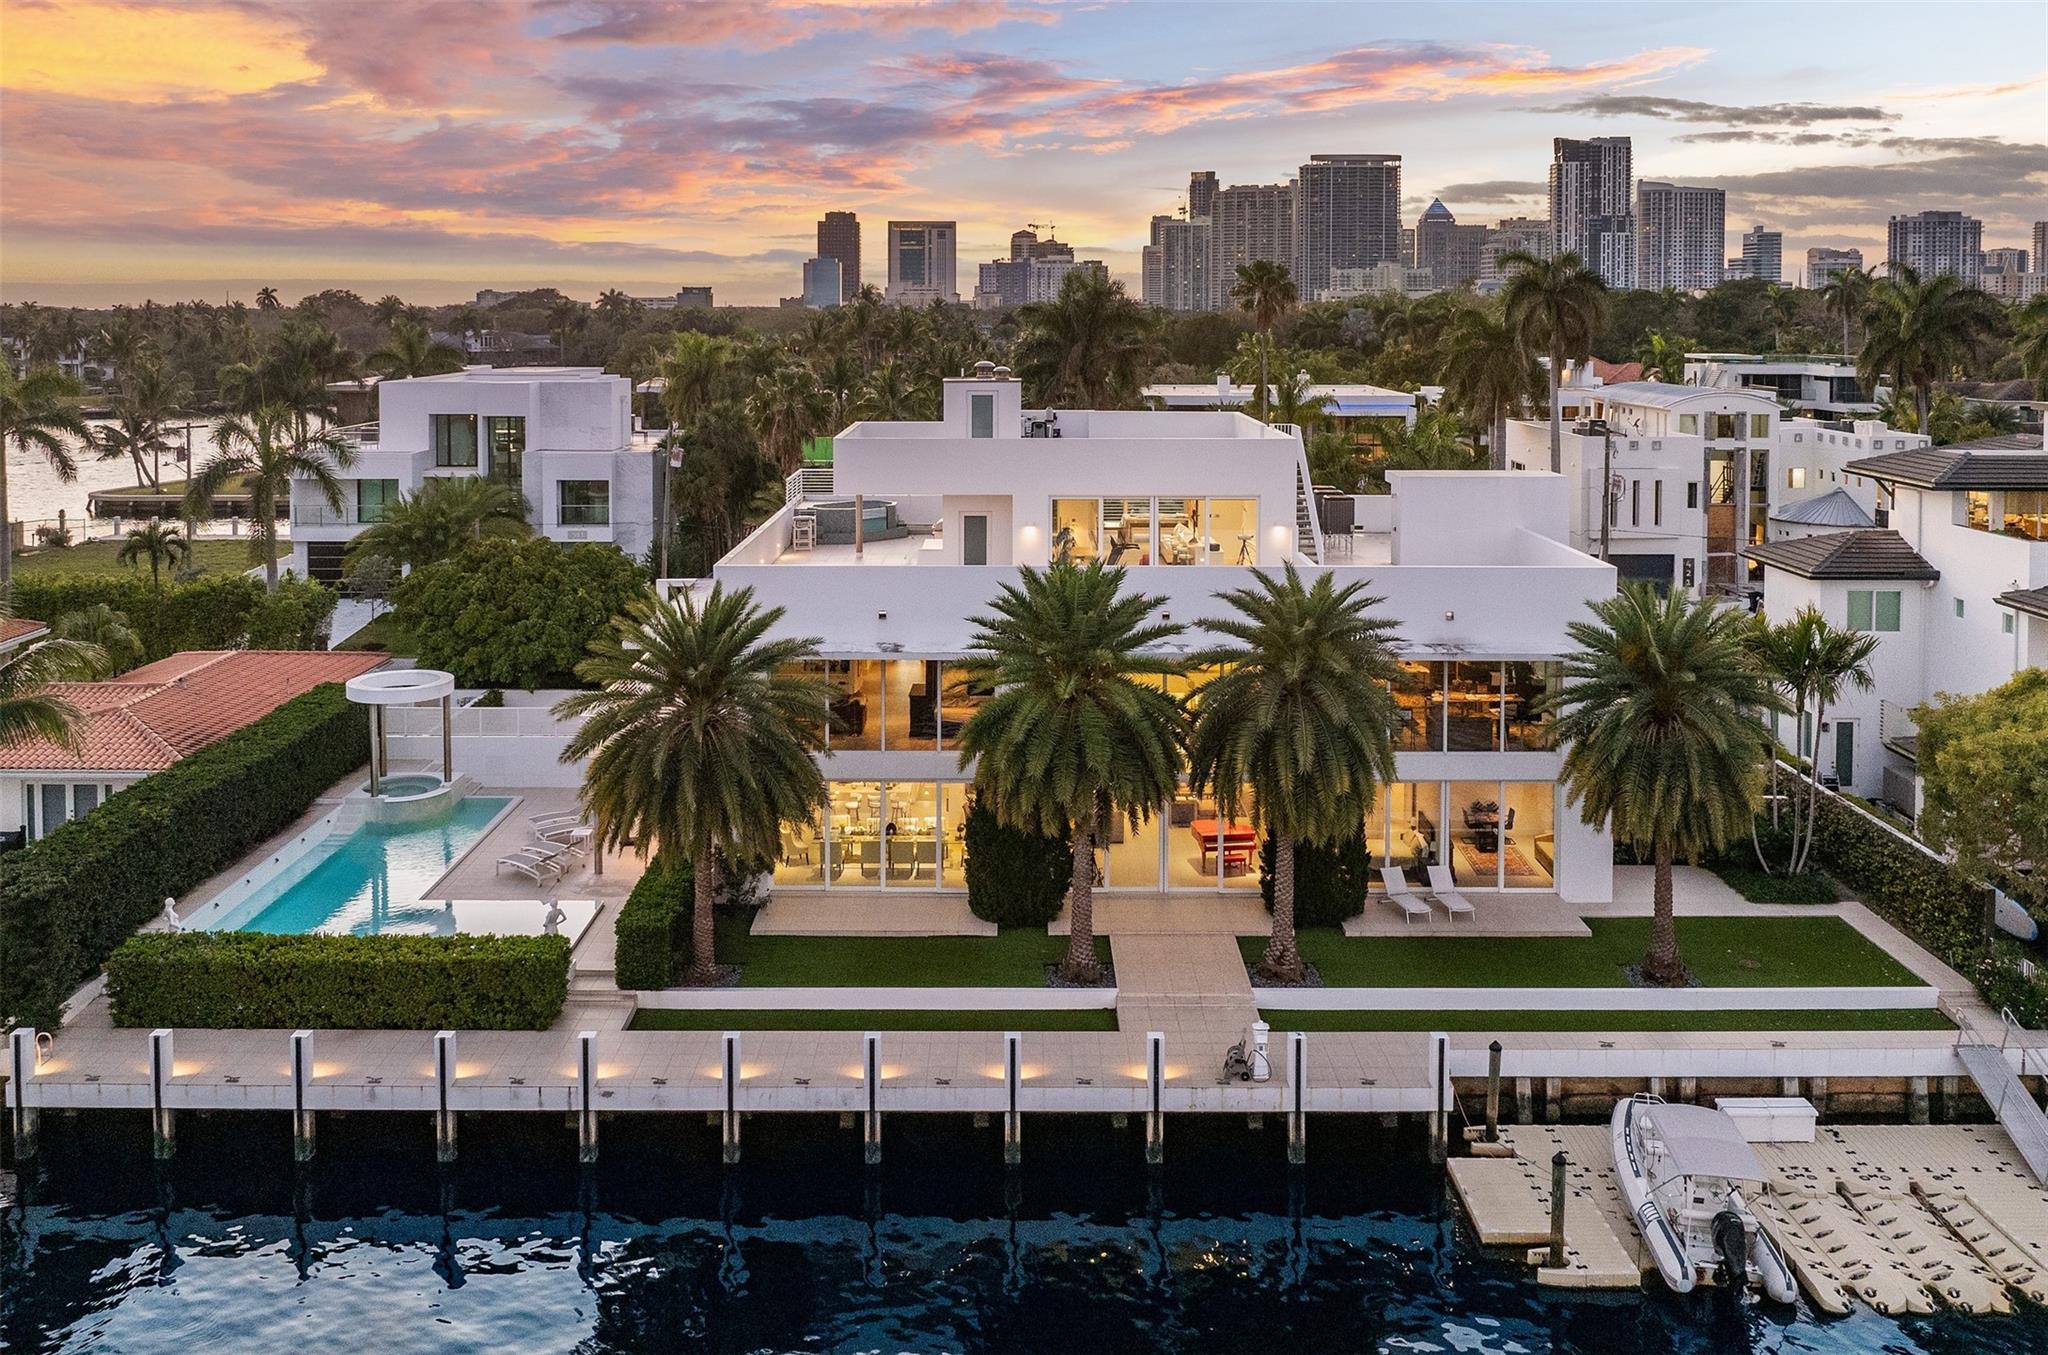
$25,000,000
6
bds
|
8
ba
|
10,216
sqft
|
built
1998
2 Pelican Dr, Fort Lauderdale, FL 33301
$-146,284
Cash flow
-30.5%
Cash-on-Cash Return
-0.9%
Cap rate
0.0%
Rent to Value Ratio
Active
$12,900,000
6
bds
|
8
ba
|
7,788
sqft
|
built
2015
500 Isle Of Capri Dr, Fort Lauderdale, FL 33301
$-66,283
Cash flow
-26.8%
Cash-on-Cash Return
0.0%
Cap rate
0.1%
Rent to Value Ratio
Active
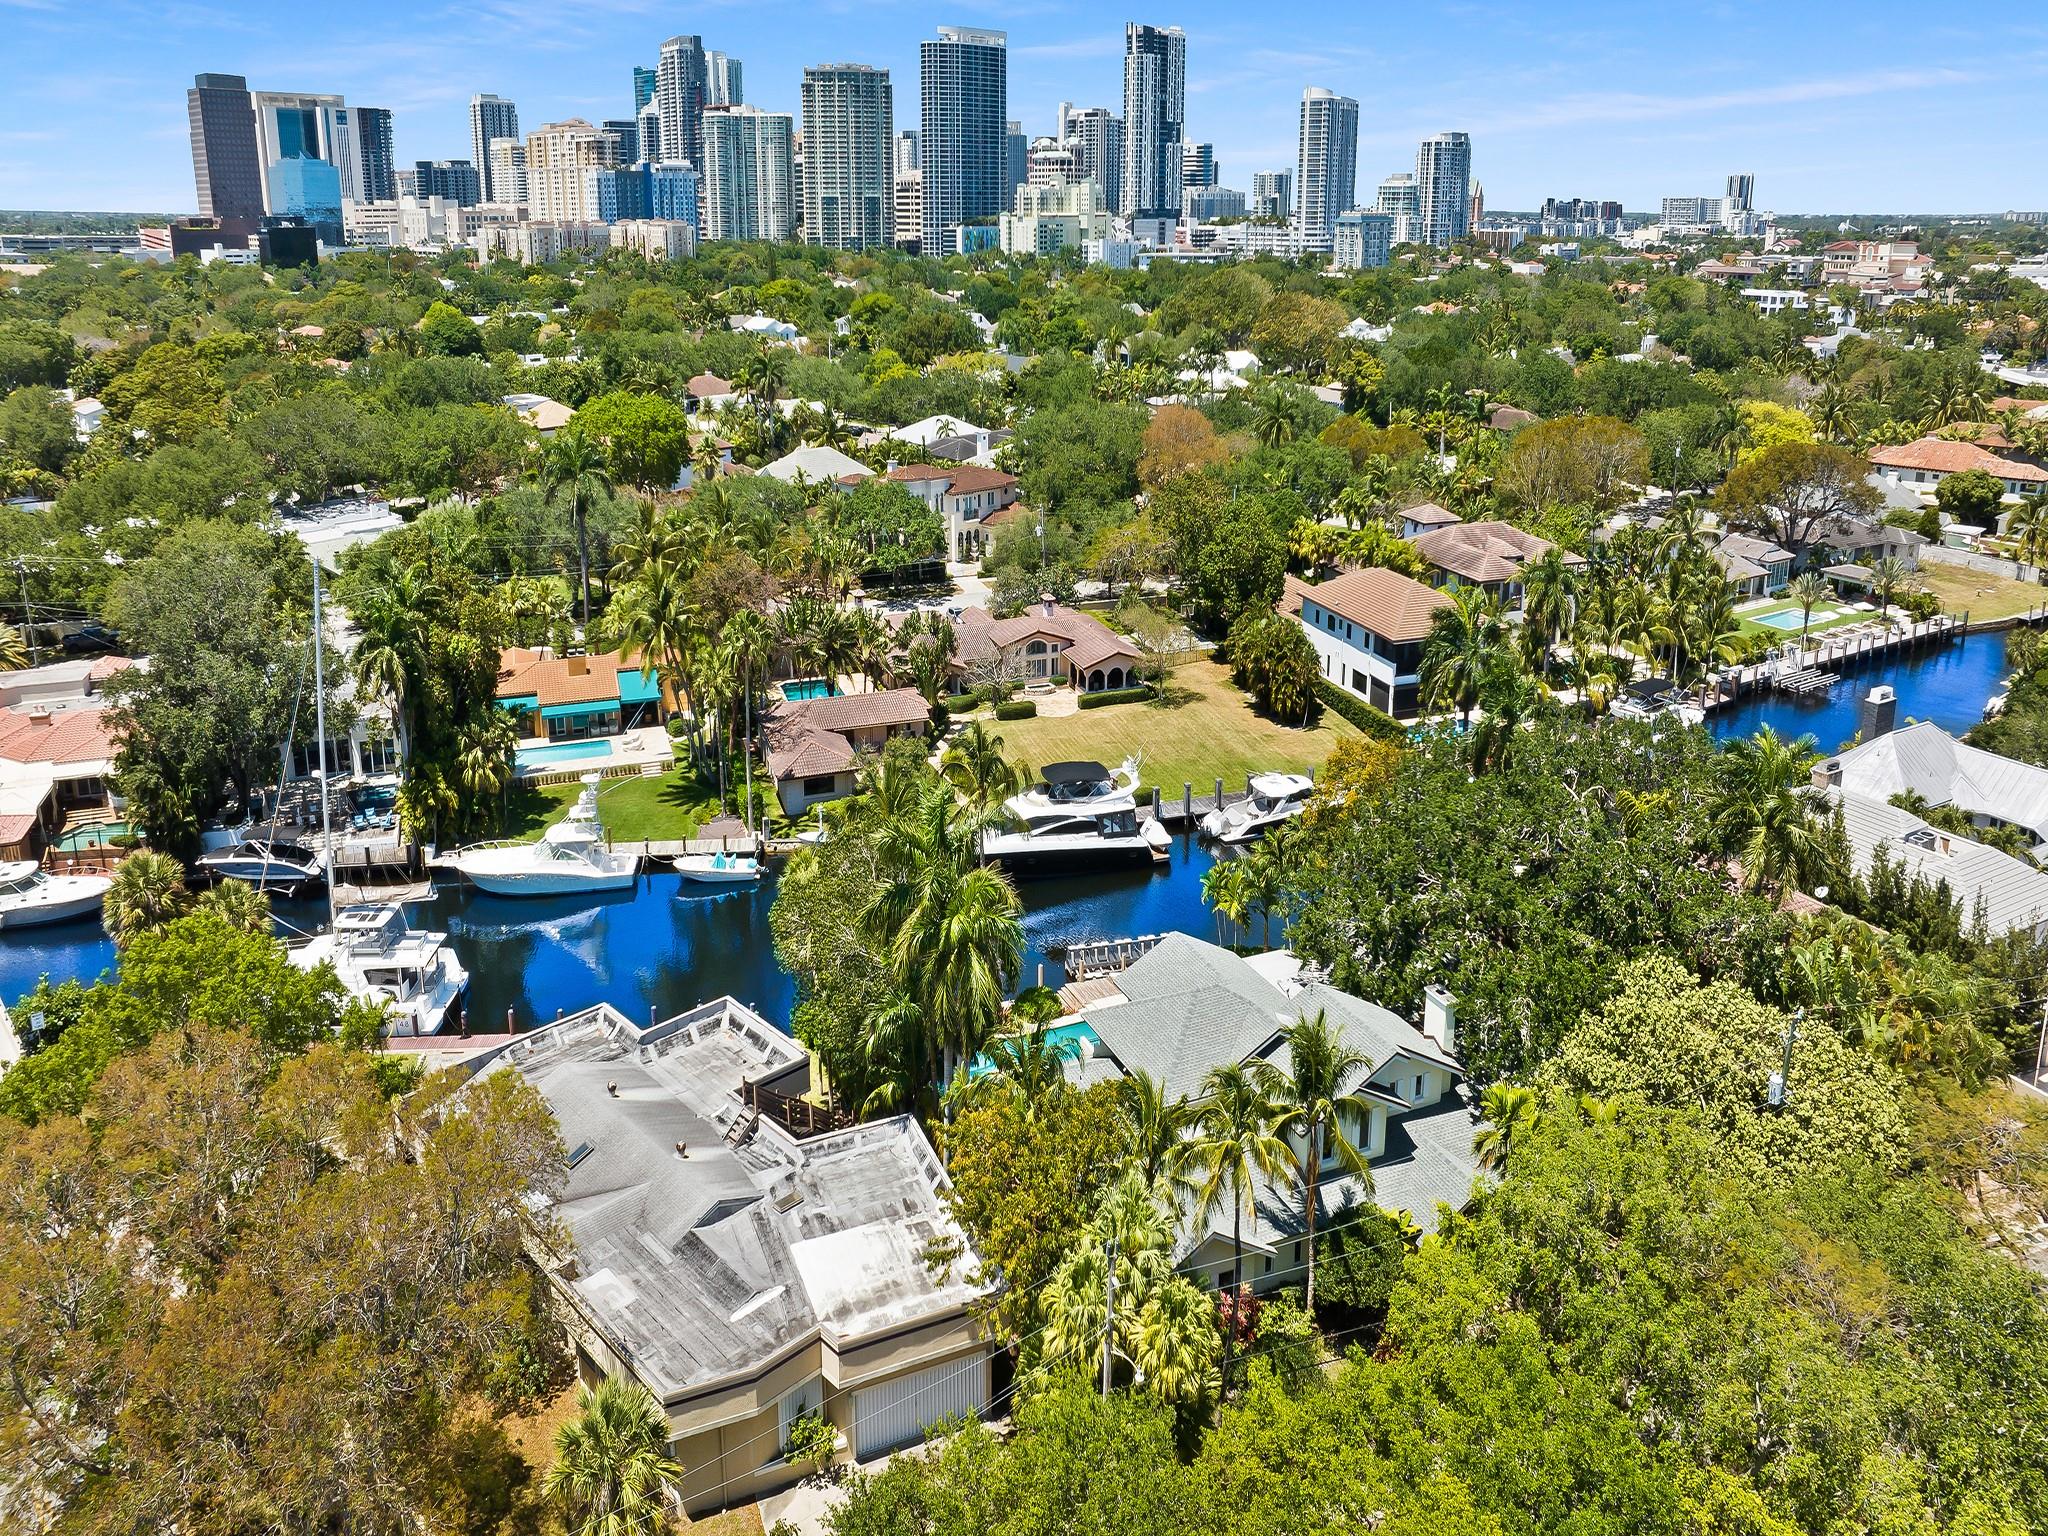
$4,495,000
4
bds
|
4
ba
|
2,930
sqft
|
built
1949
1401 SE 9th St, Fort Lauderdale, FL 33316
$-18,390
Cash flow
-21.3%
Cash-on-Cash Return
1.2%
Cap rate
0.2%
Rent to Value Ratio
Active
$550,000
2
bds
|
2
ba
|
1,500
sqft
|
built
1976
1905 N Ocean Blvd, Fort Lauderdale, FL 33305
$-2,140
Cash flow
-20.3%
Cash-on-Cash Return
1.5%
Cap rate
0.7%
Rent to Value Ratio
Active
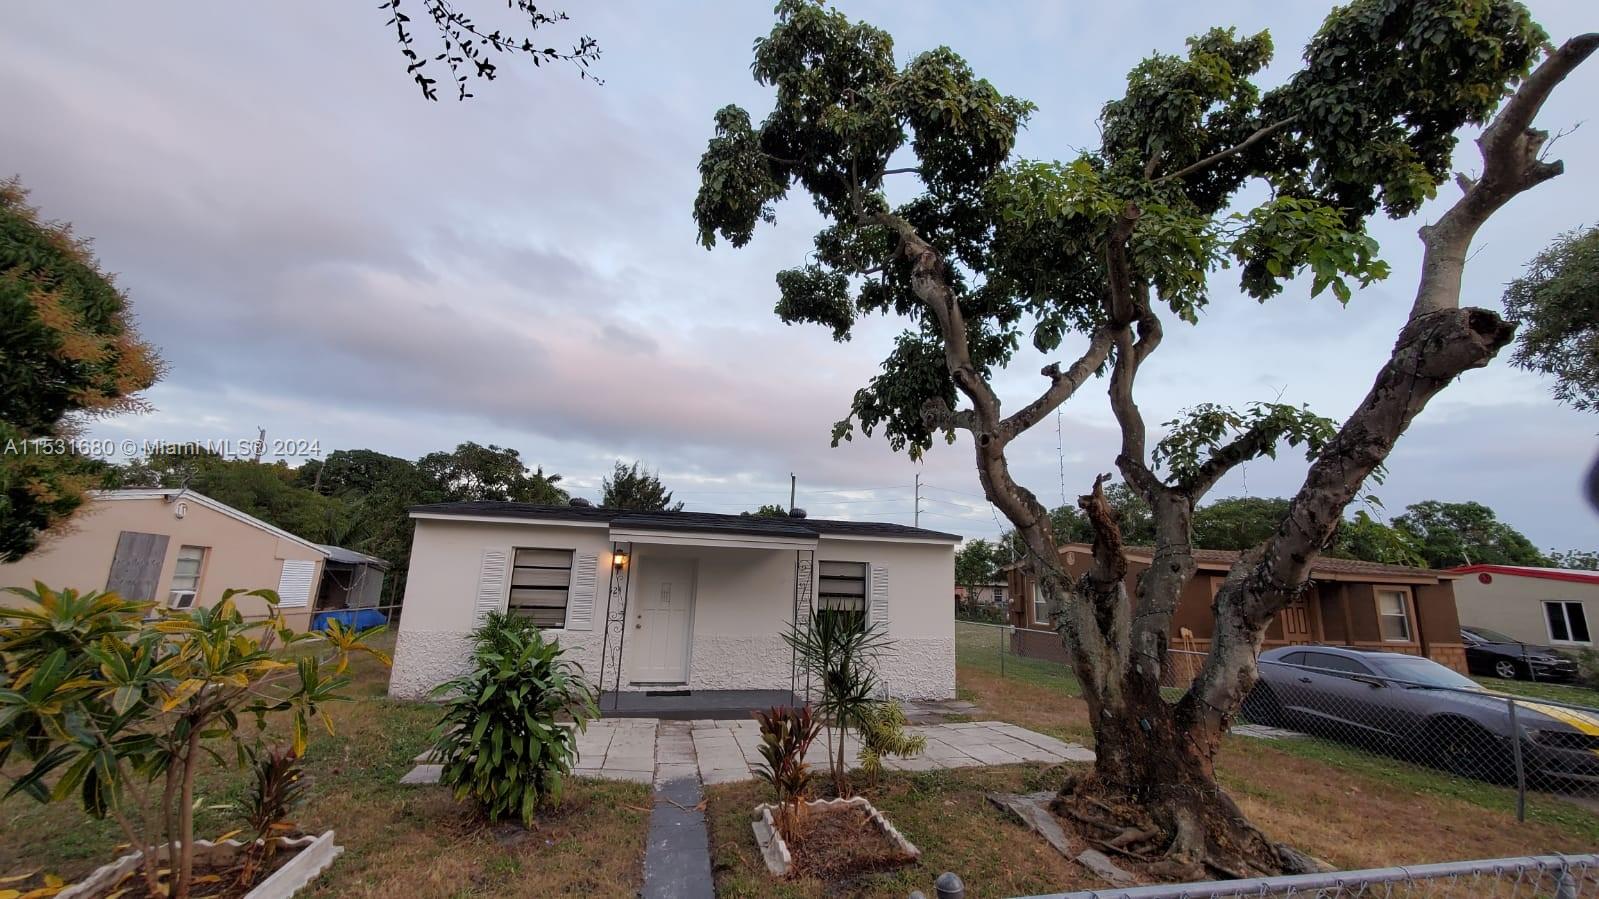
$374,989
3
bds
|
1
ba
|
870
sqft
|
built
1954
524 NW 21st Ave, Fort Lauderdale, FL 33311
$-686
Cash flow
-9.5%
Cash-on-Cash Return
4.0%
Cap rate
0.6%
Rent to Value Ratio

Active
$2,150,000
5
bds
|
5
ba
|
0
sqft
|
built
2024
3523 Forest View Cir, Fort Lauderdale, FL 33312
$-4,162
Cash flow
-10.1%
Cash-on-Cash Return
3.8%
Cap rate
0.5%
Rent to Value Ratio