Fulton County Investment Properties for Sale
Browse homes for sale and investment properties in Fulton County. Refine your search by price, property type, or more.
Best cash flowing properties in Fulton County
Active
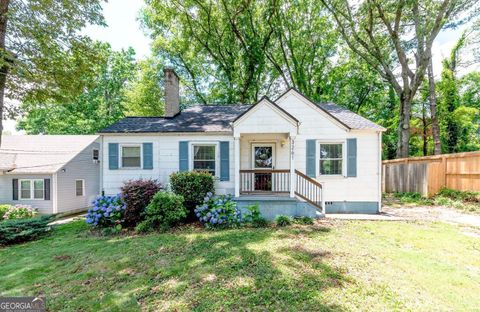
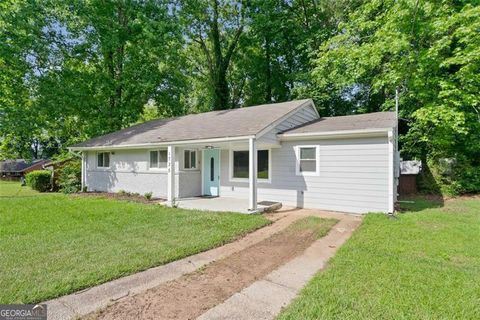
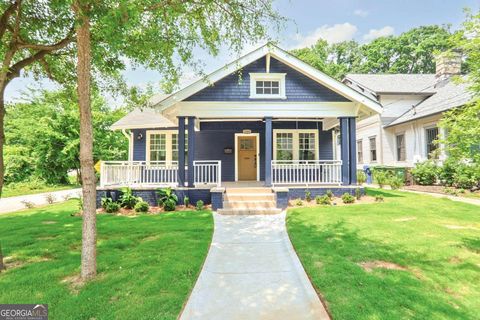
$200,000
2
bds
|
1.5
ba
|
1,586
sqft
|
built
1950
3261 N Fulton Ave, Atlanta, GA 30354
$135
Cash flow
3.5%
Cash-on-Cash Return
7.0%
Cap rate
1.0%
Rent to Value Ratio
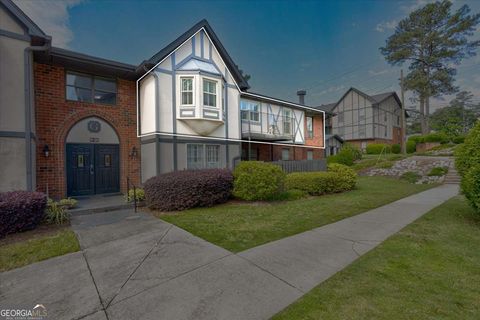
Active
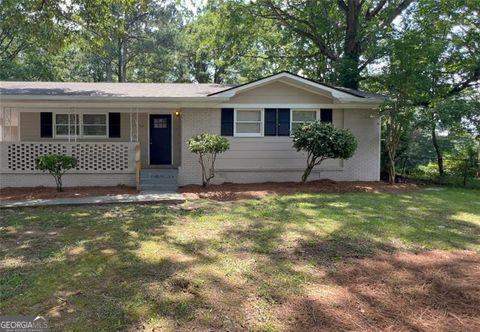
$180,000
3
bds
|
2
ba
|
1,180
sqft
|
built
1967
1026 Eisenhower Ct SE, Atlanta, GA 30354
$112
Cash flow
3.2%
Cash-on-Cash Return
6.9%
Cap rate
1.0%
Rent to Value Ratio
2,648 out of 3,260 properties for sale in Fulton County
Limited Results Shown
Create a free account, or log in to reveal all property listings and enjoy the complete experience.
Active
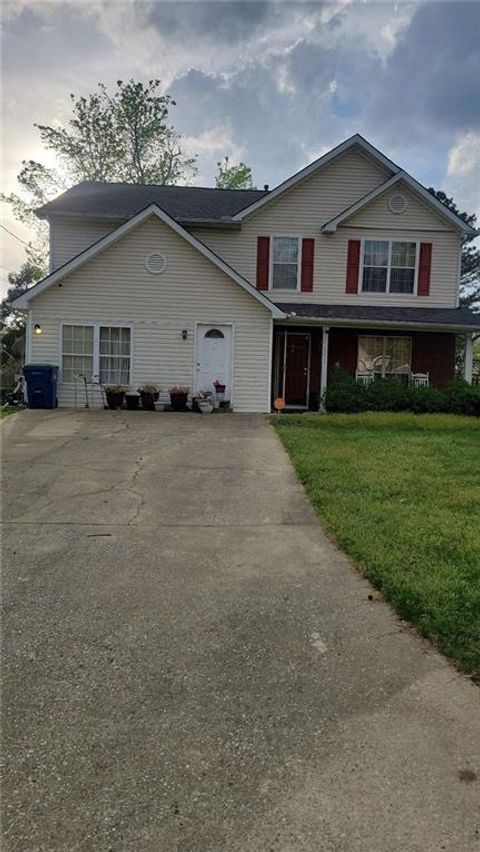
$240,000
4
bds
|
3
ba
|
2,684
sqft
|
built
1994
6265 Gemstone Ct, Atlanta, GA 30349
$-75
Cash flow
-1.6%
Cash-on-Cash Return
5.8%
Cap rate
0.8%
Rent to Value Ratio
Active
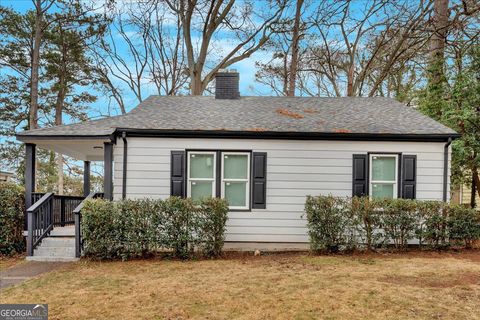
$299,000
4
bds
|
2.5
ba
|
1,160
sqft
|
built
1940
1222 E Forrest Ave, East Point, GA 30344
$-4
Cash flow
-0.1%
Cash-on-Cash Return
6.1%
Cap rate
0.8%
Rent to Value Ratio
Active
$274,900
3
bds
|
2
ba
|
1,450
sqft
|
built
1952
1735 Carter Cir, East Point, GA 30344
$-184
Cash flow
-3.5%
Cash-on-Cash Return
5.3%
Cap rate
0.7%
Rent to Value Ratio
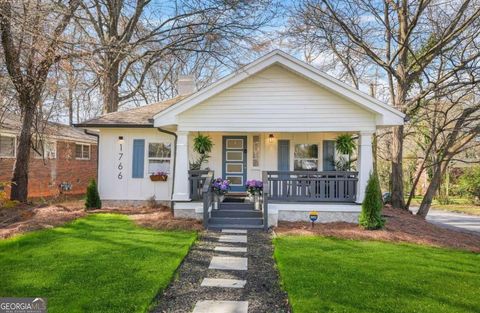
Active
$300,000
3
bds
|
2
ba
|
1,178
sqft
|
built
1930
1766 Ware Ave, East Point, GA 30344
$-440
Cash flow
-7.7%
Cash-on-Cash Return
4.4%
Cap rate
0.6%
Rent to Value Ratio
Active
$515,000
3
bds
|
4
ba
|
2,017
sqft
|
built
2022
1947 Thomasville Estate Dr, Atlanta, GA 30315
$-1,150
Cash flow
-11.7%
Cash-on-Cash Return
3.5%
Cap rate
0.5%
Rent to Value Ratio

Active
$619,000
2
bds
|
0
ba
|
0
sqft
|
built
2000
3541 Roswell Rd NE, Atlanta, GA 30305
$-1,567
Cash flow
-13.2%
Cash-on-Cash Return
3.1%
Cap rate
0.6%
Rent to Value Ratio

Active
$180,000
1
bds
|
1
ba
|
0
sqft
|
built
1983
408 River Run Dr, Sandy Springs, GA 30350
$-409
Cash flow
-11.9%
Cash-on-Cash Return
3.4%
Cap rate
0.9%
Rent to Value Ratio

Active
$245,000
2
bds
|
0
ba
|
1,256
sqft
|
built
1963
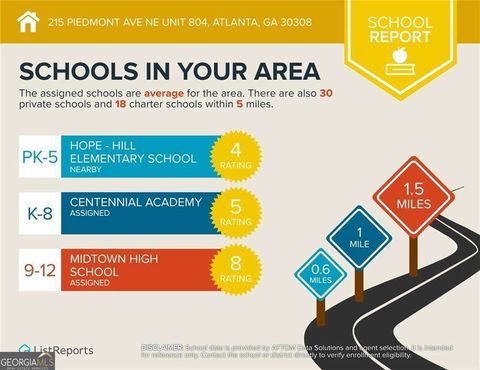
215 Piedmont Ave NE, Atlanta, GA 30308
$-1,240
Cash flow
-26.4%
Cash-on-Cash Return
0.1%
Cap rate
0.9%
Rent to Value Ratio
Active
$2,495,000
6
bds
|
0
ba
|
6,441
sqft
|
built
2016
4225 Wieuca Rd NE, Atlanta, GA 30342
$-8,517
Cash flow
-17.8%
Cash-on-Cash Return
2.1%
Cap rate
0.4%
Rent to Value Ratio
Active
$599,999
4
bds
|
0
ba
|
2,546
sqft
|
built
1920
1253 Lucile Ave SW, Atlanta, GA 30310
$-2,148
Cash flow
-18.7%
Cash-on-Cash Return
1.9%
Cap rate
0.3%
Rent to Value Ratio

Active
$175,000
3
bds
|
2.5
ba
|
1,368
sqft
|
built
2018
2138 Chadwick Rd SW, Atlanta, GA 30331
$-170
Cash flow
-5.1%
Cash-on-Cash Return
5.0%
Cap rate
1.0%
Rent to Value Ratio
Active
$318,900
1
bds
|
1
ba
|
0
sqft
|
built
2006
3445 Stratford Rd NE, Atlanta, GA 30326
$-92
Cash flow
-1.5%
Cash-on-Cash Return
5.8%
Cap rate
0.7%
Rent to Value Ratio
Active
$180,000
2
bds
|
0
ba
|
1,075
sqft
|
built
1963
215 Piedmont Ave NE, Atlanta, GA 30308
$-893
Cash flow
-25.9%
Cash-on-Cash Return
0.2%
Cap rate
1.1%
Rent to Value Ratio

Active
$200,000
2
bds
|
2.5
ba
|
1,408
sqft
|
built
2006
2555 Flat Shoals Rd, Atlanta, GA 30349
$-326
Cash flow
-8.5%
Cash-on-Cash Return
4.2%
Cap rate
0.9%
Rent to Value Ratio
Active
$285,000
3
bds
|
0
ba
|
0
sqft
|
built
1964
6851 Roswell Rd, Sandy Springs, GA 30328
$-653
Cash flow
-12.0%
Cash-on-Cash Return
3.4%
Cap rate
0.8%
Rent to Value Ratio
Active
$190,000
4
bds
|
2
ba
|
825
sqft
|
built
1958
726 Alfred Rd NW, Atlanta, GA 30331
$-191
Cash flow
-5.2%
Cash-on-Cash Return
4.9%
Cap rate
0.7%
Rent to Value Ratio
Active
$275,000
3
bds
|
2
ba
|
1,425
sqft
|
built
1945
615 Cofield Dr, Hapeville, GA 30354
$-779
Cash flow
-14.8%
Cash-on-Cash Return
2.7%
Cap rate
0.7%
Rent to Value Ratio
Active
$150,000
1
bds
|
0
ba
|
631
sqft
|
built
1963
215 Piedmont Ave NE, Atlanta, GA 30308
$-353
Cash flow
-12.3%
Cash-on-Cash Return
3.3%
Cap rate
1.2%
Rent to Value Ratio
Active
$299,000
3
bds
|
2
ba
|
1,280
sqft
|
built
1950
1227 Kenilworth Dr SW, Atlanta, GA 30310
$-875
Cash flow
-15.3%
Cash-on-Cash Return
2.6%
Cap rate
0.4%
Rent to Value Ratio

Active
$559,900
4
bds
|
0
ba
|
0
sqft
|
built
2009
3607 Archgate Ct, Alpharetta, GA 30004
$-1,252
Cash flow
-11.7%
Cash-on-Cash Return
3.5%
Cap rate
0.5%
Rent to Value Ratio
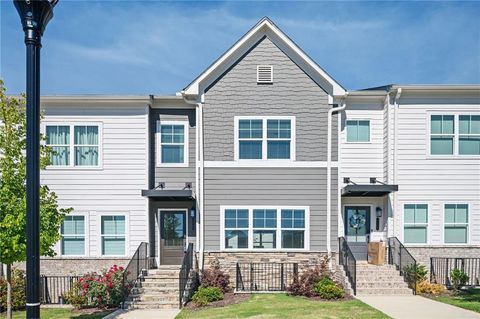
Active
$245,000
3
bds
|
2.5
ba
|
1,880
sqft
|
built
2020
5095 Lower Elm St, South Fulton, GA 30349
$-202
Cash flow
-4.3%
Cash-on-Cash Return
5.2%
Cap rate
0.8%
Rent to Value Ratio
Active
$236,500
2
bds
|
3
ba
|
0
sqft
|
built
1928
2855 Peachtree Rd NE, Atlanta, GA 30305
$-433
Cash flow
-9.6%
Cash-on-Cash Return
3.9%
Cap rate
1.0%
Rent to Value Ratio

Active
$409,900
5
bds
|
0
ba
|
0
sqft
|
built
1920
1127 Metropolitan Pkwy SW, Atlanta, GA 30310
$-1,559
Cash flow
-19.8%
Cash-on-Cash Return
1.6%
Cap rate
0.3%
Rent to Value Ratio
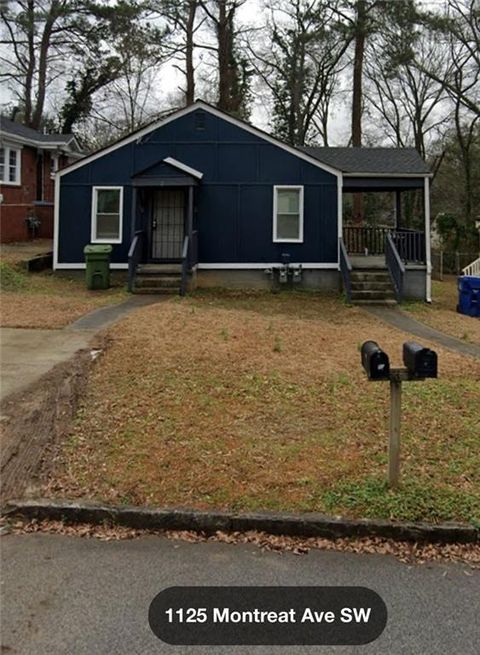
Active
$299,900
2
bds
|
0
ba
|
0
sqft
|
built
1950
1126 Montreat Ave SW, Atlanta, GA 30310
$-1,194
Cash flow
-20.8%
Cash-on-Cash Return
1.4%
Cap rate
0.3%
Rent to Value Ratio
Active
$198,000
3
bds
|
0
ba
|
1,036
sqft
|
built
1962
1991 Turner Rd SE, Atlanta, GA 30315
$90
Cash flow
2.4%
Cash-on-Cash Return
6.7%
Cap rate
0.8%
Rent to Value Ratio
Active
$324,950
2
bds
|
0
ba
|
0
sqft
|
built
1991
4248 River Green Dr NW, Atlanta, GA 30327
$-741
Cash flow
-11.9%
Cash-on-Cash Return
3.4%
Cap rate
0.8%
Rent to Value Ratio
Active
$295,000
3
bds
|
2
ba
|
1,300
sqft
|
built
1964
115 Biscayne Dr NW, Atlanta, GA 30309
$-813
Cash flow
-14.4%
Cash-on-Cash Return
2.8%
Cap rate
0.8%
Rent to Value Ratio

Active
$889,000
2
bds
|
0
ba
|
1,470
sqft
|
built
1940
67 Delmont Dr NE, Atlanta, GA 30305
$-2,852
Cash flow
-16.7%
Cash-on-Cash Return
2.3%
Cap rate
0.4%
Rent to Value Ratio
Active
$714,900
4
bds
|
3.5
ba
|
4,158
sqft
|
built
2008
13042 Dartmore Ave, Alpharetta, GA 30005
$-1,829
Cash flow
-13.3%
Cash-on-Cash Return
3.1%
Cap rate
0.5%
Rent to Value Ratio
Active
$259,000
1
bds
|
1
ba
|
0
sqft
|
built
1996
1075 Peachtree Walk NE, Atlanta, GA 30309
$-653
Cash flow
-13.2%
Cash-on-Cash Return
3.1%
Cap rate
0.7%
Rent to Value Ratio
Active
$275,000
3
bds
|
2.5
ba
|
1,566
sqft
|
built
2006
5612 Festival Ave, Fairburn, GA 30213
$-373
Cash flow
-7.1%
Cash-on-Cash Return
4.5%
Cap rate
0.7%
Rent to Value Ratio
Active
$227,000
2
bds
|
2
ba
|
0
sqft
|
built
1980
23307 Plantation Dr NE, Atlanta, GA 30324
$-790
Cash flow
-18.2%
Cash-on-Cash Return
2.0%
Cap rate
1.0%
Rent to Value Ratio
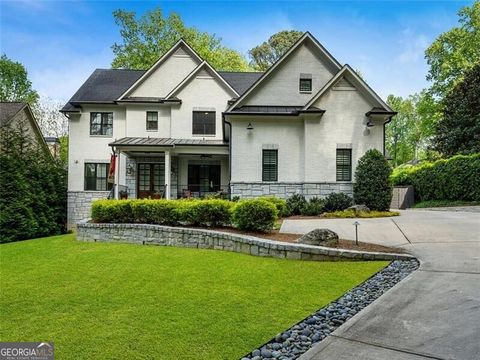
Active
$3,095,000
4
bds
|
4
ba
|
6,115
sqft
|
built
1958
3212 Arden Rd NW, Atlanta, GA 30305
$-14,440
Cash flow
-24.3%
Cash-on-Cash Return
0.5%
Cap rate
0.2%
Rent to Value Ratio

Active
$379,900
2
bds
|
2
ba
|
0
sqft
|
built
1991
3475 Oak Valley Rd NE, Atlanta, GA 30326
$-1,389
Cash flow
-19.1%
Cash-on-Cash Return
1.8%
Cap rate
0.7%
Rent to Value Ratio
Active
$550,000
3
bds
|
2.5
ba
|
1,786
sqft
|
built
2004
1160 Foster Pl NW, Atlanta, GA 30318
$-804
Cash flow
-7.6%
Cash-on-Cash Return
4.4%
Cap rate
0.6%
Rent to Value Ratio
Active
$324,900
3
bds
|
3.5
ba
|
1,326
sqft
|
built
2005
1168 Liberty Pkwy NW, Atlanta, GA 30318
$-882
Cash flow
-14.2%
Cash-on-Cash Return
2.9%
Cap rate
0.8%
Rent to Value Ratio
Active
$997,000
3
bds
|
3.5
ba
|
4,434
sqft
|
built
1985
1183 Woods Cir NE, Atlanta, GA 30324
$-3,356
Cash flow
-17.6%
Cash-on-Cash Return
2.1%
Cap rate
0.5%
Rent to Value Ratio
Active
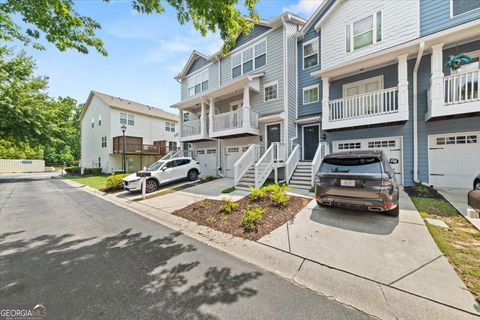
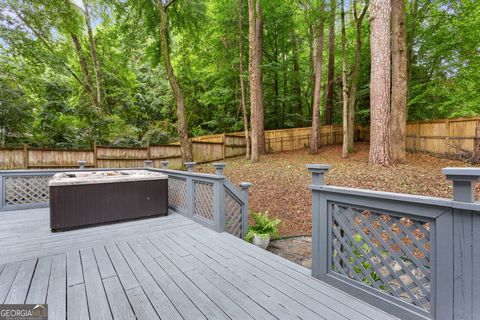
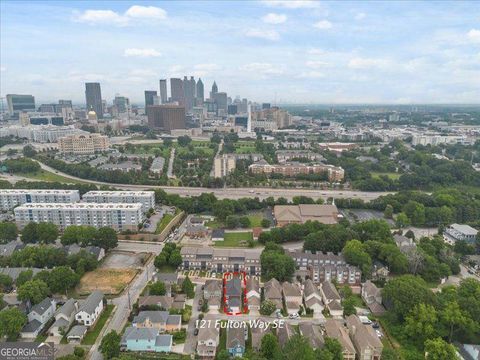
$847,800
4
bds
|
3
ba
|
3,120
sqft
|
built
2000
121 Fulton Way SE, Atlanta, GA 30312
$-2,897
Cash flow
-17.8%
Cash-on-Cash Return
2.0%
Cap rate
0.4%
Rent to Value Ratio