Garland, UT Investment Properties for Sale
Browse homes for sale and investment properties in Garland, UT. Refine your search by price, property type, or more.
Best cash flowing properties in Garland, UT
Active
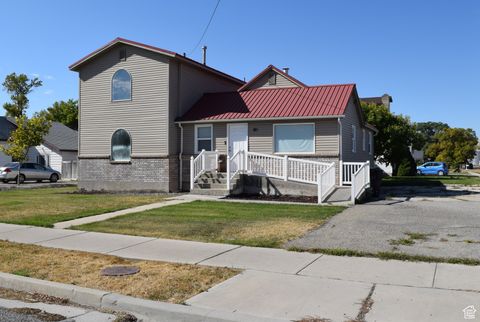
$348,900
4
bds
|
2
ba
|
2,903
sqft
|
built
1941
112 S Main St, Garland, UT 84312
$-304
Cash flow
-4.5%
Cash-on-Cash Return
4.6%
Cap rate
0.6%
Rent to Value Ratio
Active
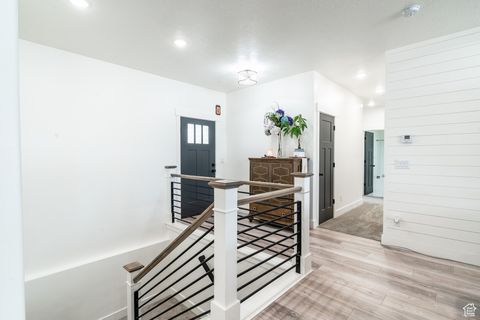
$517,810
3
bds
|
2
ba
|
3,380
sqft
|
built
2023
1118 E 1310 S, Garland, UT 84312
$-864
Cash flow
-8.7%
Cash-on-Cash Return
3.7%
Cap rate
0.5%
Rent to Value Ratio
8 out of 10 properties for sale in Garland, UT
Limited Results Shown
Create a free account, or log in to reveal all property listings and enjoy the complete experience.
Active
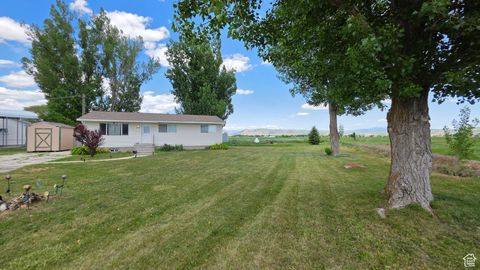
$424,999
5
bds
|
2
ba
|
2,040
sqft
|
built
1975
16580 N 5200 W, Garland, UT 84312
$-929
Cash flow
-11.4%
Cash-on-Cash Return
3.1%
Cap rate
0.4%
Rent to Value Ratio
Active
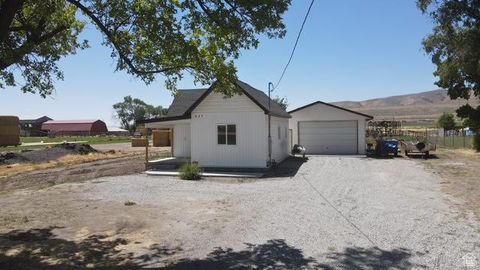
$337,000
2
bds
|
1
ba
|
660
sqft
|
built
1908
627 N Main St, Garland, UT 84312
$-938
Cash flow
-14.5%
Cash-on-Cash Return
2.3%
Cap rate
0.3%
Rent to Value Ratio
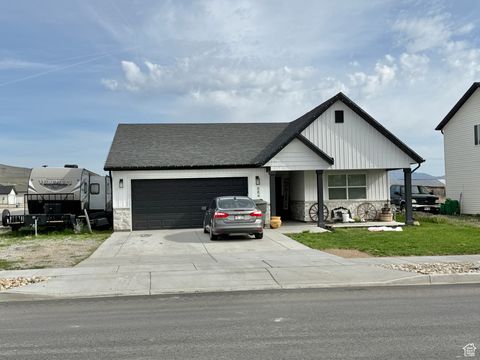
Active
$465,000
5
bds
|
3
ba
|
2,625
sqft
|
built
2013
477 E 1325 S, Garland, UT 84312
$-1,426
Cash flow
-16.0%
Cash-on-Cash Return
2.0%
Cap rate
0.3%
Rent to Value Ratio
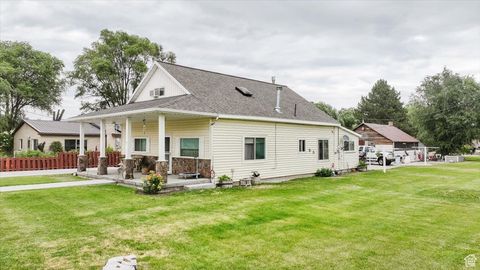
Active
$474,500
6
bds
|
3
ba
|
2,431
sqft
|
built
1916
14360 N 6000 W, Garland, UT 84312
$-1,407
Cash flow
-15.5%
Cash-on-Cash Return
2.1%
Cap rate
0.3%
Rent to Value Ratio
Active
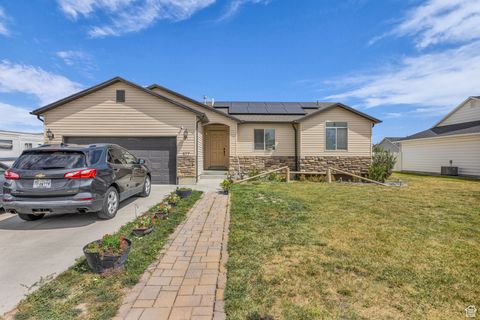
$449,900
3
bds
|
2
ba
|
1,481
sqft
|
built
2022
884 W Factory St, Garland, UT 84312
$-1,080
Cash flow
-12.5%
Cash-on-Cash Return
2.8%
Cap rate
0.4%
Rent to Value Ratio

Active
$649,900
2
bds
|
4
ba
|
4,287
sqft
|
built
1910
15125 N 4400 W, Garland, UT 84312
$-1,104
Cash flow
-8.9%
Cash-on-Cash Return
3.6%
Cap rate
0.5%
Rent to Value Ratio