Grayson, GA Investment Properties for Sale
Browse homes for sale and investment properties in Grayson, GA. Refine your search by price, property type, or more.
Best cash flowing properties in Grayson, GA
Active
$349,900
3
bds
|
0
ba
|
0
sqft
|
built
2021
1484 Ben Park Way, Grayson, GA 30017
$-563
Cash flow
-8.4%
Cash-on-Cash Return
4.2%
Cap rate
0.7%
Rent to Value Ratio
Active
$430,000
4
bds
|
0
ba
|
2,544
sqft
|
built
2004
828 Cooper Lakes Ct, Grayson, GA 30017
$-615
Cash flow
-7.5%
Cash-on-Cash Return
4.4%
Cap rate
0.6%
Rent to Value Ratio
88 out of 92 properties for sale in Grayson, GA
Limited Results Shown
Create a free account, or log in to reveal all property listings and enjoy the complete experience.
Active
$514,000
5
bds
|
0
ba
|
0
sqft
|
built
2007
25 Kaktovic Ct, Grayson, GA 30017
$-1,181
Cash flow
-12.0%
Cash-on-Cash Return
3.4%
Cap rate
0.5%
Rent to Value Ratio
Active
$410,000
4
bds
|
0
ba
|
3,159
sqft
|
built
1982
1870 Shoreline Trce, Grayson, GA 30017
$-852
Cash flow
-10.8%
Cash-on-Cash Return
3.7%
Cap rate
0.6%
Rent to Value Ratio
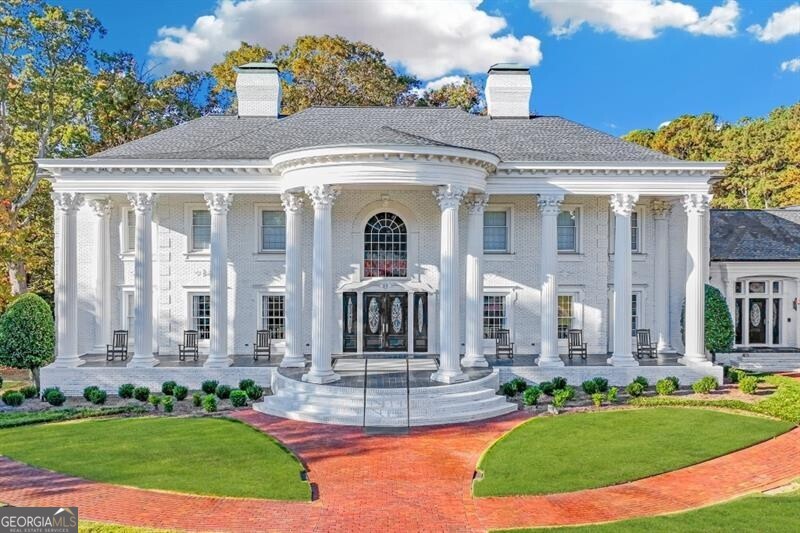
Active
$2,500,000
5
bds
|
0
ba
|
15,866
sqft
|
built
1988
1445 Hillside Dr, Grayson, GA 30017
$-9,162
Cash flow
-19.1%
Cash-on-Cash Return
1.7%
Cap rate
0.3%
Rent to Value Ratio
Active
$439,990
3
bds
|
0
ba
|
2,487
sqft
|
built
1998
1010 Capella Creek Way, Grayson, GA 30017
$-680
Cash flow
-8.1%
Cash-on-Cash Return
4.3%
Cap rate
0.6%
Rent to Value Ratio
Active
$499,000
5
bds
|
0
ba
|
3,649
sqft
|
built
2005
21 Whitegrass Way, Grayson, GA 30017
$-1,024
Cash flow
-10.7%
Cash-on-Cash Return
3.7%
Cap rate
0.6%
Rent to Value Ratio
Active
$354,800
3
bds
|
0
ba
|
1,746
sqft
|
built
2022
1386 Ben Park Way, Grayson, GA 30017
$-725
Cash flow
-10.7%
Cash-on-Cash Return
3.7%
Cap rate
0.6%
Rent to Value Ratio
Active
$465,000
4
bds
|
3
ba
|
0
sqft
|
built
1991
2031 Lakewood Cir, Grayson, GA 30017
$-697
Cash flow
-7.8%
Cash-on-Cash Return
4.3%
Cap rate
0.6%
Rent to Value Ratio
Active
$495,000
3
bds
|
0
ba
|
2,566
sqft
|
built
2002
725 Windsor Place Cir, Grayson, GA 30017
$-1,094
Cash flow
-11.5%
Cash-on-Cash Return
3.5%
Cap rate
0.6%
Rent to Value Ratio
Active
$430,900
3
bds
|
0
ba
|
2,158
sqft
|
built
2007
178 Mission Oak Dr, Grayson, GA 30017
$-1,123
Cash flow
-13.6%
Cash-on-Cash Return
3.0%
Cap rate
0.5%
Rent to Value Ratio
Active
$509,900
5
bds
|
0
ba
|
3,095
sqft
|
built
1994
470 Brackin Trce, Grayson, GA 30017
$-1,170
Cash flow
-12.0%
Cash-on-Cash Return
3.4%
Cap rate
0.4%
Rent to Value Ratio
Active
$314,900
3
bds
|
0
ba
|
1,507
sqft
|
built
1977
2469 Silver King Dr, Grayson, GA 30017
$-657
Cash flow
-10.9%
Cash-on-Cash Return
3.6%
Cap rate
0.6%
Rent to Value Ratio
Active
$325,000
3
bds
|
0
ba
|
0
sqft
|
built
2021
1312 Cooper Springs Rd, Grayson, GA 30017
$-659
Cash flow
-10.6%
Cash-on-Cash Return
3.7%
Cap rate
0.7%
Rent to Value Ratio
Active
$469,000
4
bds
|
0
ba
|
0
sqft
|
built
1974
1129 Pinehurst Rd, Grayson, GA 30017
$-1,290
Cash flow
-14.4%
Cash-on-Cash Return
2.8%
Cap rate
0.5%
Rent to Value Ratio
Active
$440,000
4
bds
|
0
ba
|
2,613
sqft
|
built
2004
1670 Cooper Lakes Dr, Grayson, GA 30017
$-1,092
Cash flow
-12.9%
Cash-on-Cash Return
3.2%
Cap rate
0.6%
Rent to Value Ratio
Active
$484,995
5
bds
|
0
ba
|
3,633
sqft
|
built
1954
2490 Turtle Ter, Grayson, GA 30017
$-688
Cash flow
-7.4%
Cash-on-Cash Return
4.4%
Cap rate
0.7%
Rent to Value Ratio
Active
$499,500
5
bds
|
0
ba
|
2,698
sqft
|
built
2022
70 Clark Lake Ln, Grayson, GA 30017
$-1,314
Cash flow
-13.7%
Cash-on-Cash Return
3.0%
Cap rate
0.5%
Rent to Value Ratio
Active
$464,900
4
bds
|
0
ba
|
2,492
sqft
|
built
2015
2212 Reddy Farm Ln, Grayson, GA 30017
$-1,120
Cash flow
-12.6%
Cash-on-Cash Return
3.3%
Cap rate
0.6%
Rent to Value Ratio
Active
$350,000
3
bds
|
0
ba
|
1,875
sqft
|
built
2001
1220 Skipping Rock Ln, Grayson, GA 30017
$-682
Cash flow
-10.2%
Cash-on-Cash Return
3.8%
Cap rate
0.6%
Rent to Value Ratio
Active
$529,900
4
bds
|
0
ba
|
3,566
sqft
|
built
1996
2545 Amberbrook Ln, Grayson, GA 30017
$-934
Cash flow
-9.2%
Cash-on-Cash Return
4.0%
Cap rate
0.5%
Rent to Value Ratio
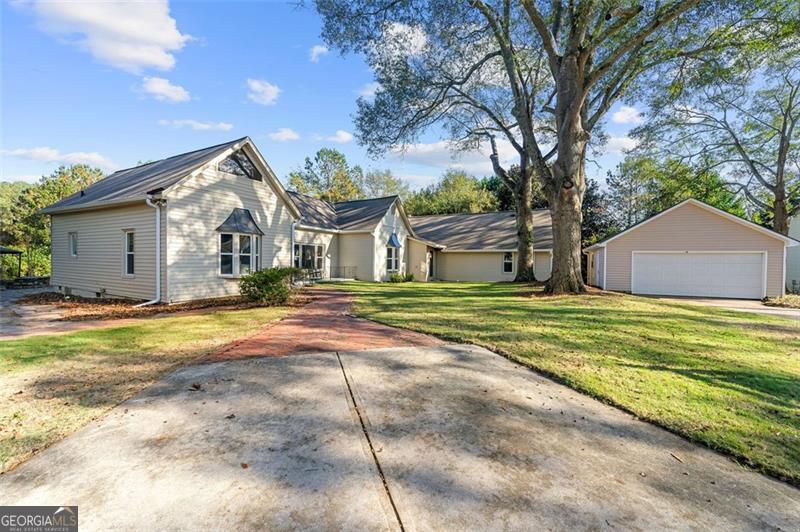
Active under contract
$375,000
4
bds
|
0
ba
|
1,746
sqft
|
built
1998
1650 Willow River Run, Grayson, GA 30017
$-752
Cash flow
-10.5%
Cash-on-Cash Return
3.7%
Cap rate
0.6%
Rent to Value Ratio
Active
$465,900
3
bds
|
0
ba
|
2,485
sqft
|
built
2000
677 Anchorage Ave, Grayson, GA 30017
$-811
Cash flow
-9.1%
Cash-on-Cash Return
4.1%
Cap rate
0.7%
Rent to Value Ratio
Active
$415,000
4
bds
|
0
ba
|
2,025
sqft
|
built
1974
2538 Three Bars Dr, Grayson, GA 30017
$-1,068
Cash flow
-13.4%
Cash-on-Cash Return
3.1%
Cap rate
0.5%
Rent to Value Ratio
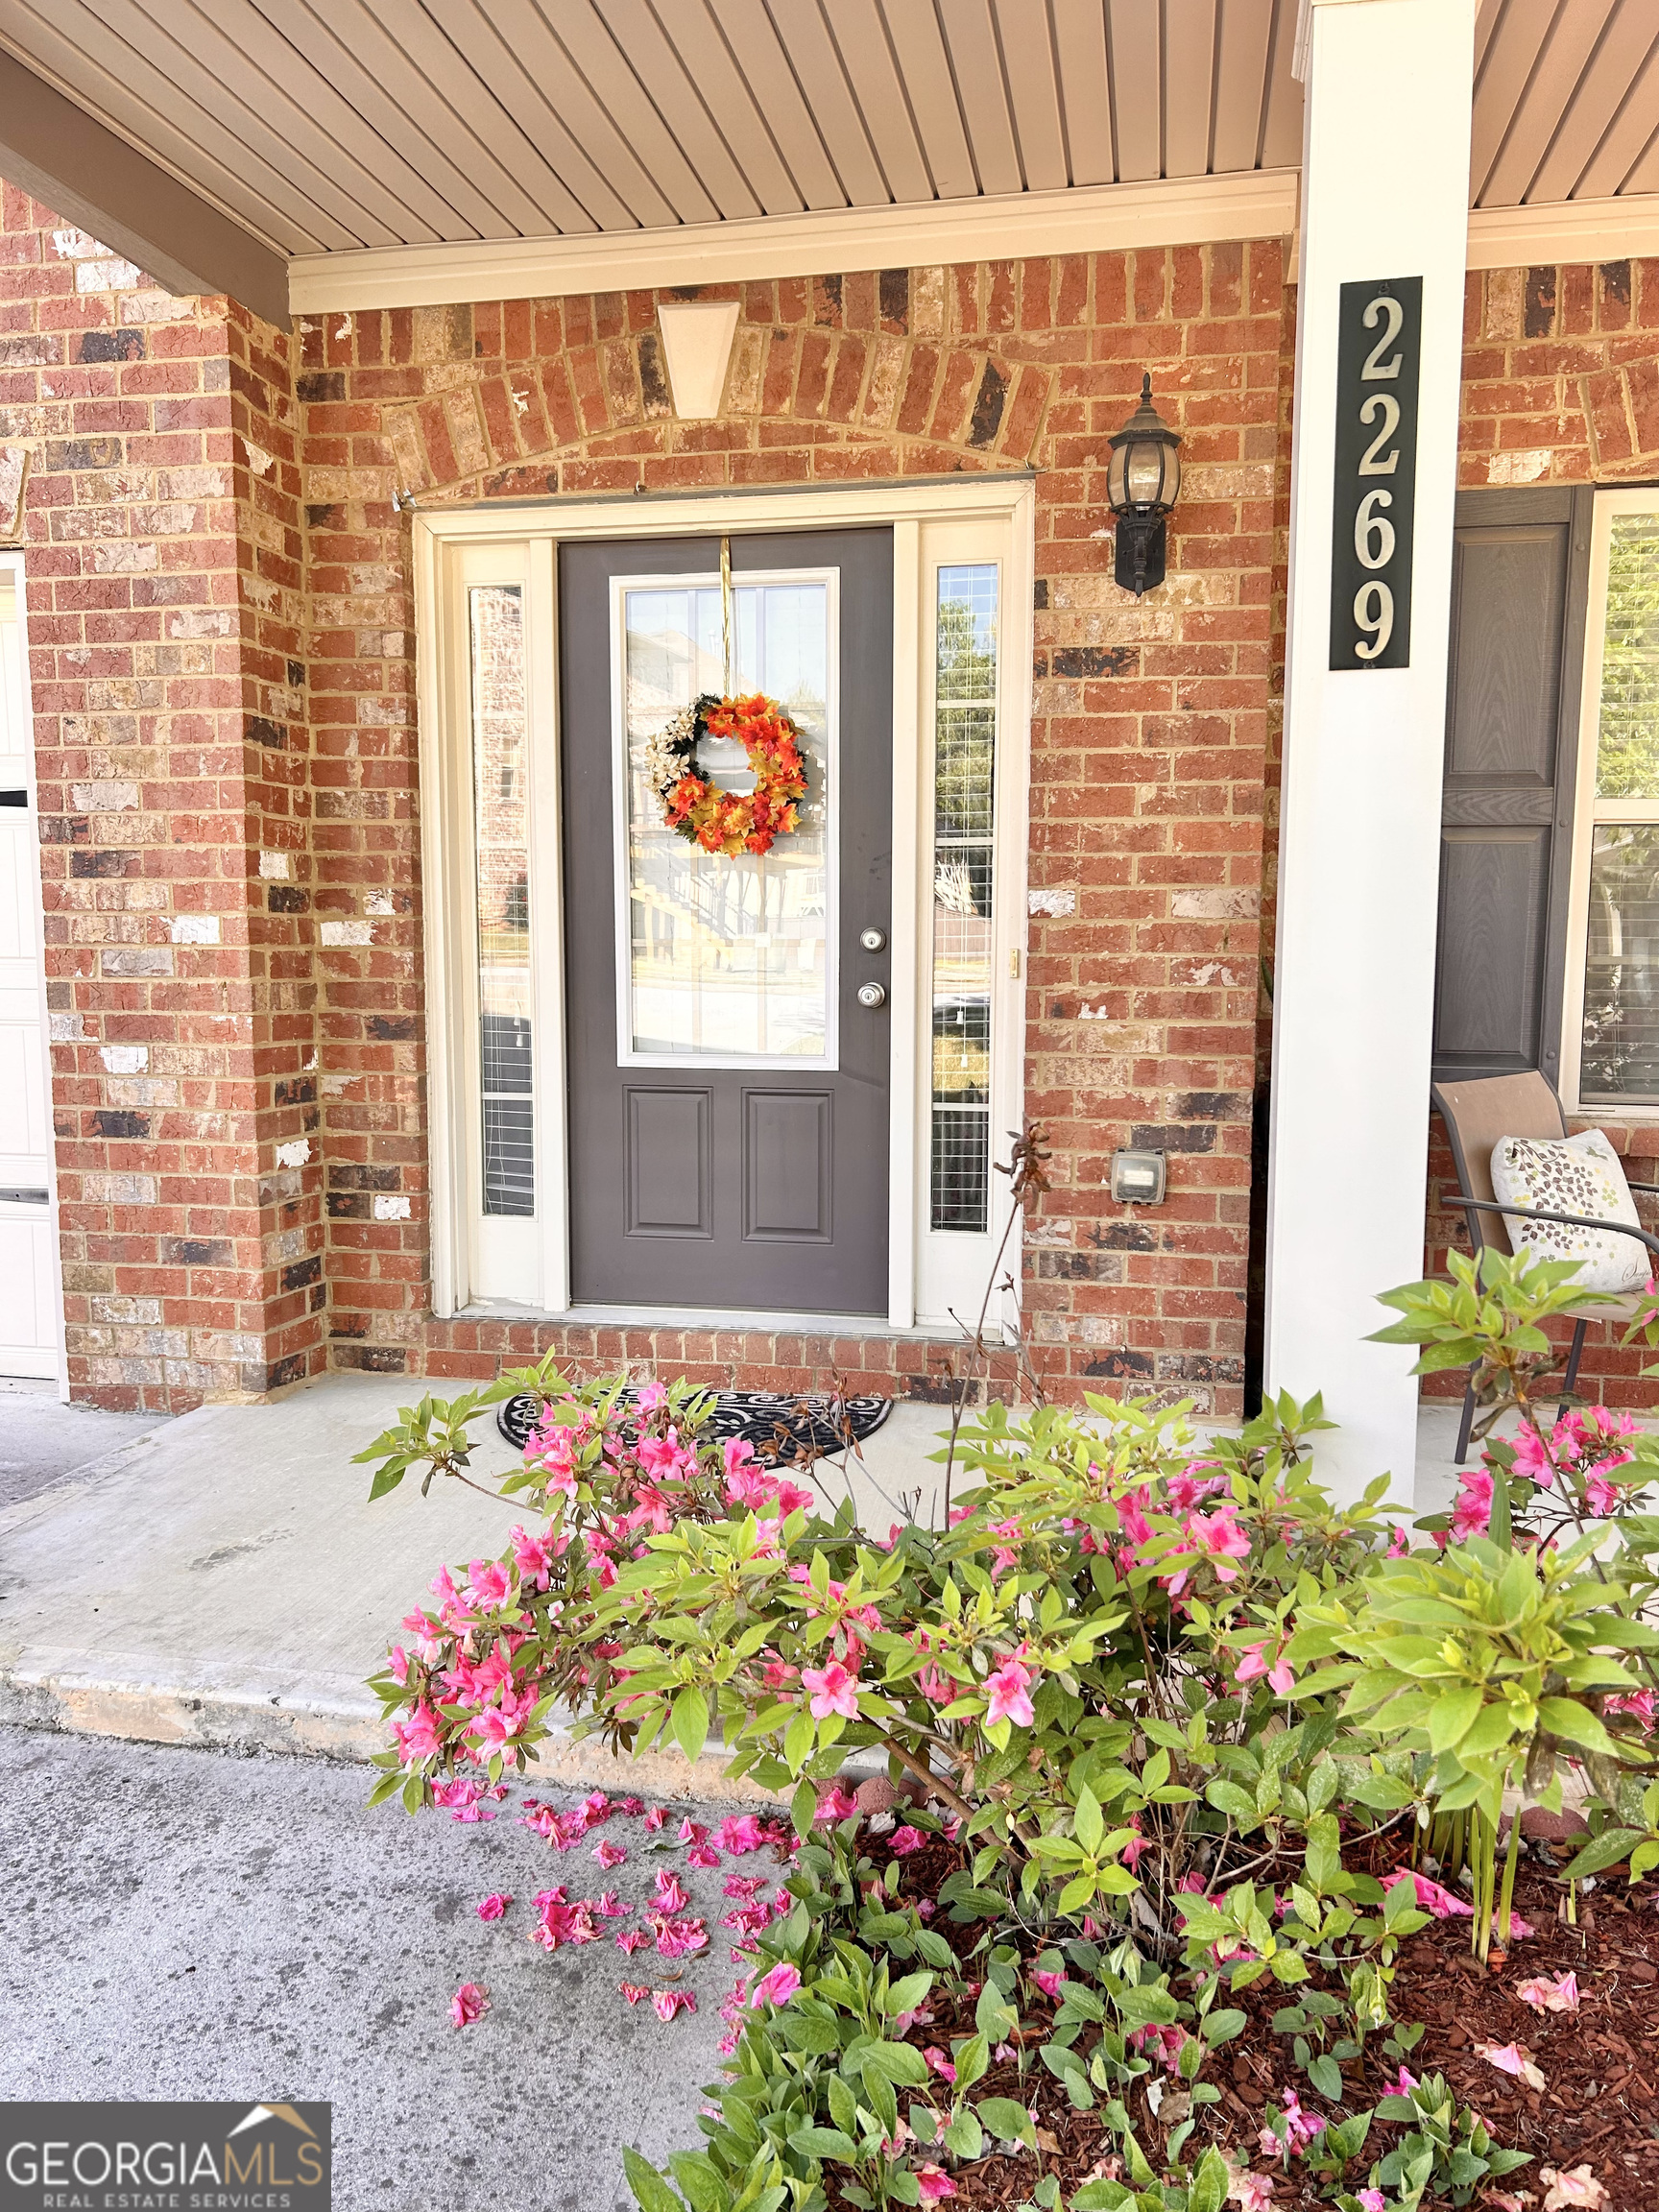
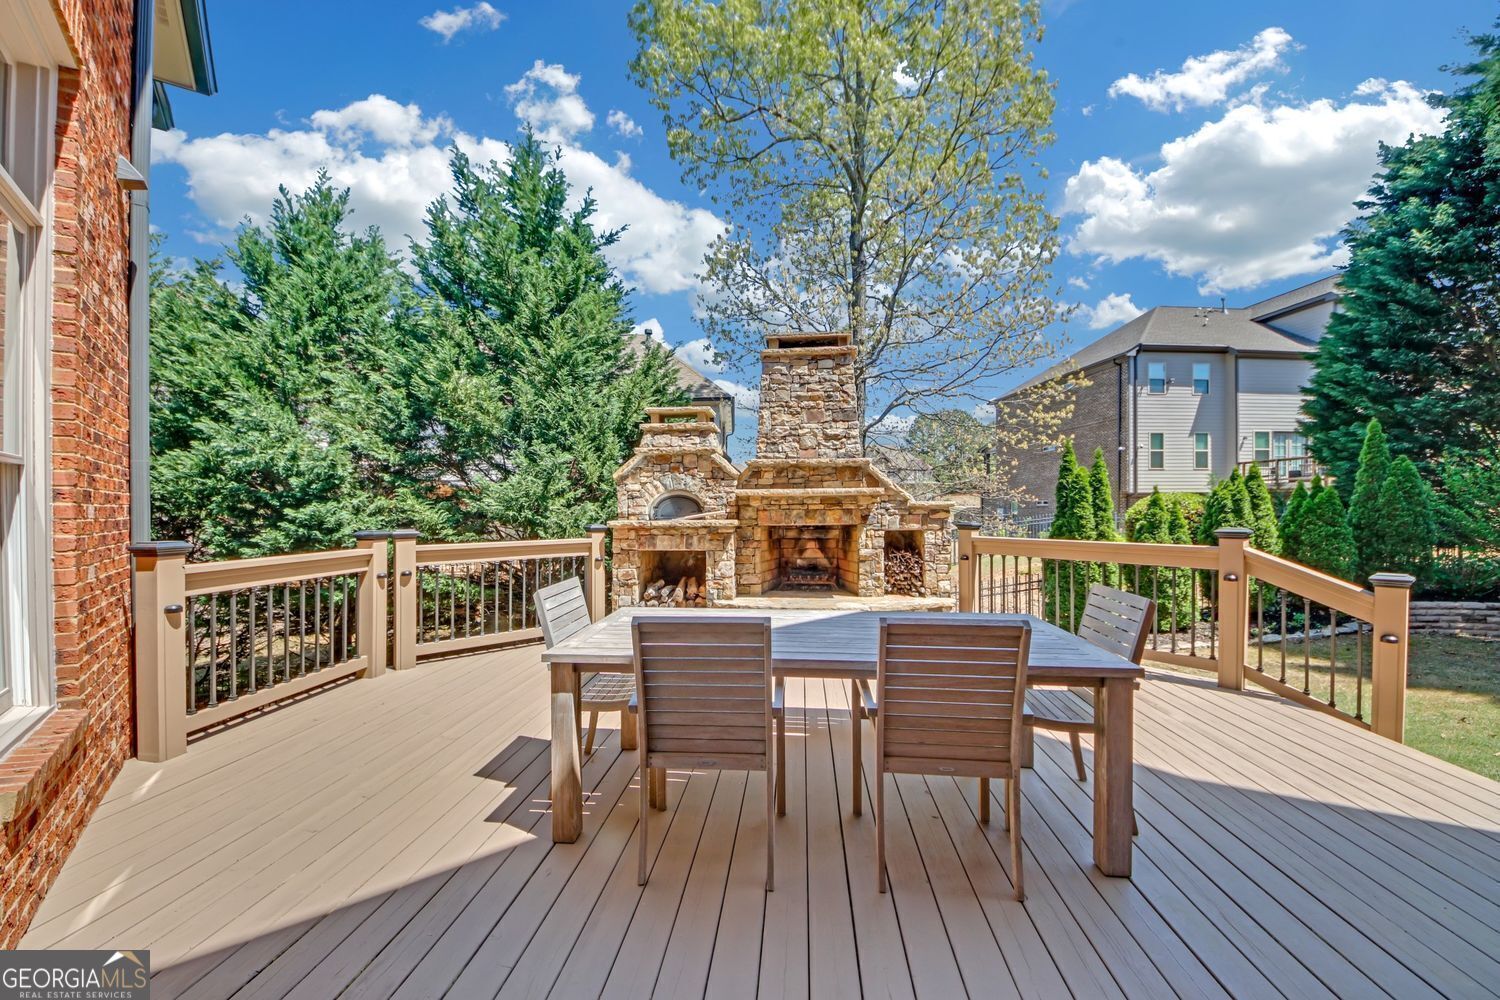
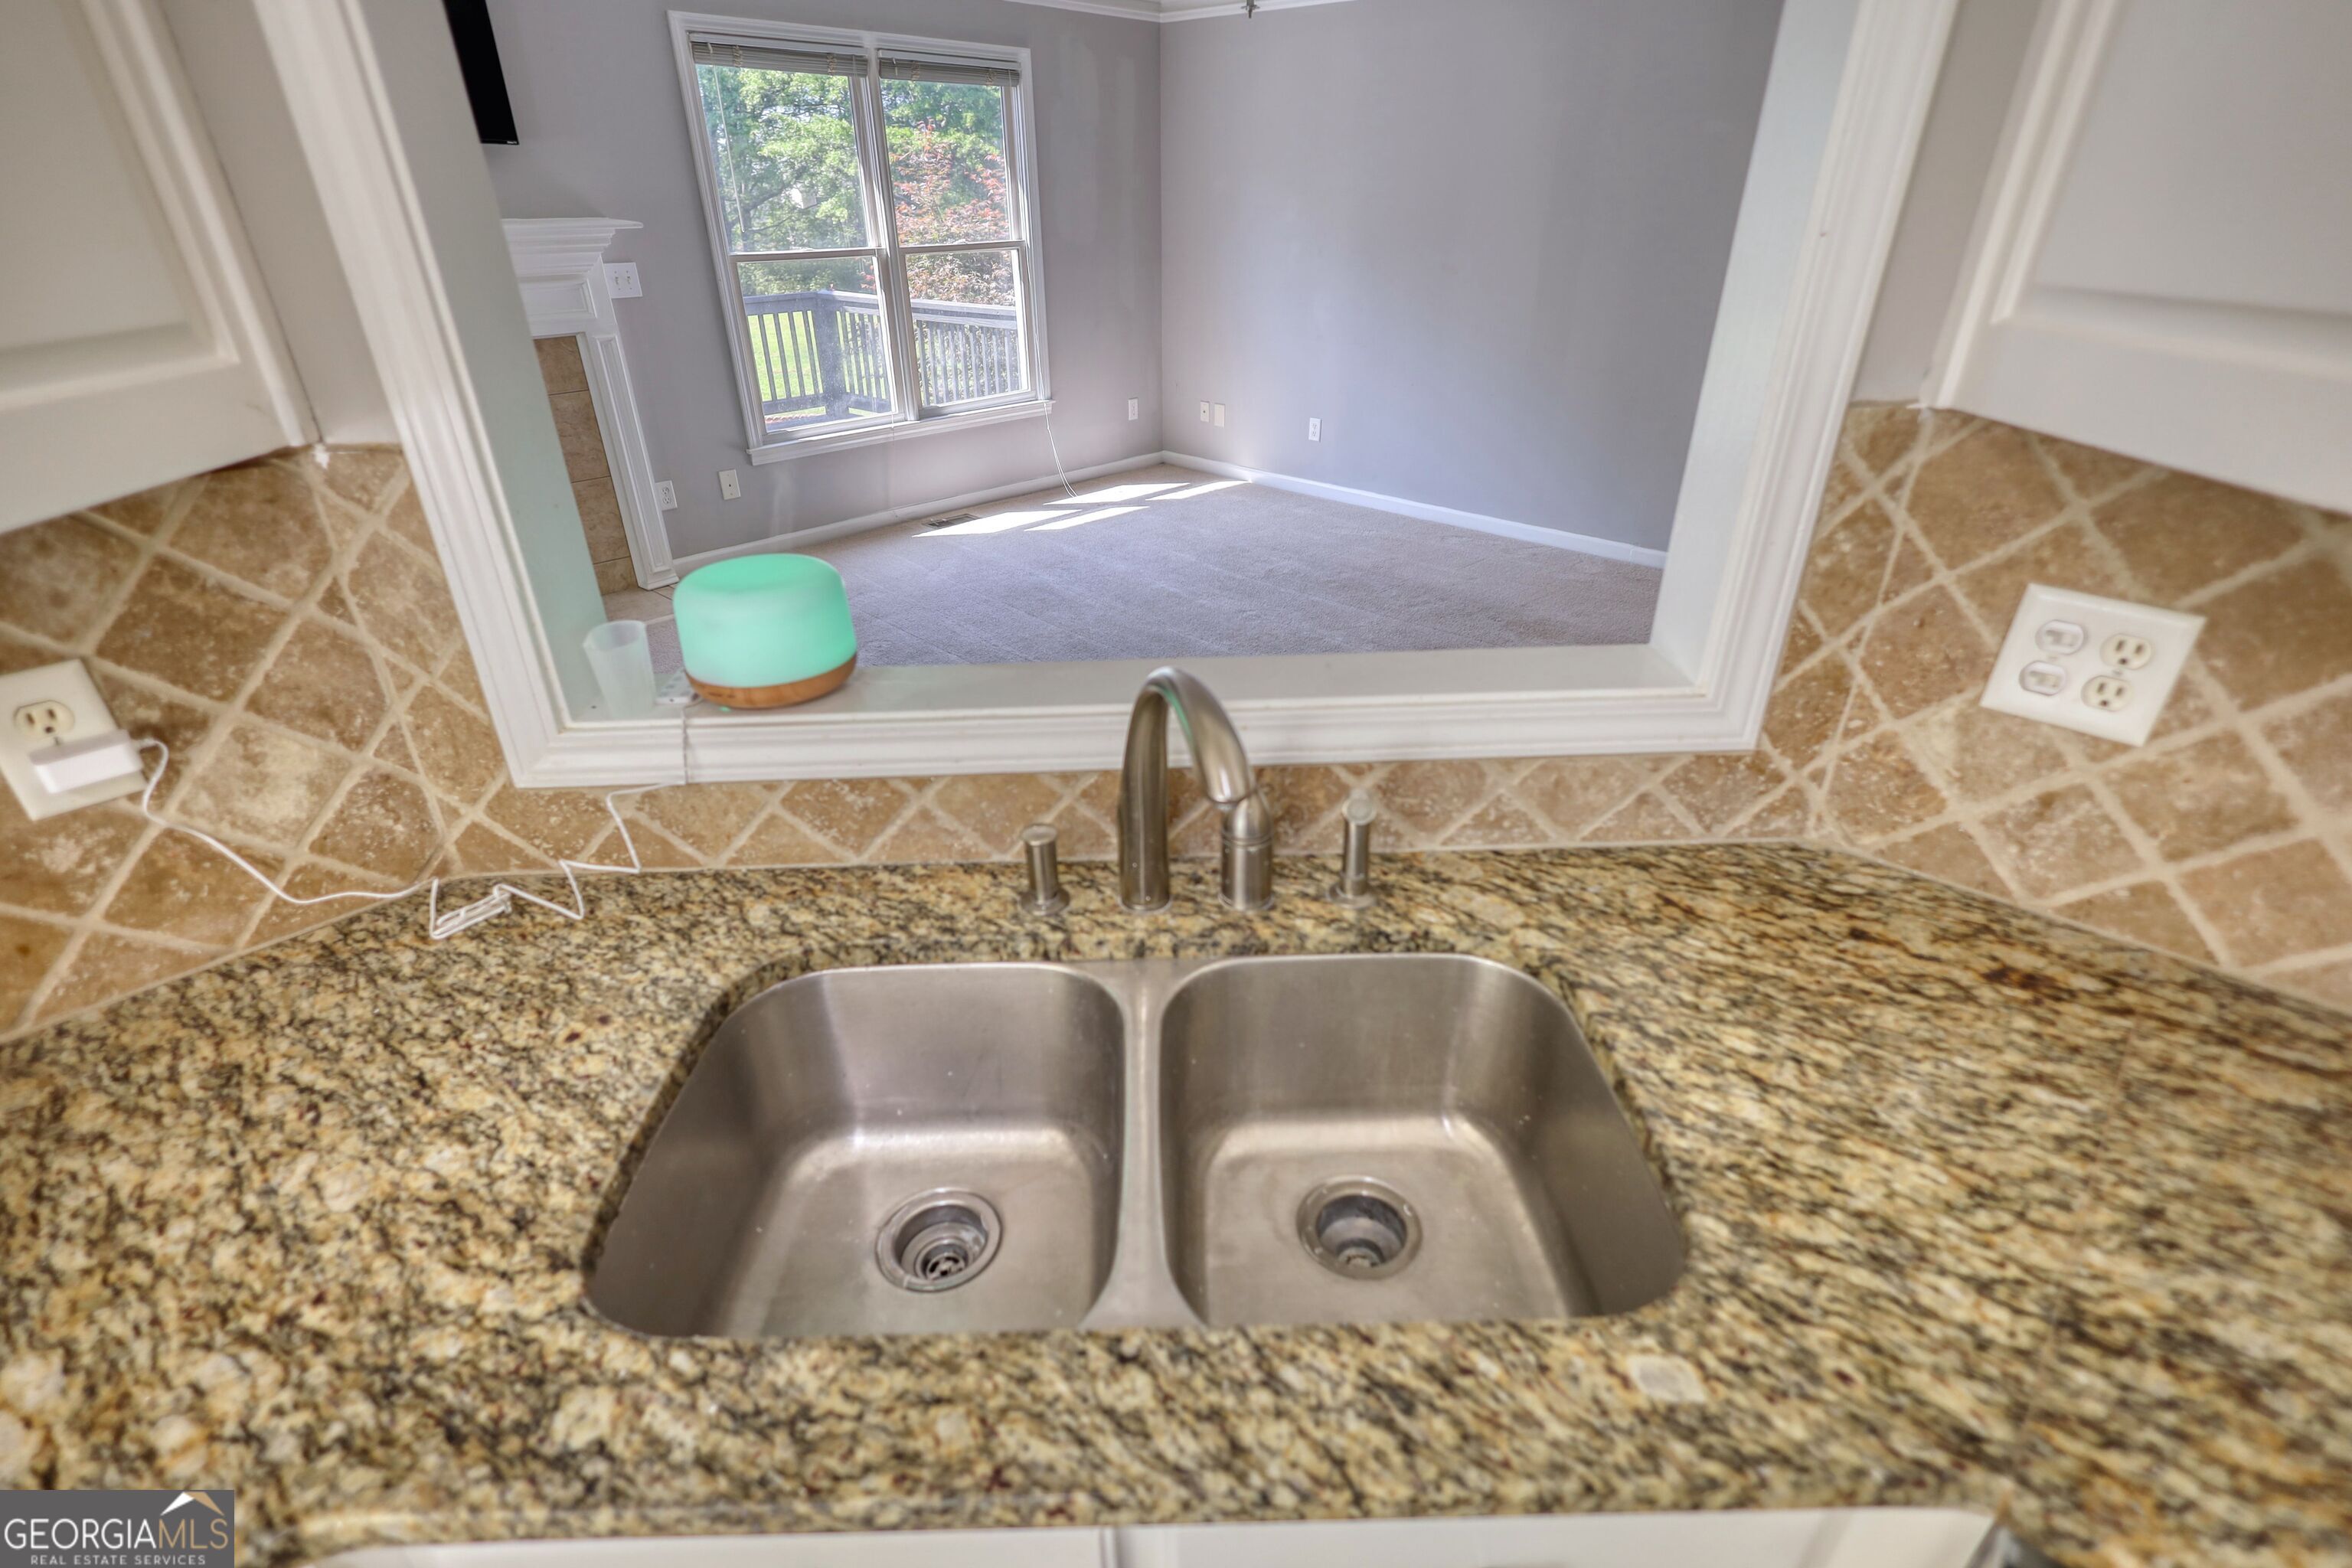
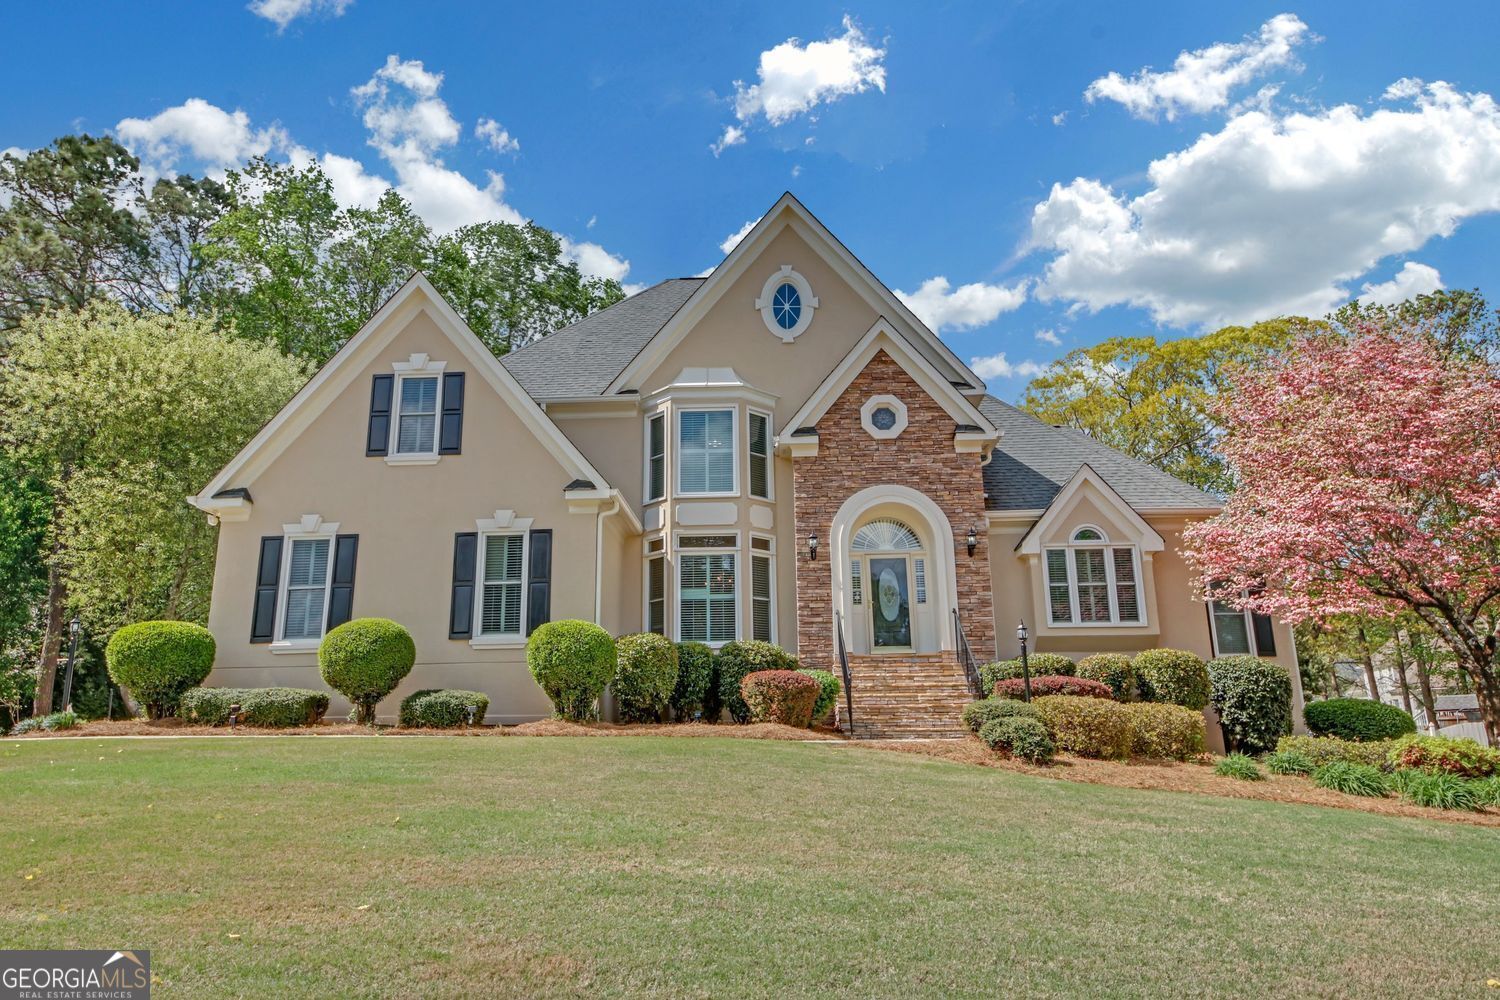
Active
$507,000
5
bds
|
0
ba
|
3,182
sqft
|
built
2015
2269 Reddy Farm Ln, Grayson, GA 30017
$-1,098
Cash flow
-11.3%
Cash-on-Cash Return
3.5%
Cap rate
0.6%
Rent to Value Ratio
Active
$1,000,000
6
bds
|
0
ba
|
8,155
sqft
|
built
2007
866 Coopers Ridge Path, Grayson, GA 30017
$-3,732
Cash flow
-19.5%
Cash-on-Cash Return
1.7%
Cap rate
0.3%
Rent to Value Ratio

Active
$365,000
3
bds
|
3
ba
|
0
sqft
|
built
2004
2763 Storybook Ct, Grayson, GA 30017
$-795
Cash flow
-11.4%
Cash-on-Cash Return
3.5%
Cap rate
0.6%
Rent to Value Ratio
Active
$485,000
4
bds
|
0
ba
|
2,780
sqft
|
built
2001
72 Grayson New Hope Rd, Grayson, GA 30017
$-986
Cash flow
-10.6%
Cash-on-Cash Return
3.7%
Cap rate
0.6%
Rent to Value Ratio
Active
$800,000
6
bds
|
0
ba
|
5,696
sqft
|
built
1994
1405 Wilmington Way, Grayson, GA 30017
$-2,584
Cash flow
-16.9%
Cash-on-Cash Return
2.3%
Cap rate
0.4%
Rent to Value Ratio

Active under contract
$389,990
4
bds
|
0
ba
|
2,314
sqft
|
built
2001
1715 Crestwell Ln, Grayson, GA 30017
$-971
Cash flow
-13.0%
Cash-on-Cash Return
3.2%
Cap rate
0.6%
Rent to Value Ratio
Active
$460,000
4
bds
|
0
ba
|
2,711
sqft
|
built
1993
2238 Roseberry Ln, Grayson, GA 30017
$-1,118
Cash flow
-12.7%
Cash-on-Cash Return
3.2%
Cap rate
0.6%
Rent to Value Ratio
Active under contract
$799,000
6
bds
|
0
ba
|
5,244
sqft
|
built
1995
1414 Lynchburg Trce, Grayson, GA 30017
$-2,163
Cash flow
-14.1%
Cash-on-Cash Return
2.9%
Cap rate
0.4%
Rent to Value Ratio
Active
$569,000
6
bds
|
0
ba
|
4,113
sqft
|
built
2014
9 Oatgrass Dr, Grayson, GA 30017
$-1,580
Cash flow
-14.5%
Cash-on-Cash Return
2.8%
Cap rate
0.5%
Rent to Value Ratio
Active
$430,000
4
bds
|
0
ba
|
2,544
sqft
|
built
2004
828 Cooper Lakes Ct, Grayson, GA 30017
$-615
Cash flow
-7.5%
Cash-on-Cash Return
4.4%
Cap rate
0.6%
Rent to Value Ratio
Active
$580,000
5
bds
|
0
ba
|
4,092
sqft
|
built
2001
2570 Middleton Way, Grayson, GA 30017
$-1,660
Cash flow
-14.9%
Cash-on-Cash Return
2.7%
Cap rate
0.5%
Rent to Value Ratio
Active
$539,990
4
bds
|
3
ba
|
0
sqft
|
built
2016
406 Dunaway Ct, Grayson, GA 30017
$-1,322
Cash flow
-12.8%
Cash-on-Cash Return
3.2%
Cap rate
0.5%
Rent to Value Ratio
Active
$520,000
4
bds
|
0
ba
|
2,585
sqft
|
built
2004
106 Little Barley Ln, Grayson, GA 30017
$-1,023
Cash flow
-10.3%
Cash-on-Cash Return
3.8%
Cap rate
0.6%
Rent to Value Ratio
Active
$349,900
3
bds
|
0
ba
|
0
sqft
|
built
2021
1484 Ben Park Way, Grayson, GA 30017
$-563
Cash flow
-8.4%
Cash-on-Cash Return
4.2%
Cap rate
0.7%
Rent to Value Ratio
Active
$779,900
6
bds
|
0
ba
|
5,341
sqft
|
built
2005
838 Natchez Valley Trce, Grayson, GA 30017
$-1,621
Cash flow
-10.8%
Cash-on-Cash Return
3.7%
Cap rate
0.6%
Rent to Value Ratio

Active
$1,099,999
6
bds
|
4
ba
|
6,185
sqft
|
built
2005
644 Herring Rd, Grayson, GA 30017
$-2,806
Cash flow
-13.3%
Cash-on-Cash Return
3.1%
Cap rate
0.5%
Rent to Value Ratio
Active
$620,000
4
bds
|
0
ba
|
3,897
sqft
|
built
1994
1621 Annapolis Way, Grayson, GA 30017
$-1,760
Cash flow
-14.8%
Cash-on-Cash Return
2.7%
Cap rate
0.5%
Rent to Value Ratio
Active
$484,000
3
bds
|
0
ba
|
2,347
sqft
|
built
2023
811 Pineberry Ct, Grayson, GA 30017
$-1,410
Cash flow
-15.2%
Cash-on-Cash Return
2.7%
Cap rate
0.5%
Rent to Value Ratio