Houston, TX Investment Properties for Sale
Browse homes for sale and investment properties in Houston, TX. Refine your search by price, property type, or more.
Best cash flowing properties in Houston, TX
Active
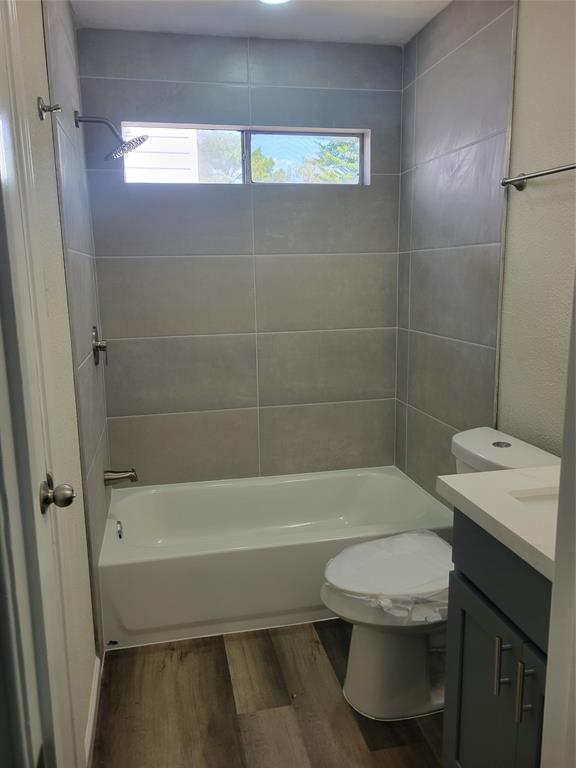
$185,000
3
bds
|
0
ba
|
1,042
sqft
|
built
1984
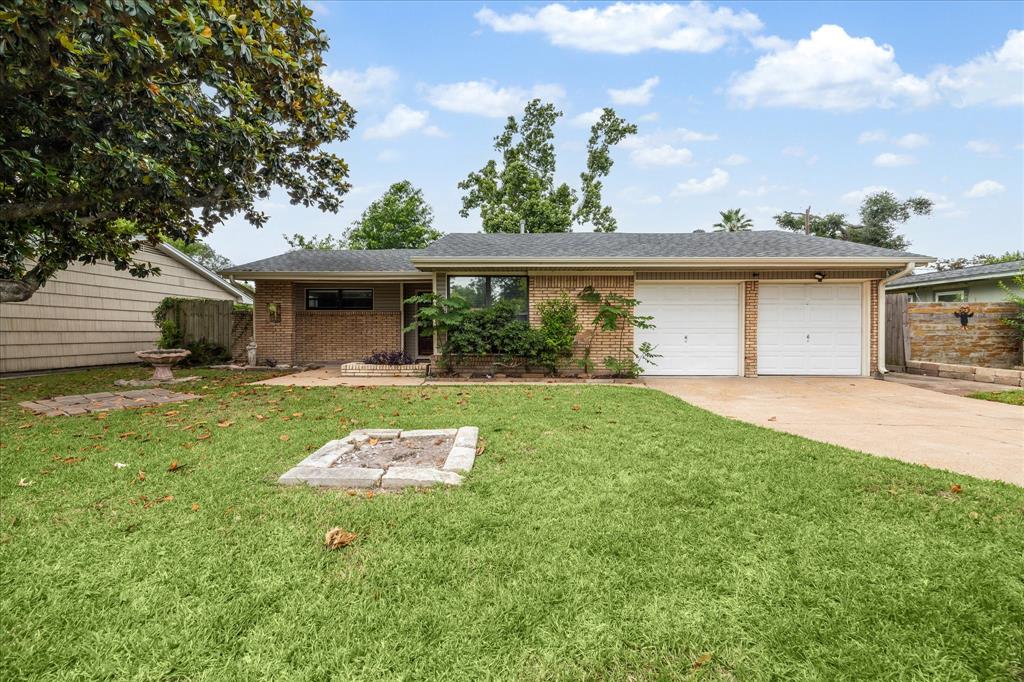
11544 Springshire Dr, Houston, TX 77066
$244
Cash flow
6.9%
Cash-on-Cash Return
7.9%
Cap rate
1.0%
Rent to Value Ratio
Active
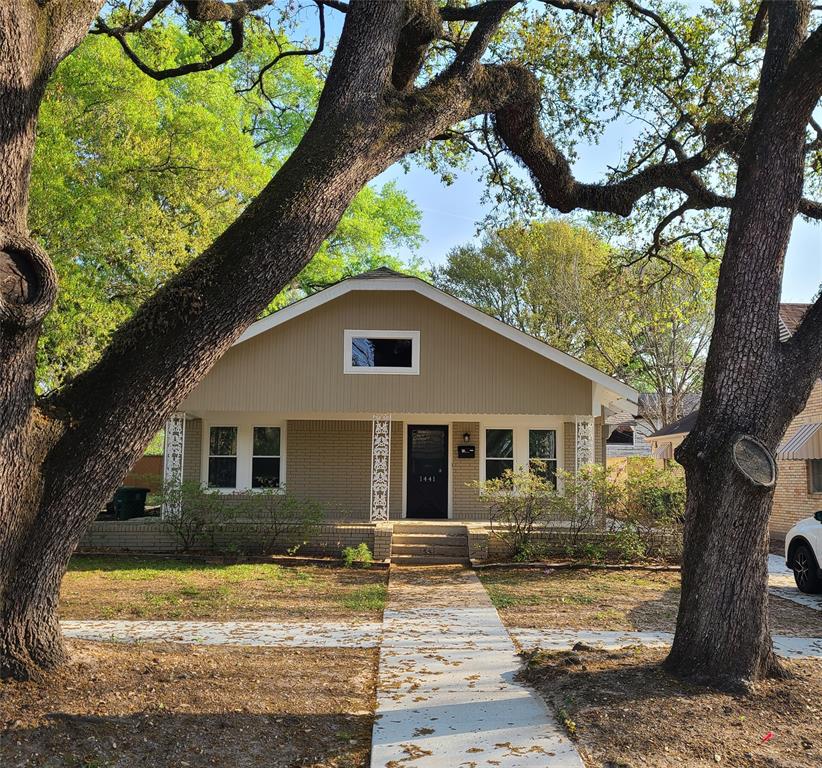
$399,000
3
bds
|
0
ba
|
1,856
sqft
|
built
1939
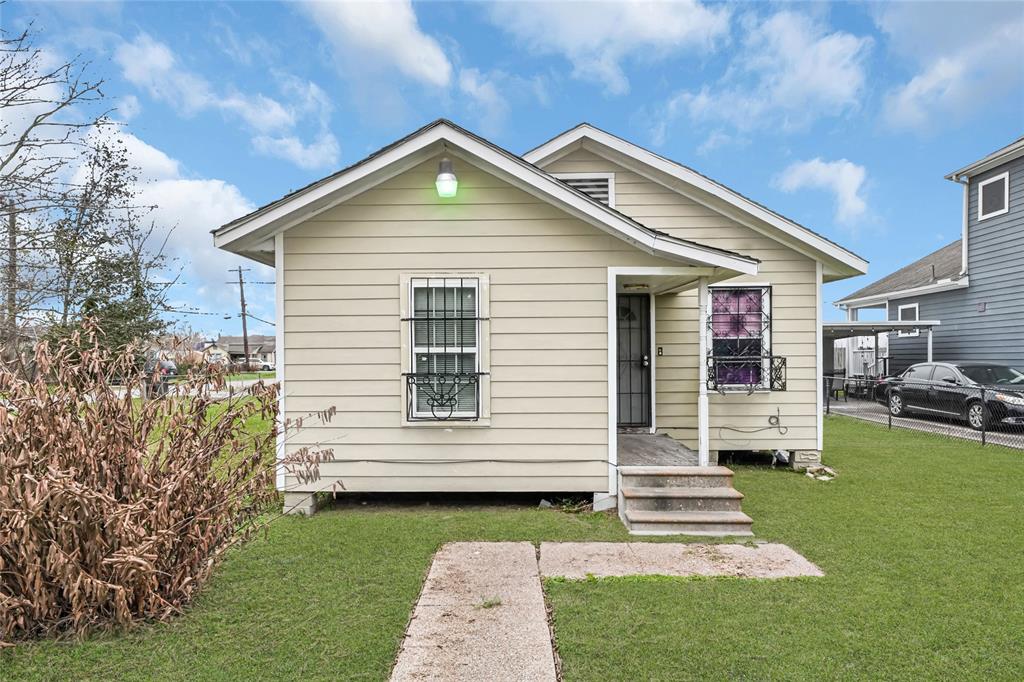
1441 Lawson St, Houston, TX 77023
$-364
Cash flow
-4.8%
Cash-on-Cash Return
5.2%
Cap rate
0.6%
Rent to Value Ratio
8,537 out of 8,983 properties for sale in Houston, TX
Limited Results Shown
Create a free account, or log in to reveal all property listings and enjoy the complete experience.
Active
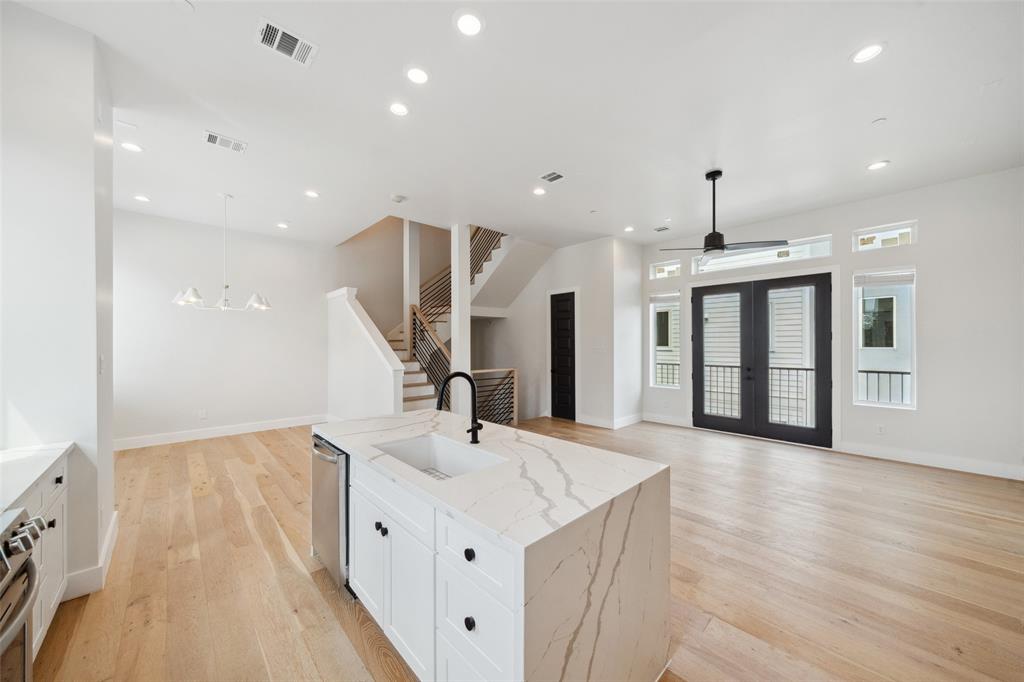
$525,000
3
bds
|
0
ba
|
2,632
sqft
|
built
2016
1005 Kern St, Houston, TX 77009
$-896
Cash flow
-8.9%
Cash-on-Cash Return
4.2%
Cap rate
0.7%
Rent to Value Ratio
Active
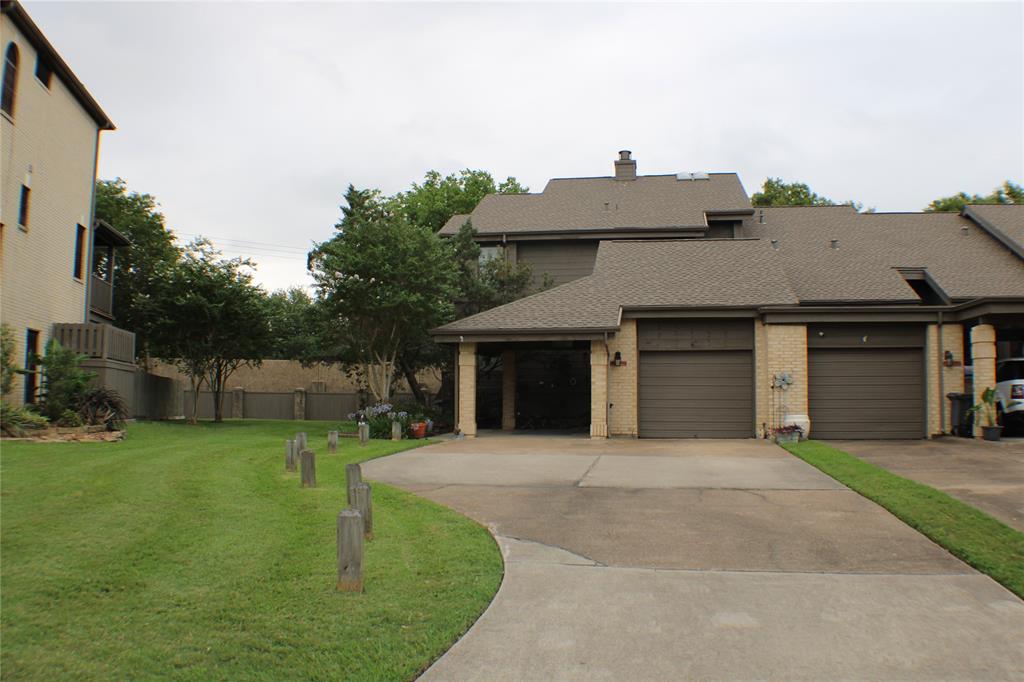
$349,900
3
bds
|
0
ba
|
2,121
sqft
|
built
1983
2619 Sailboat Dr, Houston, TX 77058
$-1,053
Cash flow
-15.7%
Cash-on-Cash Return
2.7%
Cap rate
0.8%
Rent to Value Ratio
Active
$379,000
3
bds
|
0
ba
|
1,189
sqft
|
built
1956
2009 Sedgie Dr, Houston, TX 77080
$-1,007
Cash flow
-13.9%
Cash-on-Cash Return
3.1%
Cap rate
0.5%
Rent to Value Ratio
Active
$349,900
4
bds
|
0
ba
|
2,737
sqft
|
built
1991
16526 Battlecreek Dr, Houston, TX 77095
$-817
Cash flow
-12.2%
Cash-on-Cash Return
3.5%
Cap rate
0.7%
Rent to Value Ratio
Active
$349,990
3
bds
|
0
ba
|
2,402
sqft
|
built
2022
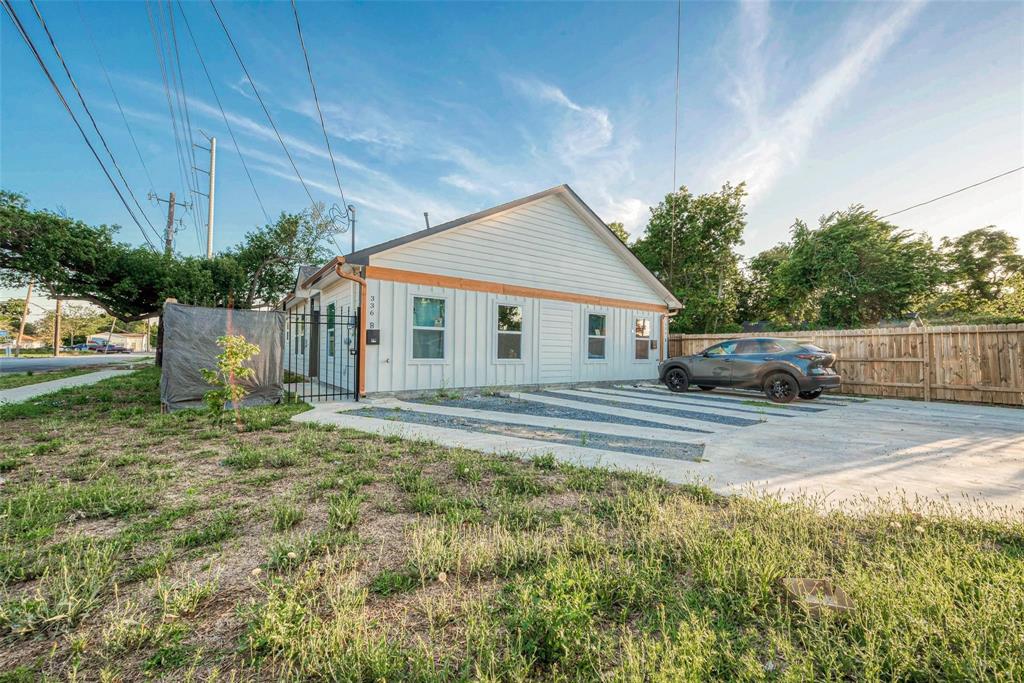
336 De Haven St, Houston, TX 77029
$-1,208
Cash flow
-18.0%
Cash-on-Cash Return
2.1%
Cap rate
0.5%
Rent to Value Ratio
Active
$775,000
4
bds
|
0
ba
|
2,708
sqft
|
built
1952
8707 Linkmeadow Ln, Houston, TX 77025
$-2,267
Cash flow
-15.3%
Cash-on-Cash Return
2.8%
Cap rate
0.5%
Rent to Value Ratio
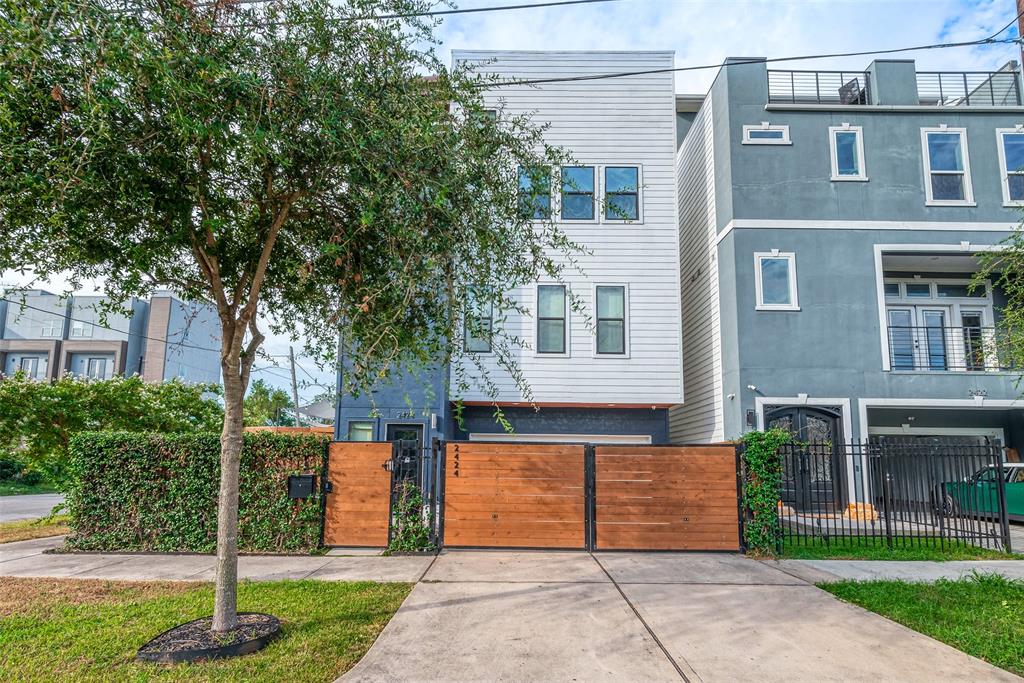
Active
$449,786
3
bds
|
0
ba
|
2,393
sqft
|
built
2016
2424 Hadley St, Houston, TX 77003
$-916
Cash flow
-10.6%
Cash-on-Cash Return
3.8%
Cap rate
0.7%
Rent to Value Ratio
Active
$399,000
3
bds
|
0
ba
|
1,856
sqft
|
built
1939
1441 Lawson St, Houston, TX 77023
$-364
Cash flow
-4.8%
Cash-on-Cash Return
5.2%
Cap rate
0.6%
Rent to Value Ratio

Active
$395,000
3
bds
|
0
ba
|
1,937
sqft
|
built
1980
14 Greenway Plz, Houston, TX 77046
$-2,211
Cash flow
-29.2%
Cash-on-Cash Return
-0.4%
Cap rate
0.9%
Rent to Value Ratio

Active
$1,500,000
6
bds
|
0
ba
|
3,481
sqft
|
built
2000
3201 White Oak Dr, Houston, TX 77007
$-5,251
Cash flow
-18.3%
Cash-on-Cash Return
2.1%
Cap rate
0.3%
Rent to Value Ratio
Active
$999,000
5
bds
|
0
ba
|
3,924
sqft
|
built
2013
3302 Rochdale St, Houston, TX 77025
$-4,192
Cash flow
-21.9%
Cash-on-Cash Return
1.2%
Cap rate
0.4%
Rent to Value Ratio

Active
$345,000
2
bds
|
0
ba
|
1,500
sqft
|
built
1977
701 Bering Dr, Houston, TX 77057
$-1,496
Cash flow
-22.6%
Cash-on-Cash Return
1.1%
Cap rate
0.7%
Rent to Value Ratio
Active
$1,199,000
4
bds
|
0
ba
|
3,893
sqft
|
built
2007
5513 Val Verde St, Houston, TX 77056
$-3,619
Cash flow
-15.7%
Cash-on-Cash Return
2.7%
Cap rate
0.5%
Rent to Value Ratio
Active
$387,900
5
bds
|
0
ba
|
2,521
sqft
|
built
2002
9323 Windy Spring Ln, Houston, TX 77089
$-919
Cash flow
-12.4%
Cash-on-Cash Return
3.4%
Cap rate
0.7%
Rent to Value Ratio
Active
$799,000
2
bds
|
0
ba
|
1,000
sqft
|
built
1956
1240 W 26th St, Houston, TX 77008
$-3,606
Cash flow
-23.5%
Cash-on-Cash Return
0.9%
Cap rate
0.3%
Rent to Value Ratio
Active
$545,750
3
bds
|
0
ba
|
3,221
sqft
|
built
2022
3231 Real St, Houston, TX 77087
$-2,181
Cash flow
-20.9%
Cash-on-Cash Return
1.5%
Cap rate
0.4%
Rent to Value Ratio
Active
$249,900
3
bds
|
0
ba
|
1,939
sqft
|
built
2016
17035 Wilthorne Gardens Ct, Houston, TX 77084
$-661
Cash flow
-13.8%
Cash-on-Cash Return
3.1%
Cap rate
0.8%
Rent to Value Ratio
Active
$175,000
2
bds
|
0
ba
|
1,600
sqft
|
built
1984
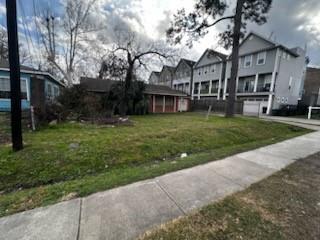
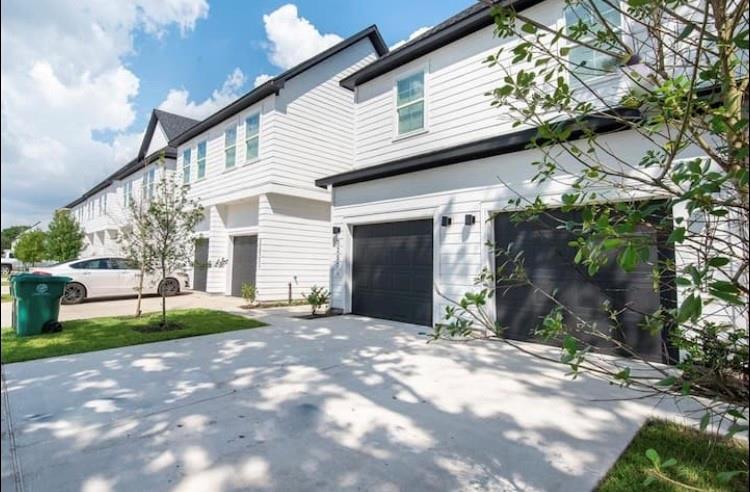
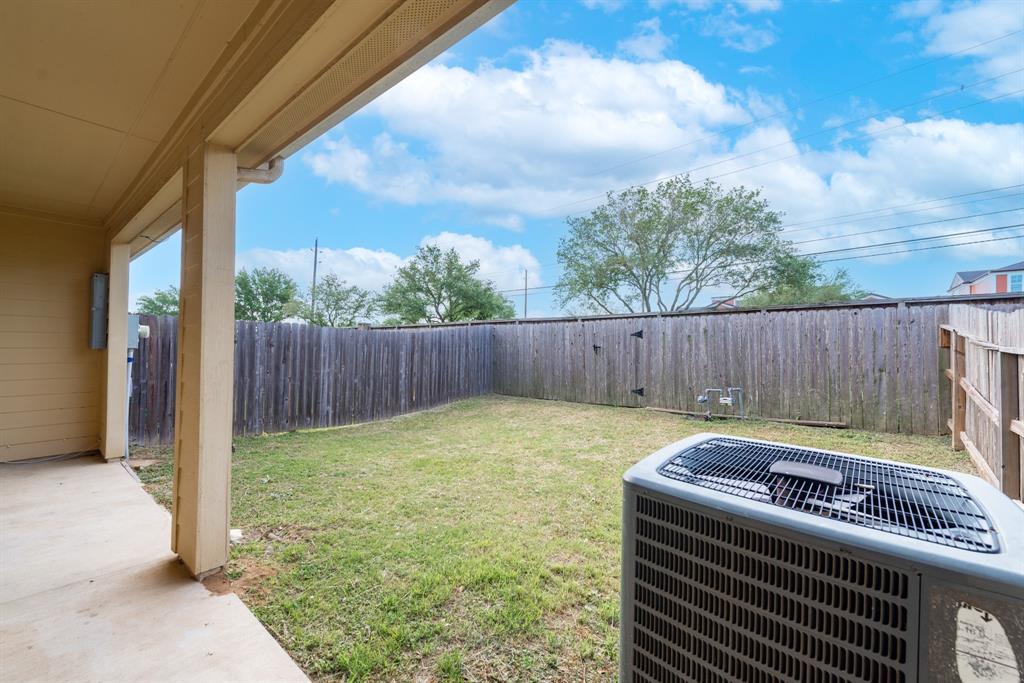
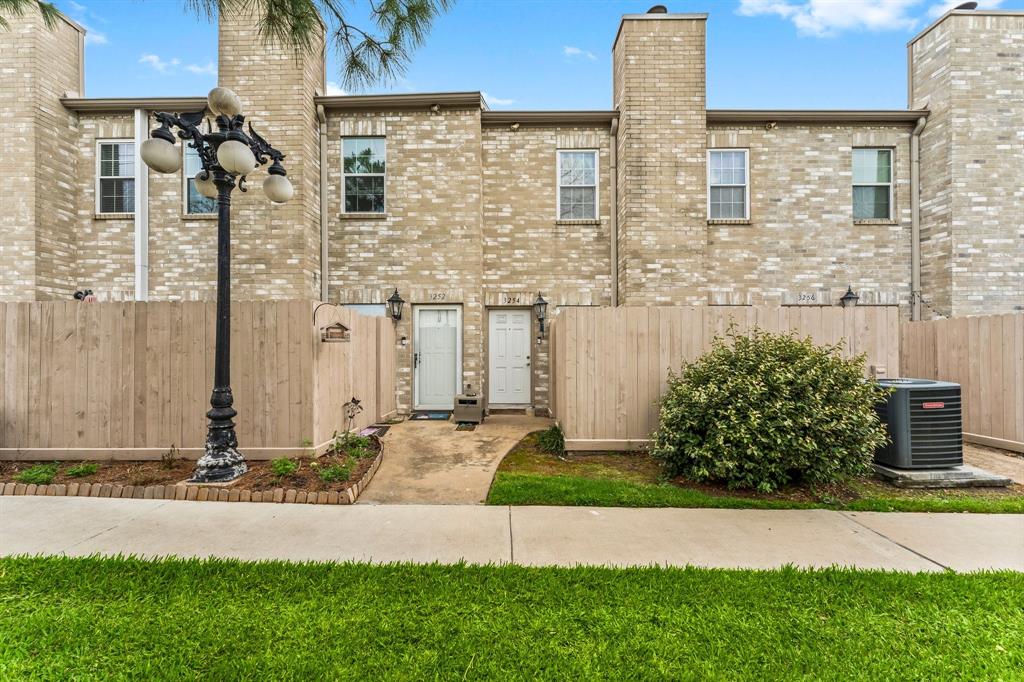
3254 Holly Hall St, Houston, TX 77054
$-756
Cash flow
-22.5%
Cash-on-Cash Return
1.1%
Cap rate
1.0%
Rent to Value Ratio

Active
$1,600,000
5
bds
|
0
ba
|
3,747
sqft
|
built
2012
1024 Waverly St, Houston, TX 77008
$-6,021
Cash flow
-19.6%
Cash-on-Cash Return
1.8%
Cap rate
0.4%
Rent to Value Ratio
Active
$499,000
3
bds
|
0
ba
|
2,227
sqft
|
built
2013
5733 Petty St, Houston, TX 77007
$-1,222
Cash flow
-12.8%
Cash-on-Cash Return
3.3%
Cap rate
0.6%
Rent to Value Ratio
Pending
$689,990
4
bds
|
0
ba
|
1,508
sqft
|
built
1920
824 Cortlandt St, Houston, TX 77007
$-3,356
Cash flow
-25.4%
Cash-on-Cash Return
0.4%
Cap rate
0.4%
Rent to Value Ratio
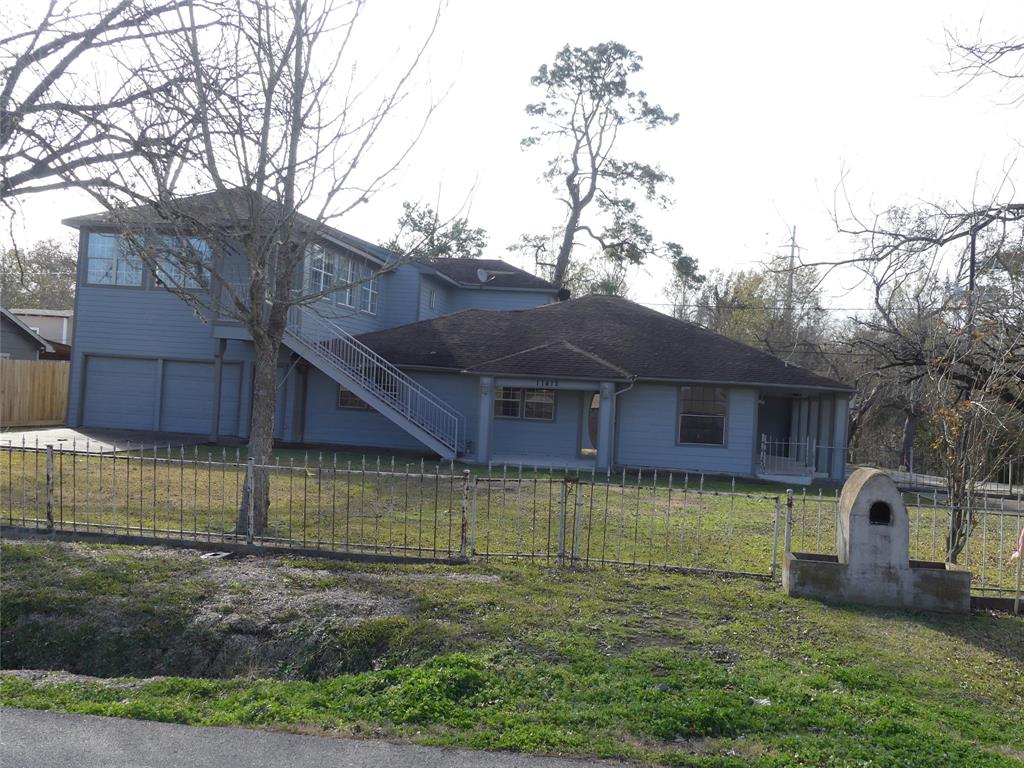
Active
$450,000
9
bds
|
0
ba
|
4,555
sqft
|
built
1960
11412 Lane St, Houston, TX 77029
$-829
Cash flow
-9.6%
Cash-on-Cash Return
4.1%
Cap rate
0.7%
Rent to Value Ratio
Active
$315,000
3
bds
|
0
ba
|
1,237
sqft
|
built
1932
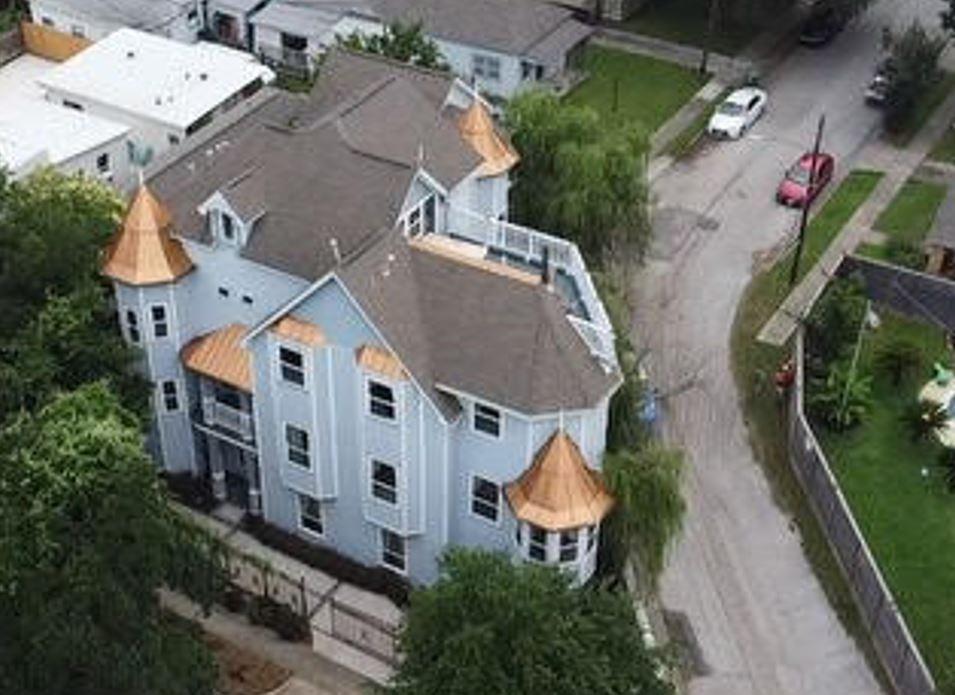
1818 Ryon St, Houston, TX 77009
$-979
Cash flow
-16.2%
Cash-on-Cash Return
2.6%
Cap rate
0.6%
Rent to Value Ratio
Active
$799,900
3
bds
|
0
ba
|
2,745
sqft
|
built
1973
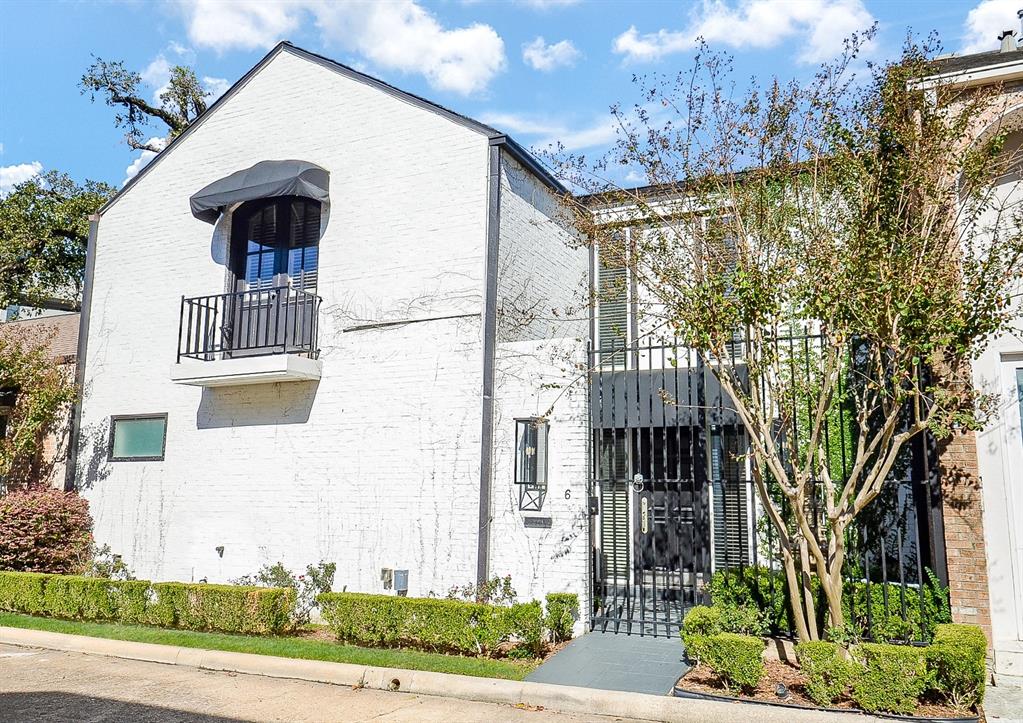
6 River Hollow Ln, Houston, TX 77027
$-2,181
Cash flow
-14.2%
Cash-on-Cash Return
3.0%
Cap rate
0.7%
Rent to Value Ratio
Active
$185,000
3
bds
|
0
ba
|
1,042
sqft
|
built
1984
11544 Springshire Dr, Houston, TX 77066
$244
Cash flow
6.9%
Cash-on-Cash Return
7.9%
Cap rate
1.0%
Rent to Value Ratio
Active
$429,000
4
bds
|
0
ba
|
1,864
sqft
|
built
1971
9711 Derrik Dr, Houston, TX 77080
$-1,239
Cash flow
-15.1%
Cash-on-Cash Return
2.8%
Cap rate
0.5%
Rent to Value Ratio
Active
$250,000
3
bds
|
0
ba
|
840
sqft
|
built
1935
2607 Milwaukee St, Houston, TX 77026
$-423
Cash flow
-8.8%
Cash-on-Cash Return
4.3%
Cap rate
0.6%
Rent to Value Ratio
Active
$2,295,000
7
bds
|
0
ba
|
6,598
sqft
|
built
2008
3012 Houston Ave, Houston, TX 77009
$-8,971
Cash flow
-20.4%
Cash-on-Cash Return
1.6%
Cap rate
0.3%
Rent to Value Ratio

Active
$369,900
3
bds
|
0
ba
|
1,637
sqft
|
built
2006
2737 Sherwin St, Houston, TX 77007
$-958
Cash flow
-13.5%
Cash-on-Cash Return
3.2%
Cap rate
0.7%
Rent to Value Ratio
Active
$679,900
4
bds
|
0
ba
|
2,692
sqft
|
built
1967
12420 Wallisville Rd, Houston, TX 77013
$-2,748
Cash flow
-21.1%
Cash-on-Cash Return
1.4%
Cap rate
0.5%
Rent to Value Ratio
Active
$199,000
2
bds
|
0
ba
|
1,764
sqft
|
built
1963
3300 Yorktown St, Houston, TX 77056
$-1,311
Cash flow
-34.4%
Cash-on-Cash Return
-1.6%
Cap rate
1.0%
Rent to Value Ratio
Active
$2,449,000
4
bds
|
0
ba
|
4,837
sqft
|
built
2013
56 Audubon Hollow Ln, Houston, TX 77027
$-7,331
Cash flow
-15.6%
Cash-on-Cash Return
2.7%
Cap rate
0.4%
Rent to Value Ratio
Active
$385,000
4
bds
|
0
ba
|
2,636
sqft
|
built
2016
13705 Northline Lake Dr, Houston, TX 77044
$-1,153
Cash flow
-15.6%
Cash-on-Cash Return
2.7%
Cap rate
0.7%
Rent to Value Ratio
Active
$675,000
3
bds
|
0
ba
|
2,650
sqft
|
built
2024
5706 Fairdale Ln, Houston, TX 77057
$-846
Cash flow
-6.5%
Cash-on-Cash Return
4.8%
Cap rate
0.8%
Rent to Value Ratio
Active
$379,000
2
bds
|
0
ba
|
1,760
sqft
|
built
1973
5803 Lynbrook Dr, Houston, TX 77057
$-992
Cash flow
-13.7%
Cash-on-Cash Return
3.1%
Cap rate
0.6%
Rent to Value Ratio
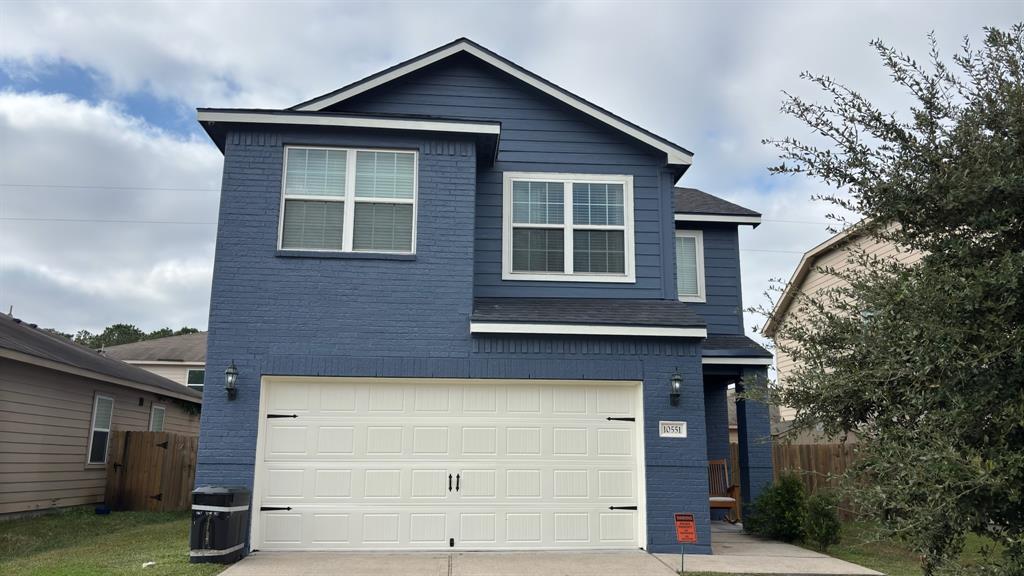
Active
$330,000
3
bds
|
0
ba
|
1,972
sqft
|
built
2017
10551 Logger Pine Trl, Houston, TX 77088
$-967
Cash flow
-15.3%
Cash-on-Cash Return
2.8%
Cap rate
0.6%
Rent to Value Ratio
Active
$2,499,999
4
bds
|
0
ba
|
5,336
sqft
|
built
2008
4020 Sul Ross St, Houston, TX 77027
$-11,120
Cash flow
-23.2%
Cash-on-Cash Return
0.9%
Cap rate
0.3%
Rent to Value Ratio
Active
$399,000
2
bds
|
0
ba
|
1,281
sqft
|
built
1928
713 Mc Intosh St, Houston, TX 77009
$-1,144
Cash flow
-15.0%
Cash-on-Cash Return
2.8%
Cap rate
0.6%
Rent to Value Ratio
Active
$346,500
4
bds
|
0
ba
|
1,957
sqft
|
built
1997
9143 Bearcove Cir, Houston, TX 77064
$-901
Cash flow
-13.6%
Cash-on-Cash Return
3.2%
Cap rate
0.6%
Rent to Value Ratio
Active
$2,095,000
5
bds
|
0
ba
|
5,910
sqft
|
built
2006
4506 Bryn Mawr Ln, Houston, TX 77027
$-9,461
Cash flow
-23.6%
Cash-on-Cash Return
0.9%
Cap rate
0.4%
Rent to Value Ratio