Hyrum, UT Investment Properties for Sale
Browse homes for sale and investment properties in Hyrum, UT. Refine your search by price, property type, or more.
Best cash flowing properties in Hyrum, UT
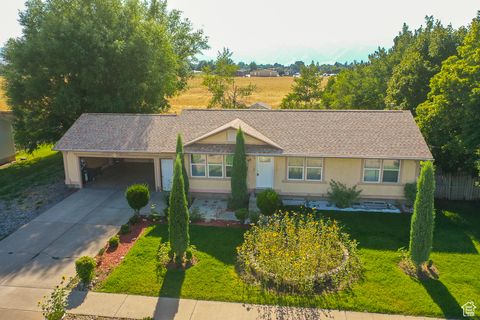
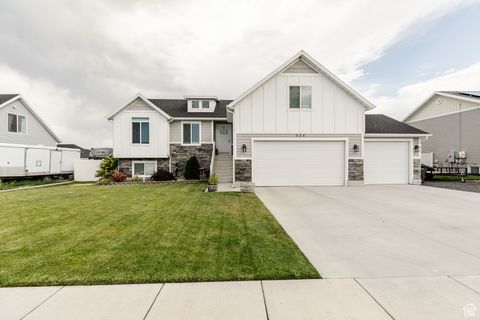
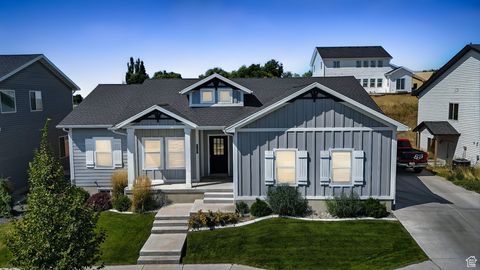
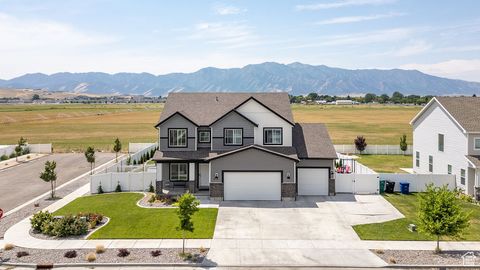
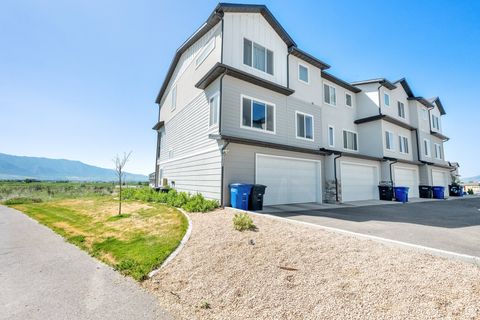
Active
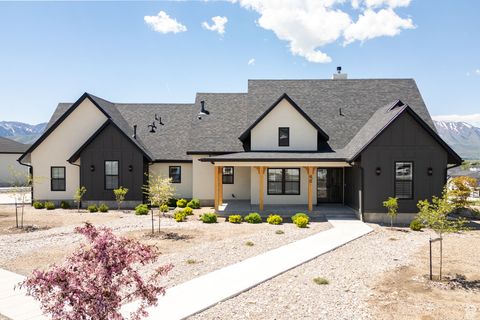
$369,900
5
bds
|
3
ba
|
2,112
sqft
|
built
1993
56 S 1000 E, Hyrum, UT 84319
$-357
Cash flow
-5.0%
Cash-on-Cash Return
4.5%
Cap rate
0.6%
Rent to Value Ratio
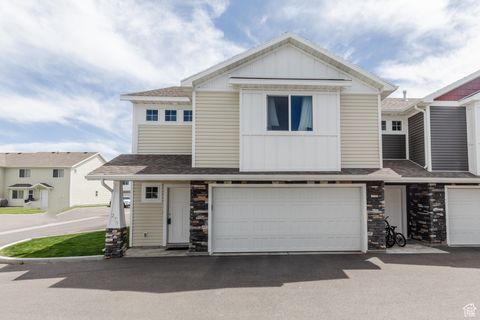
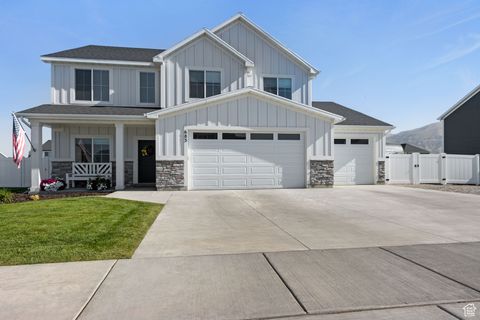
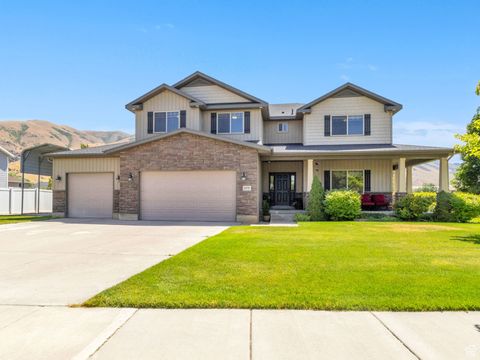
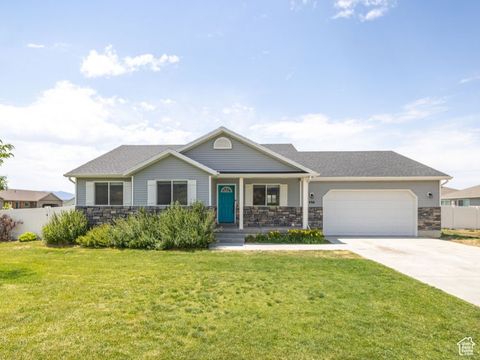
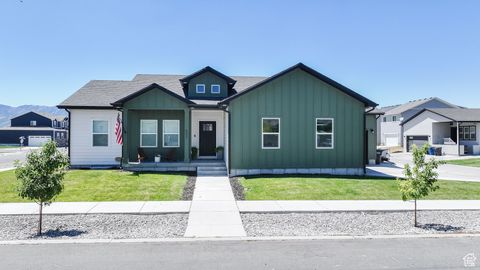
Active
$324,900
3
bds
|
3
ba
|
1,798
sqft
|
built
2018
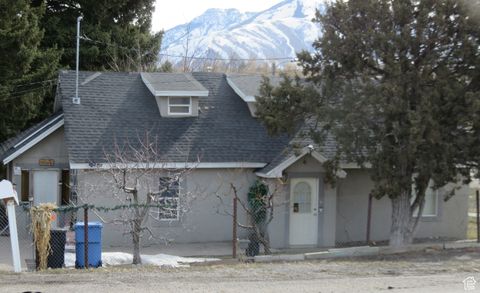
275 W 70 N, Hyrum, UT 84319
$-381
Cash flow
-6.1%
Cash-on-Cash Return
4.3%
Cap rate
0.6%
Rent to Value Ratio
31 out of 34 properties for sale in Hyrum, UT
Limited Results Shown
Create a free account, or log in to reveal all property listings and enjoy the complete experience.
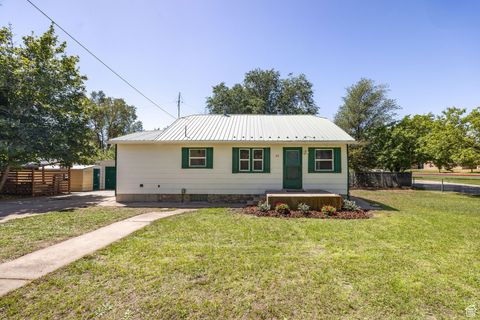
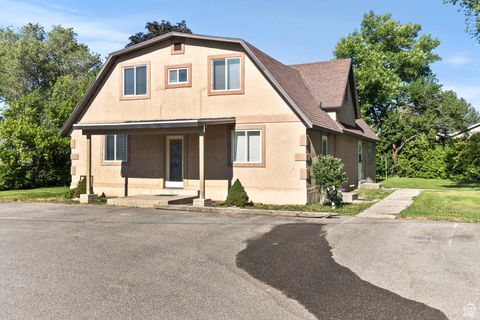
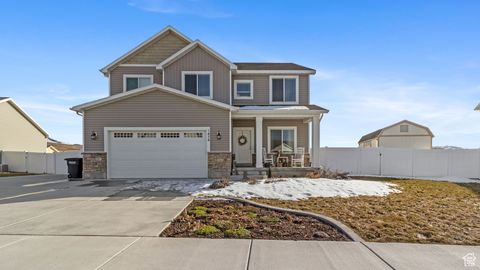
Active
$399,900
4
bds
|
2
ba
|
1,640
sqft
|
built
1953
85 N Center St, Hyrum, UT 84319
$-1,087
Cash flow
-14.2%
Cash-on-Cash Return
2.4%
Cap rate
0.4%
Rent to Value Ratio
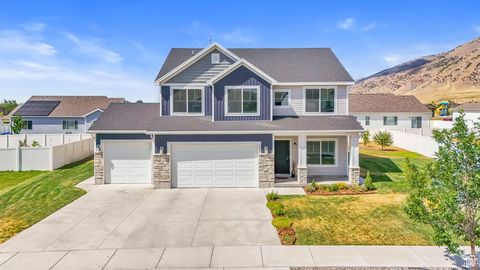
Active
$649,900
5
bds
|
2
ba
|
3,370
sqft
|
built
1919
325 W 300 N, Hyrum, UT 84319
$-1,876
Cash flow
-15.1%
Cash-on-Cash Return
2.2%
Cap rate
0.3%
Rent to Value Ratio
Active
$585,000
4
bds
|
2
ba
|
3,386
sqft
|
built
2018
624 W 225 N, Hyrum, UT 84319
$-993
Cash flow
-8.9%
Cash-on-Cash Return
3.6%
Cap rate
0.5%
Rent to Value Ratio
Active
$610,000
4
bds
|
3
ba
|
2,659
sqft
|
built
2024
683 E 1200 S, Hyrum, UT 84319
$-1,059
Cash flow
-9.1%
Cash-on-Cash Return
3.6%
Cap rate
0.5%
Rent to Value Ratio
Active
$410,000
3
bds
|
1
ba
|
2,008
sqft
|
built
1942
14 S 400 W, Hyrum, UT 84319
$-687
Cash flow
-8.7%
Cash-on-Cash Return
3.7%
Cap rate
0.5%
Rent to Value Ratio
Active
$520,000
4
bds
|
3
ba
|
2,393
sqft
|
built
2018
1345 E 340 S, Hyrum, UT 84319
$-1,167
Cash flow
-11.7%
Cash-on-Cash Return
3.0%
Cap rate
0.4%
Rent to Value Ratio
Active
$499,999
3
bds
|
2
ba
|
2,810
sqft
|
built
2019
798 W 50 N, Hyrum, UT 84319
$-831
Cash flow
-8.7%
Cash-on-Cash Return
3.7%
Cap rate
0.5%
Rent to Value Ratio
Active
$314,900
2
bds
|
1
ba
|
971
sqft
|
built
1909
279 W 300 N, Hyrum, UT 84319
$-482
Cash flow
-8.0%
Cash-on-Cash Return
3.8%
Cap rate
0.5%
Rent to Value Ratio
Active
$780,000
5
bds
|
5
ba
|
4,550
sqft
|
built
2007
177 S 1170 E, Hyrum, UT 84319
$-1,967
Cash flow
-13.2%
Cash-on-Cash Return
2.7%
Cap rate
0.4%
Rent to Value Ratio
Active
$384,900
4
bds
|
4
ba
|
2,366
sqft
|
built
2022
667 E 730 N, Hyrum, UT 84319
$-598
Cash flow
-8.1%
Cash-on-Cash Return
3.8%
Cap rate
0.6%
Rent to Value Ratio
Active
$679,900
5
bds
|
4
ba
|
3,811
sqft
|
built
2020
412 S 1170 E, Hyrum, UT 84319
$-1,955
Cash flow
-15.0%
Cash-on-Cash Return
2.2%
Cap rate
0.3%
Rent to Value Ratio
Active
$520,000
6
bds
|
3
ba
|
2,764
sqft
|
built
2020
496 S 1600 E, Hyrum, UT 84319
$-1,373
Cash flow
-13.8%
Cash-on-Cash Return
2.5%
Cap rate
0.3%
Rent to Value Ratio
Active
$599,900
5
bds
|
3
ba
|
3,018
sqft
|
built
2018
516 S 770 E, Hyrum, UT 84319
$-1,349
Cash flow
-11.7%
Cash-on-Cash Return
3.0%
Cap rate
0.4%
Rent to Value Ratio
Active
$535,000
4
bds
|
3
ba
|
2,670
sqft
|
built
1966
572 W 300 N, Hyrum, UT 84319
$-1,113
Cash flow
-10.9%
Cash-on-Cash Return
3.2%
Cap rate
0.4%
Rent to Value Ratio
Active
$384,000
4
bds
|
4
ba
|
2,492
sqft
|
built
2022
672 E 730 N, Hyrum, UT 84319
$-580
Cash flow
-7.9%
Cash-on-Cash Return
3.9%
Cap rate
0.5%
Rent to Value Ratio
Active
$460,000
5
bds
|
5
ba
|
3,545
sqft
|
built
1903
165 N 800 E, Hyrum, UT 84319
$-633
Cash flow
-7.2%
Cash-on-Cash Return
4.0%
Cap rate
0.5%
Rent to Value Ratio
Active
$669,000
5
bds
|
3
ba
|
3,440
sqft
|
built
2020
460 E 535 S, Hyrum, UT 84319
$-1,963
Cash flow
-15.3%
Cash-on-Cash Return
2.2%
Cap rate
0.3%
Rent to Value Ratio
Active
$529,000
4
bds
|
2
ba
|
2,580
sqft
|
built
2017
45 N Center St, Hyrum, UT 84319
$-1,138
Cash flow
-11.2%
Cash-on-Cash Return
3.1%
Cap rate
0.4%
Rent to Value Ratio
Active
$329,900
3
bds
|
3
ba
|
1,445
sqft
|
built
2023
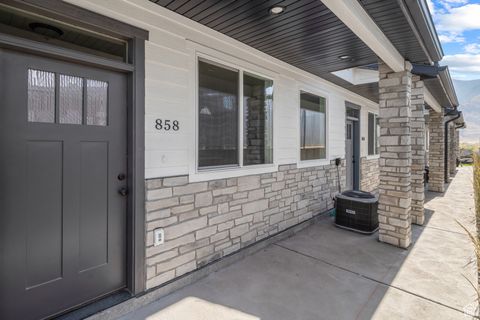
858 E 250 N, Hyrum, UT 84319
$-397
Cash flow
-6.3%
Cash-on-Cash Return
4.2%
Cap rate
0.6%
Rent to Value Ratio
Active
$699,500
6
bds
|
3
ba
|
4,175
sqft
|
built
1960
131 E 100 N, Hyrum, UT 84319
$-2,260
Cash flow
-16.9%
Cash-on-Cash Return
1.8%
Cap rate
0.3%
Rent to Value Ratio
Active
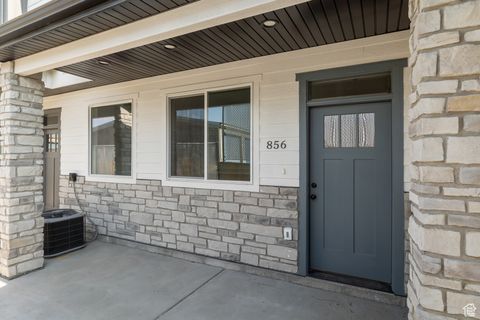
$329,900
3
bds
|
3
ba
|
1,445
sqft
|
built
2023
856 E 250 N, Hyrum, UT 84319
$-397
Cash flow
-6.3%
Cash-on-Cash Return
4.2%
Cap rate
0.6%
Rent to Value Ratio
Active
$369,900
3
bds
|
2
ba
|
1,876
sqft
|
built
1988
645 N 600 E, Hyrum, UT 84319
$-494
Cash flow
-7.0%
Cash-on-Cash Return
4.1%
Cap rate
0.5%
Rent to Value Ratio
Active
$789,000
3
bds
|
3
ba
|
1,823
sqft
|
built
2023
48 S 650 W, Hyrum, UT 84319
$-2,430
Cash flow
-16.1%
Cash-on-Cash Return
2.0%
Cap rate
0.3%
Rent to Value Ratio
Active
$490,000
3
bds
|
2
ba
|
2,791
sqft
|
built
2022
602 W 20 N, Hyrum, UT 84319
$-814
Cash flow
-8.7%
Cash-on-Cash Return
3.7%
Cap rate
0.5%
Rent to Value Ratio
Active
$359,000
4
bds
|
3
ba
|
2,023
sqft
|
built
2023
633 E 730 N, Hyrum, UT 84319
$-433
Cash flow
-6.3%
Cash-on-Cash Return
4.2%
Cap rate
0.6%
Rent to Value Ratio
Active
$599,900
4
bds
|
3
ba
|
3,771
sqft
|
built
2020
1474 E 480 S, Hyrum, UT 84319
$-1,573
Cash flow
-13.7%
Cash-on-Cash Return
2.5%
Cap rate
0.4%
Rent to Value Ratio
Active
$575,000
4
bds
|
3
ba
|
3,295
sqft
|
built
2000
338 N 1090 W, Hyrum, UT 84319
$-1,382
Cash flow
-12.5%
Cash-on-Cash Return
2.8%
Cap rate
0.4%
Rent to Value Ratio
Active
$380,000
4
bds
|
1
ba
|
1,510
sqft
|
built
1926
6 N 400 W, Hyrum, UT 84319
$-642
Cash flow
-8.8%
Cash-on-Cash Return
3.7%
Cap rate
0.5%
Rent to Value Ratio
Active
$329,900
3
bds
|
3
ba
|
1,785
sqft
|
built
2017
259 W 40 N, Hyrum, UT 84319
$-391
Cash flow
-6.2%
Cash-on-Cash Return
4.3%
Cap rate
0.6%
Rent to Value Ratio