Cook County Investment Properties for Sale
Browse homes for sale and investment properties in Cook County. Refine your search by price, property type, or more.
Best cash flowing properties in Cook County
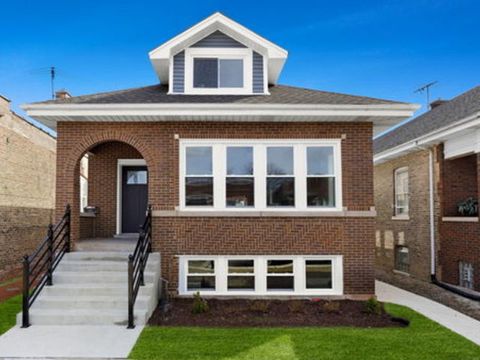
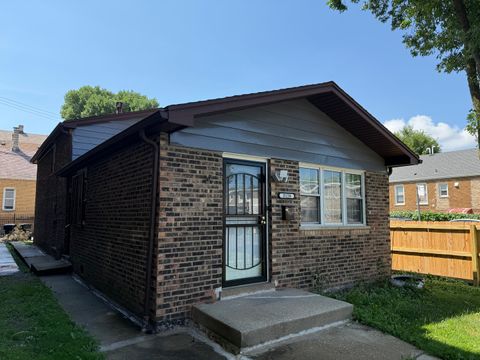
Active
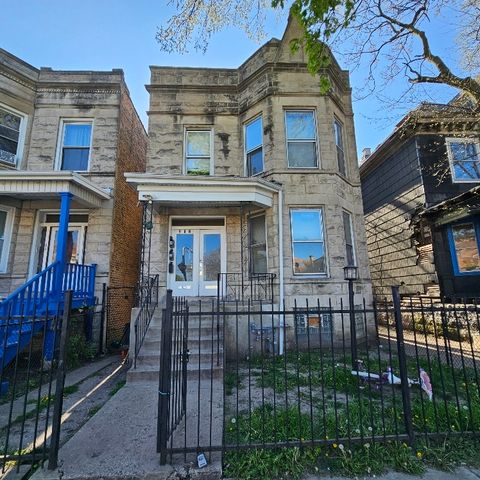
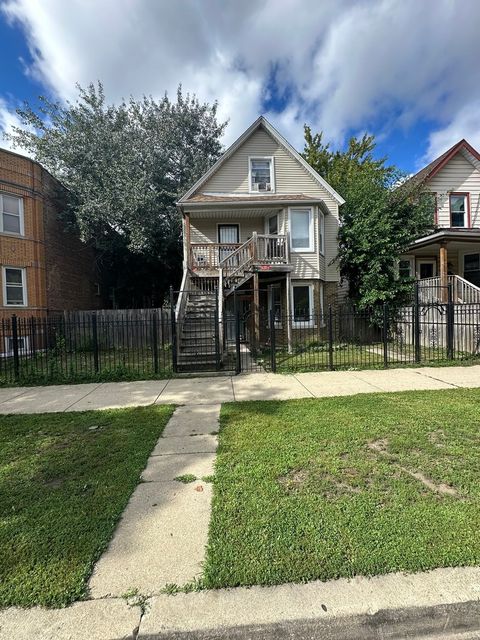
$199,900
5
bds
|
2
ba
|
0
sqft
|
built
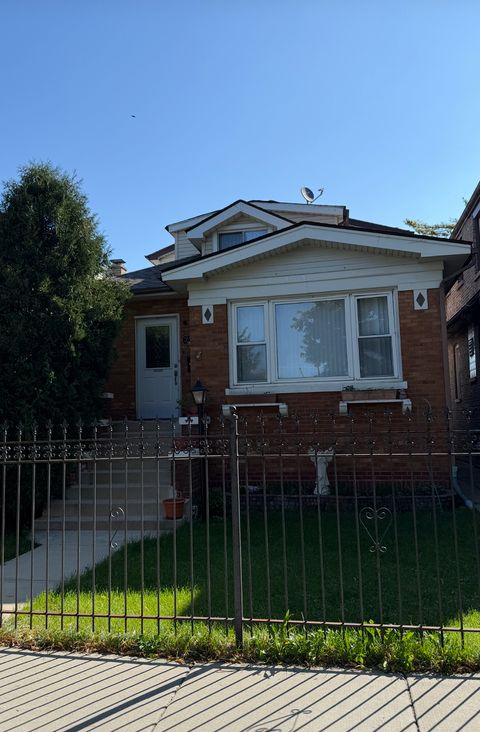
1898
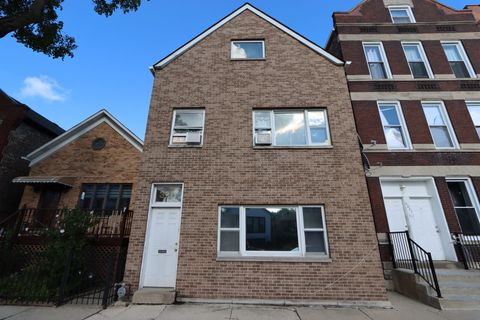
212 N Leamington Ave, Chicago, IL 60644
$480
Cash flow
12.5%
Cash-on-Cash Return
8.6%
Cap rate
1.3%
Rent to Value Ratio
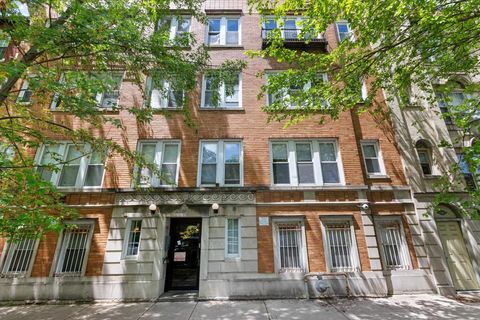
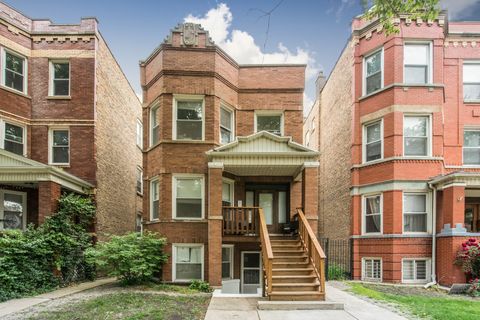
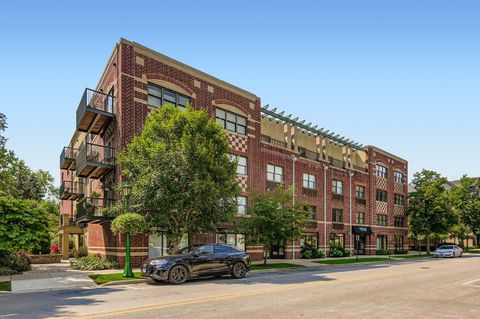
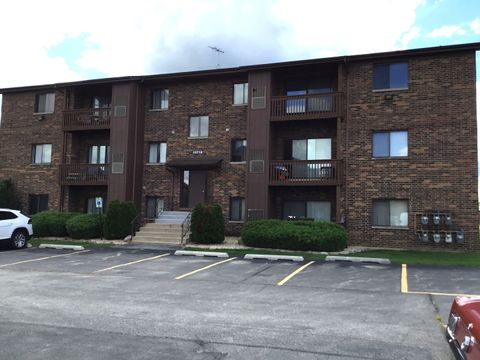
Active
$139,000
2
bds
|
1
ba
|
0
sqft
|
built
1925
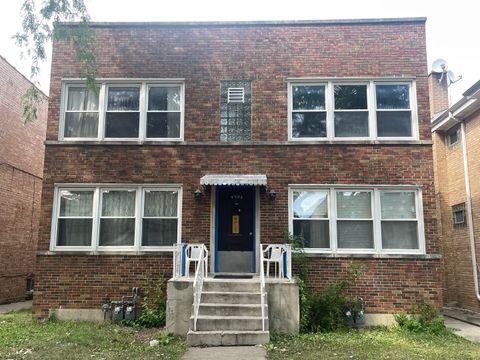
6812 N Wayne Ave, Chicago, IL 60626
$336
Cash flow
12.6%
Cash-on-Cash Return
8.6%
Cap rate
1.4%
Rent to Value Ratio
4,699 out of 5,467 properties for sale in Cook County
Limited Results Shown
Create a free account, or log in to reveal all property listings and enjoy the complete experience.

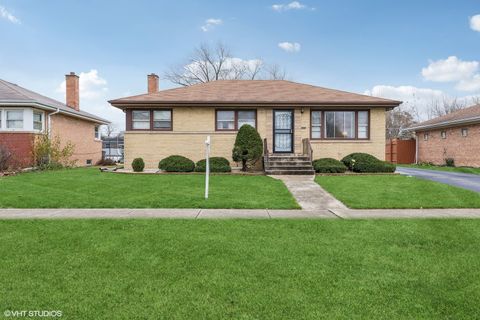
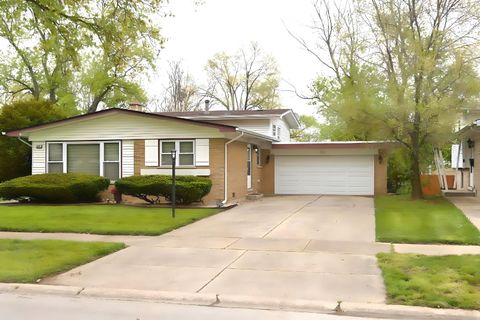
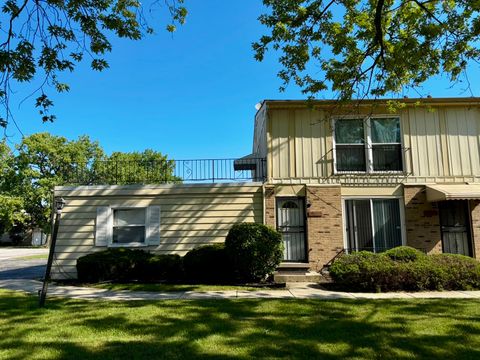
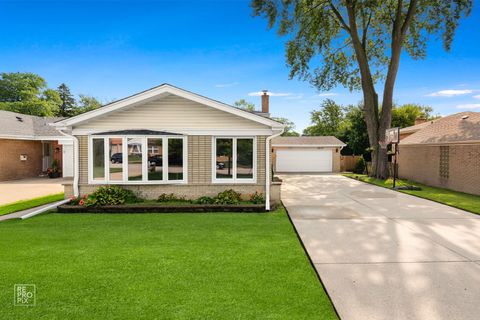
Active
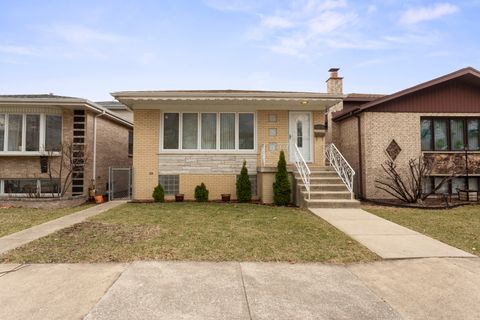
$294,900
3
bds
|
2
ba
|
1,589
sqft
|
built
1957
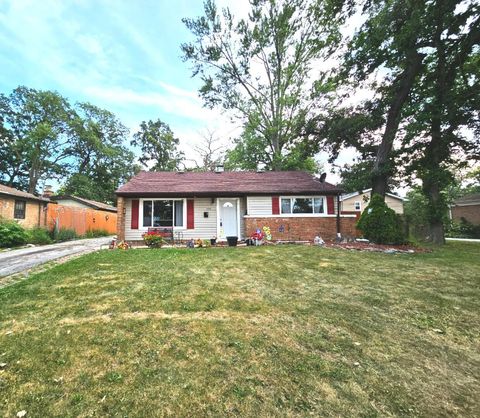
8414 S King Dr, Chicago, IL 60619
$-518
Cash flow
-9.2%
Cash-on-Cash Return
3.6%
Cap rate
0.6%
Rent to Value Ratio
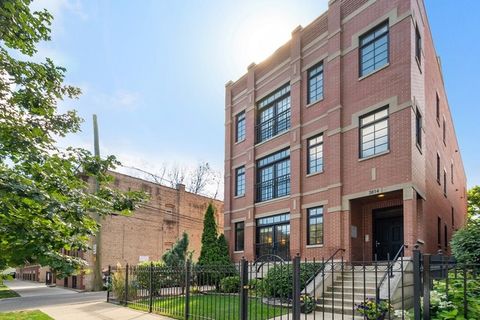
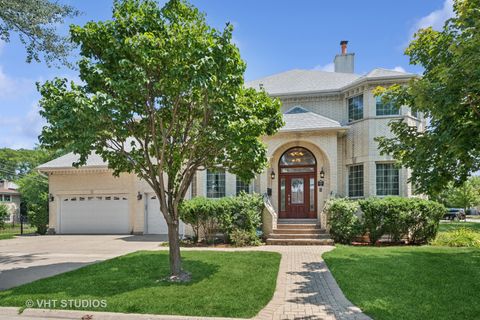
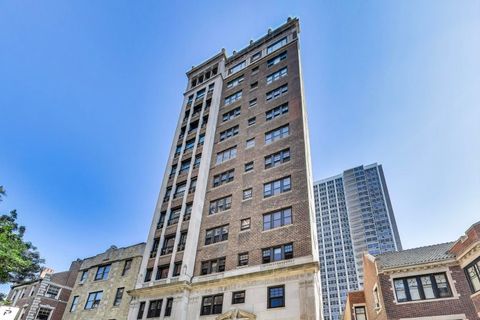
Active
$1,150,000
4
bds
|
3
ba
|
0
sqft
|
built
2001
3814 N Greenview Ave, Chicago, IL 60613
$-2,326
Cash flow
-10.6%
Cash-on-Cash Return
3.3%
Cap rate
0.6%
Rent to Value Ratio
Active
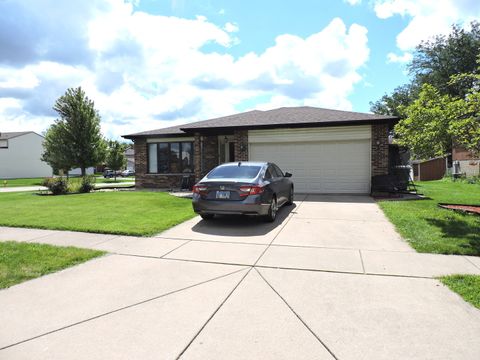
$209,900
3
bds
|
2
ba
|
1,120
sqft
|
built
1965
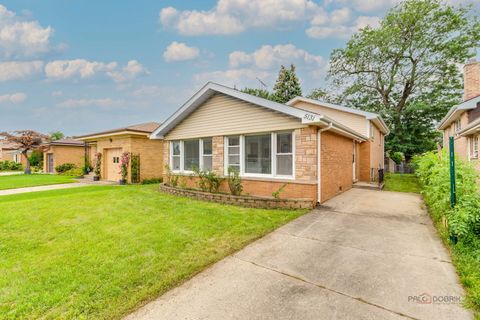
16645 Cottage Grove Ave, South Holland, IL 60473
$197
Cash flow
4.9%
Cash-on-Cash Return
6.8%
Cap rate
1.2%
Rent to Value Ratio
Active
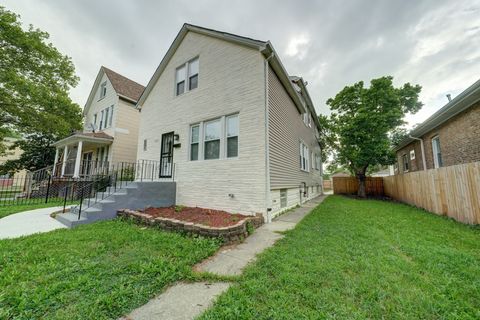
$275,000
3
bds
|
2
ba
|
1,500
sqft
|
built
1962
223 W Rainbow Dr, Glenwood, IL 60425
$181
Cash flow
3.4%
Cash-on-Cash Return
6.5%
Cap rate
1.0%
Rent to Value Ratio
Active
$1,399,000
5
bds
|
5
ba
|
7,167
sqft
|
built
2007
4858 W Chase Ave, Lincolnwood, IL 60712
$-4,629
Cash flow
-17.3%
Cash-on-Cash Return
1.7%
Cap rate
0.4%
Rent to Value Ratio
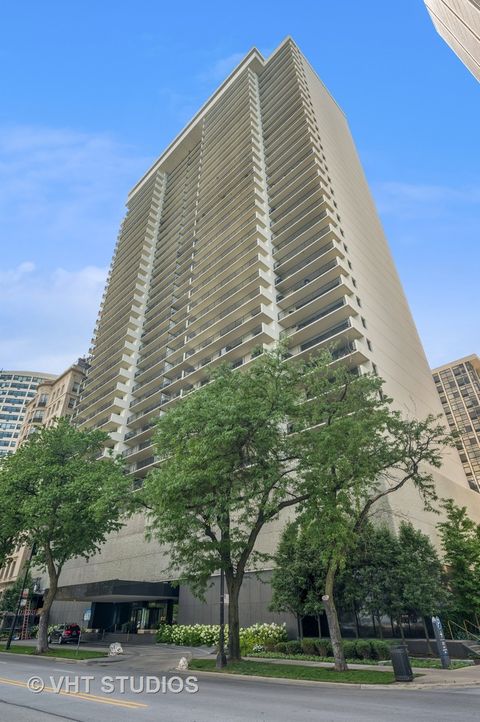
Active
$850,000
2
bds
|
2
ba
|
1,850
sqft
|
built
1967
1212 N Lake Shore Dr, Chicago, IL 60610
$-3,936
Cash flow
-24.2%
Cash-on-Cash Return
0.1%
Cap rate
0.5%
Rent to Value Ratio
Active
$229,900
3
bds
|
2
ba
|
1,864
sqft
|
built
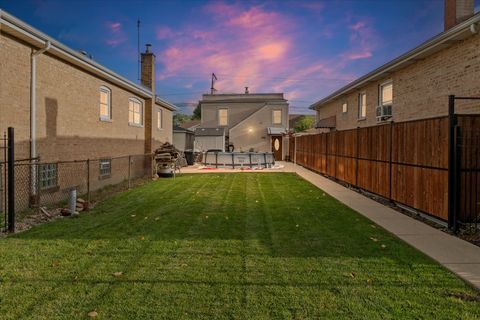
1956
62 E 144th St, Riverdale, IL 60827
$-5
Cash flow
-0.1%
Cash-on-Cash Return
5.7%
Cap rate
0.8%
Rent to Value Ratio
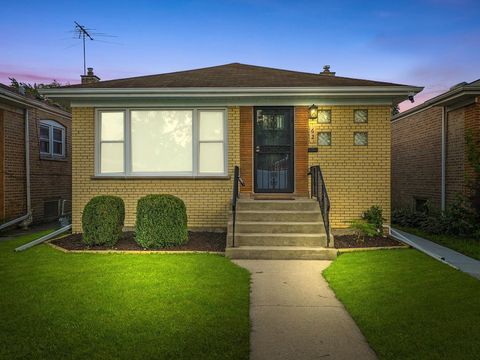
Active
$284,900
3
bds
|
2
ba
|
1,378
sqft
|
built
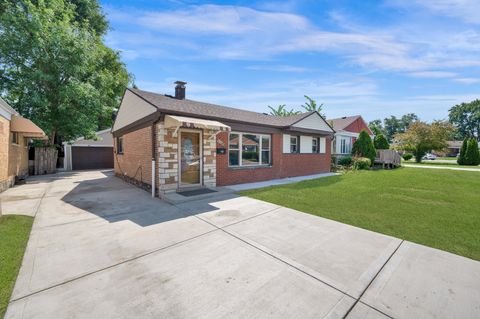
1952
8053 S Kenton Ave, Chicago, IL 60652
$50
Cash flow
0.9%
Cash-on-Cash Return
5.9%
Cap rate
0.8%
Rent to Value Ratio
Active
$624,999
3
bds
|
3
ba
|
2,598
sqft
|
built
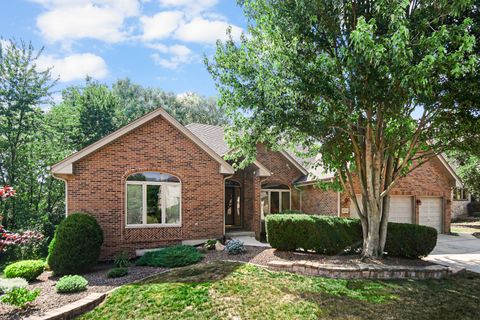
2002
18242 Breckenridge Blvd, Orland Park, IL 60467
$-1,199
Cash flow
-10.0%
Cash-on-Cash Return
3.4%
Cap rate
0.6%
Rent to Value Ratio
Active
$420,000
3
bds
|
2
ba
|
1,647
sqft
|
built
1923
2323 N Keating Ave, Chicago, IL 60639
$-206
Cash flow
-2.6%
Cash-on-Cash Return
5.1%
Cap rate
0.8%
Rent to Value Ratio
Active
$472,500
2
bds
|
2
ba
|
1,350
sqft
|
built
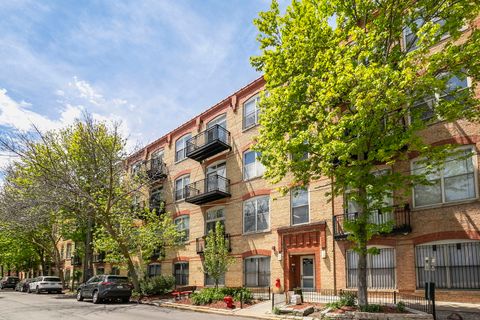
2002
1740 N Maplewood Ave, Chicago, IL 60647
$-1,524
Cash flow
-16.8%
Cash-on-Cash Return
1.8%
Cap rate
0.6%
Rent to Value Ratio
Active
$519,900
4
bds
|
3
ba
|
2,426
sqft
|
built
1972
10427 S Alta Dr, Palos Hills, IL 60465
$-951
Cash flow
-9.5%
Cash-on-Cash Return
3.5%
Cap rate
0.6%
Rent to Value Ratio
Active
$799,000
4
bds
|
2
ba
|
0
sqft
|
built
1910
3080 N Davlin Ct, Chicago, IL 60618
$-2,418
Cash flow
-15.8%
Cash-on-Cash Return
2.0%
Cap rate
0.4%
Rent to Value Ratio
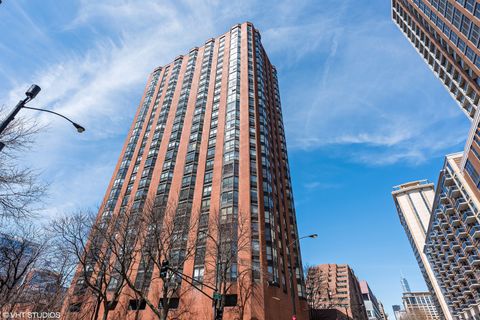
Active
$339,900
2
bds
|
2
ba
|
1,100
sqft
|
built
1963
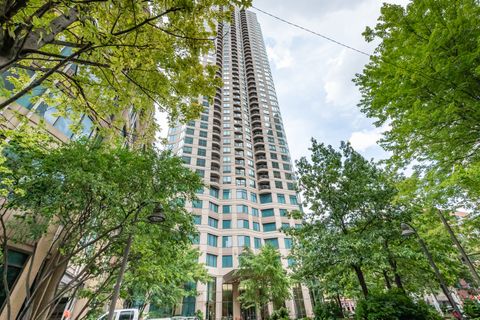
247 E Chestnut St, Chicago, IL 60611
$-1,169
Cash flow
-17.9%
Cash-on-Cash Return
1.6%
Cap rate
0.9%
Rent to Value Ratio
Active
$329,995
1
bds
|
2
ba
|
1,100
sqft
|
built
1905
1632 S Indiana Ave, Chicago, IL 60616
$-700
Cash flow
-11.1%
Cash-on-Cash Return
3.1%
Cap rate
0.8%
Rent to Value Ratio
Active
$449,000
3
bds
|
2
ba
|
3,600
sqft
|
built
1918
2407 S 60th Ct, Cicero, IL 60804
$-603
Cash flow
-7.0%
Cash-on-Cash Return
4.1%
Cap rate
0.5%
Rent to Value Ratio
Active
$600,000
2
bds
|
2
ba
|
1,680
sqft
|
built
1998
1107 Greenleaf Ave, Wilmette, IL 60091
$-1,888
Cash flow
-16.4%
Cash-on-Cash Return
1.9%
Cap rate
0.6%
Rent to Value Ratio
Active
$109,900
2
bds
|
1
ba
|
900
sqft
|
built
1973
19361 Oak Ave, Country Club Hills, IL 60478
$81
Cash flow
3.8%
Cash-on-Cash Return
6.6%
Cap rate
1.8%
Rent to Value Ratio
Active
$1,250,000
4
bds
|
4
ba
|
4,000
sqft
|
built
1929
707 W Junior Ter, Chicago, IL 60613
$-6,409
Cash flow
-26.8%
Cash-on-Cash Return
-0.5%
Cap rate
0.4%
Rent to Value Ratio
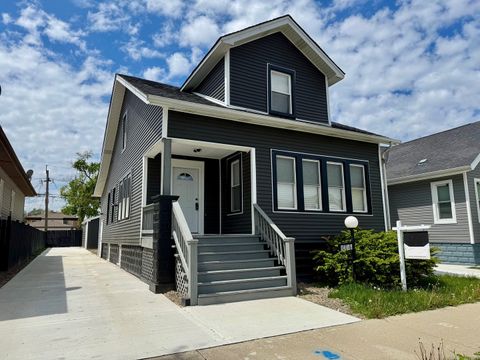
Active
$599,000
6
bds
|
3
ba
|
0
sqft
|
built
1888
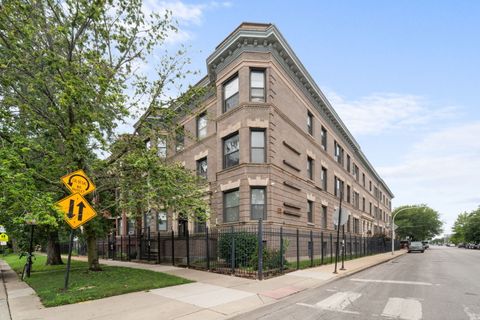
3217 S May St, Chicago, IL 60608
$-1,690
Cash flow
-14.7%
Cash-on-Cash Return
2.3%
Cap rate
0.4%
Rent to Value Ratio
Active
$799,000
8
bds
|
4
ba
|
0
sqft
|
built
1949
4906 Hull St, Skokie, IL 60077
$-3,185
Cash flow
-20.8%
Cash-on-Cash Return
0.9%
Cap rate
0.4%
Rent to Value Ratio
Active
$145,000
2
bds
|
1
ba
|
1,000
sqft
|
built
1951
355 Oswego St, Park Forest, IL 60466
$-51
Cash flow
-1.8%
Cash-on-Cash Return
5.3%
Cap rate
1.1%
Rent to Value Ratio
Active
$457,500
3
bds
|
2
ba
|
1,459
sqft
|
built
1962
5131 Touhy Ave, Skokie, IL 60077
$-351
Cash flow
-4.0%
Cash-on-Cash Return
4.8%
Cap rate
0.7%
Rent to Value Ratio
Active
$167,900
2
bds
|
2
ba
|
900
sqft
|
built
1995
15718 Peggy Ln, Oak Forest, IL 60452
$-26
Cash flow
-0.8%
Cash-on-Cash Return
5.5%
Cap rate
1.1%
Rent to Value Ratio
Active
$649,999
3
bds
|
2
ba
|
1,298
sqft
|
built
1963
9833 Keystone Ave, Skokie, IL 60076
$-1,569
Cash flow
-12.6%
Cash-on-Cash Return
2.8%
Cap rate
0.5%
Rent to Value Ratio
Active
$485,000
3
bds
|
2
ba
|
1,412
sqft
|
built
1972
3128 S Lituanica Ave, Chicago, IL 60608
$-1,165
Cash flow
-12.5%
Cash-on-Cash Return
2.8%
Cap rate
0.5%
Rent to Value Ratio
Active
$329,800
4
bds
|
3
ba
|
2,888
sqft
|
built
1927
10016 S Yale Ave, Chicago, IL 60628
$-334
Cash flow
-5.3%
Cash-on-Cash Return
4.5%
Cap rate
0.5%
Rent to Value Ratio
Active
$299,000
7
bds
|
3
ba
|
0
sqft
|
built
1898
4224 W Thomas St, Chicago, IL 60651
$-230
Cash flow
-4.0%
Cash-on-Cash Return
4.8%
Cap rate
0.7%
Rent to Value Ratio
Active
$559,900
3
bds
|
3
ba
|
2,400
sqft
|
built
1973
4567 N Merrimac Ave, Chicago, IL 60630
$-882
Cash flow
-8.2%
Cash-on-Cash Return
3.8%
Cap rate
0.6%
Rent to Value Ratio
Active
$389,900
3
bds
|
2
ba
|
1,600
sqft
|
built
1989
6931 Coachwood Trl, Tinley Park, IL 60477
$-848
Cash flow
-11.3%
Cash-on-Cash Return
3.1%
Cap rate
0.7%
Rent to Value Ratio
Active
$425,000
8
bds
|
3
ba
|
0
sqft
|
built
1926
9107 S Dobson Ave, Chicago, IL 60619
$-765
Cash flow
-9.4%
Cash-on-Cash Return
3.5%
Cap rate
0.5%
Rent to Value Ratio
Active
$219,000
2
bds
|
1
ba
|
0
sqft
|
built
1910
6100 S Ingleside Ave, Chicago, IL 60637
$-154
Cash flow
-3.7%
Cash-on-Cash Return
4.8%
Cap rate
1.1%
Rent to Value Ratio
Active
$289,000
4
bds
|
2
ba
|
1,368
sqft
|
built
1913
3711 W 56th Pl, Chicago, IL 60629
$-99
Cash flow
-1.8%
Cash-on-Cash Return
5.3%
Cap rate
0.8%
Rent to Value Ratio
Active
$299,000
1
bds
|
1
ba
|
723
sqft
|
built
2010
400 N La Salle Dr, Chicago, IL 60654
$-713
Cash flow
-12.4%
Cash-on-Cash Return
2.8%
Cap rate
0.8%
Rent to Value Ratio
Active
$247,500
3
bds
|
2
ba
|
1,500
sqft
|
built
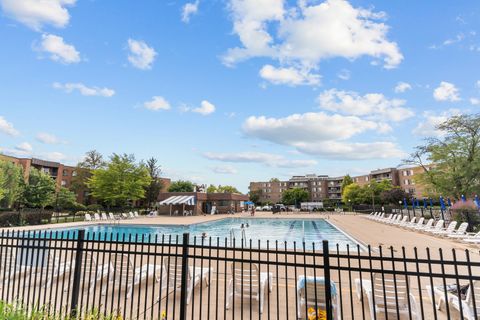
1979
945 E Kenilworth Ave, Palatine, IL 60074
$-362
Cash flow
-7.6%
Cash-on-Cash Return
3.9%
Cap rate
1.0%
Rent to Value Ratio
Active
$179,000
bds
|
1
ba
|
0
sqft
|
built
1980
899 S Plymouth Ct, Chicago, IL 60605
$-484
Cash flow
-14.1%
Cash-on-Cash Return
2.4%
Cap rate
0.9%
Rent to Value Ratio
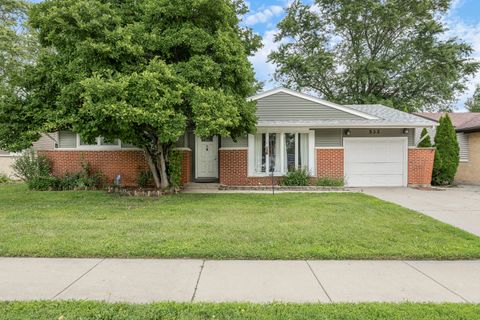
Active
$350,000
3
bds
|
2
ba
|
1,291
sqft
|
built
1957
532 Landmeier Rd, Elk Grove Village, IL 60007
$-246
Cash flow
-3.7%
Cash-on-Cash Return
4.8%
Cap rate
0.8%
Rent to Value Ratio
Active
$560,000
4
bds
|
4
ba
|
3,000
sqft
|
built
1926
3141 Harvey Ave, Berwyn, IL 60402
$-1,787
Cash flow
-16.6%
Cash-on-Cash Return
1.8%
Cap rate
0.4%
Rent to Value Ratio