Cook County Investment Properties for Sale
Browse homes for sale and investment properties in Cook County. Refine your search by price, property type, or more.
Best cash flowing properties in Cook County
Active
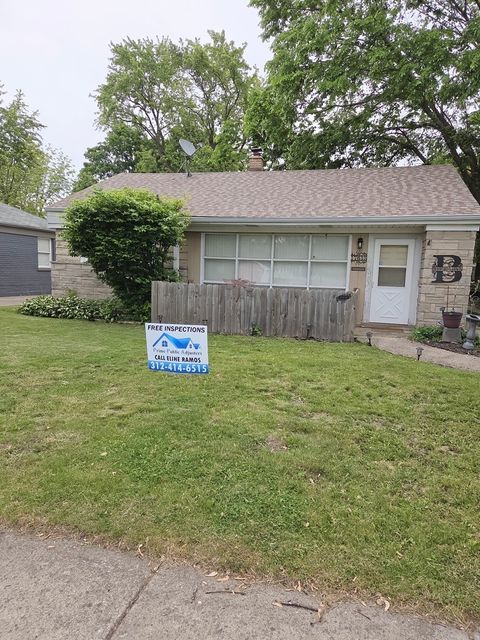
$105,000
3
bds
|
2
ba
|
1,060
sqft
|
built
1965
16611 Marshfield Ave, Markham, IL 60428
$605
Cash flow
30.1%
Cash-on-Cash Return
12.6%
Cap rate
2.1%
Rent to Value Ratio
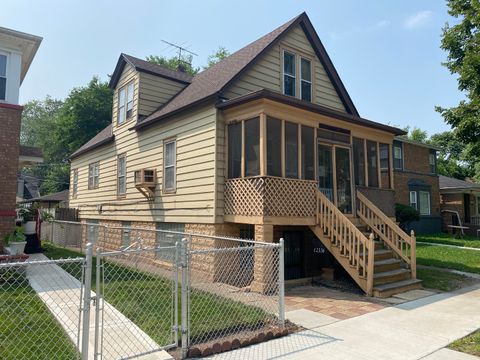
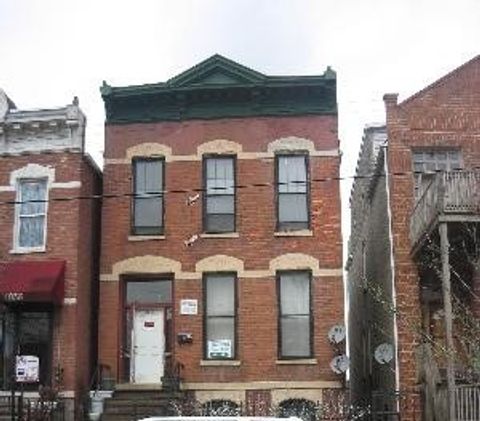
Active
$110,000
3
bds
|
3
ba
|
1,000
sqft
|
built
1908
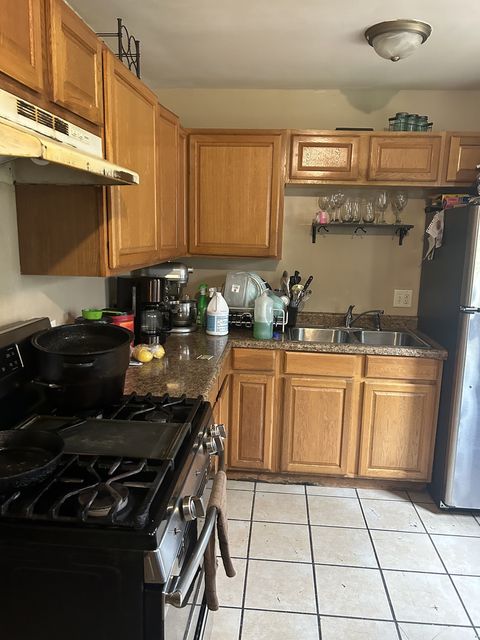
12336 S Lafayette Ave, Chicago, IL 60628
$435
Cash flow
20.6%
Cash-on-Cash Return
10.4%
Cap rate
1.5%
Rent to Value Ratio
4,861 out of 5,645 properties for sale in Cook County
Limited Results Shown
Create a free account, or log in to reveal all property listings and enjoy the complete experience.
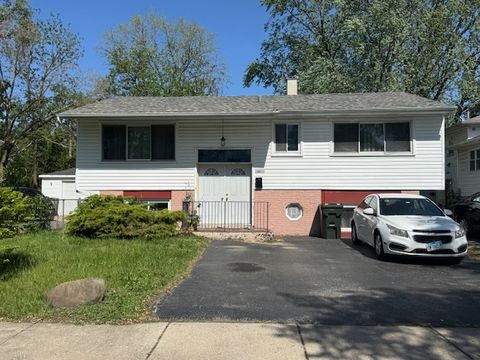
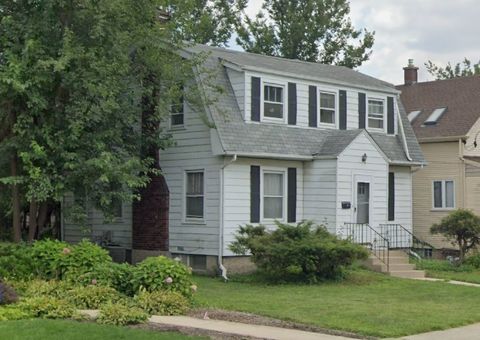
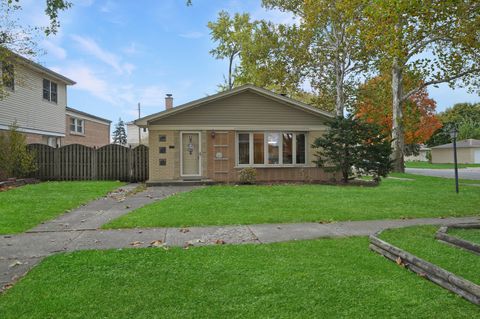
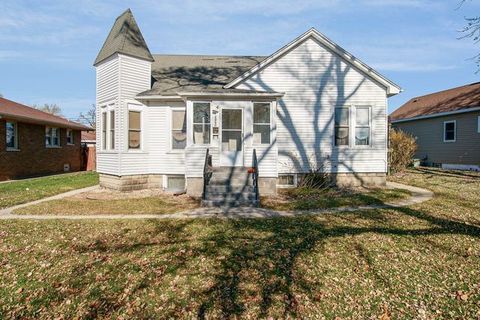
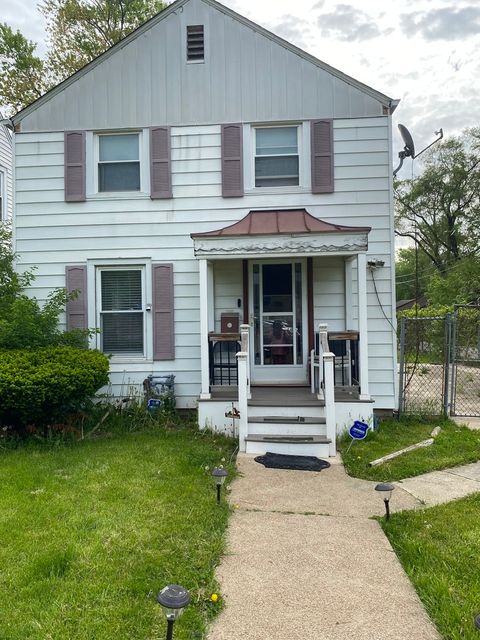
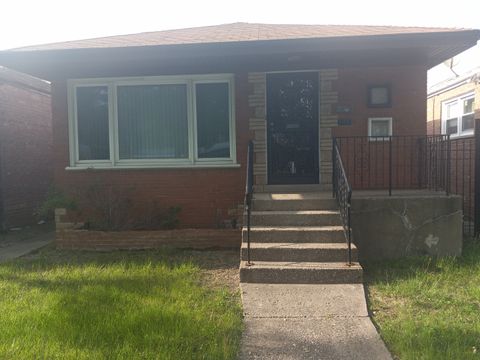
Active
$189,900
3
bds
|
1
ba
|
1,281
sqft
|
built
1956
3225 Otto St, Lansing, IL 60438
$362
Cash flow
9.9%
Cash-on-Cash Return
8.0%
Cap rate
1.2%
Rent to Value Ratio
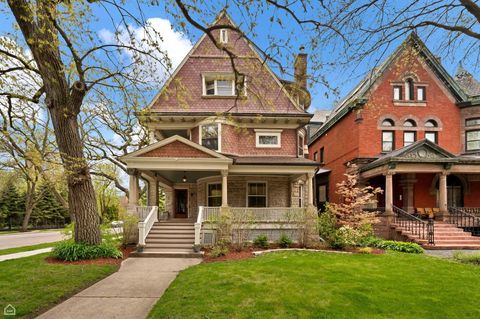
Active
$1,950,000
6
bds
|
5
ba
|
4,700
sqft
|
built
1890
4801 S Kimbark Ave, Chicago, IL 60615
$-6,535
Cash flow
-17.5%
Cash-on-Cash Return
1.7%
Cap rate
0.3%
Rent to Value Ratio
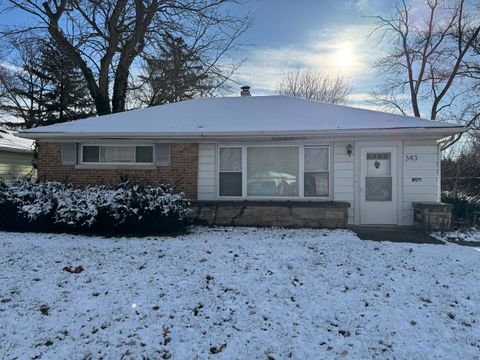
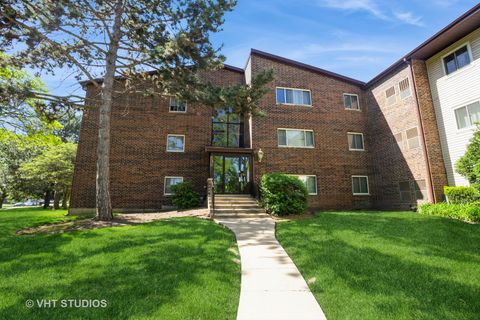
Active
$150,000
2
bds
|
2
ba
|
1,319
sqft
|
built
1951
343 Indianwood Blvd, Park Forest, IL 60466
$-123
Cash flow
-4.3%
Cash-on-Cash Return
4.7%
Cap rate
1.3%
Rent to Value Ratio
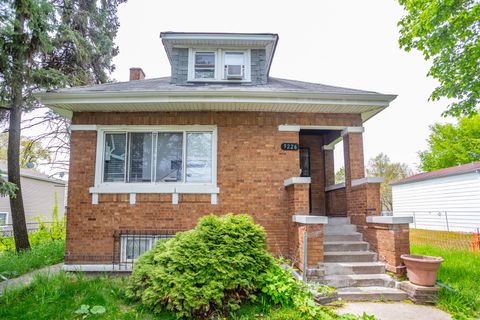
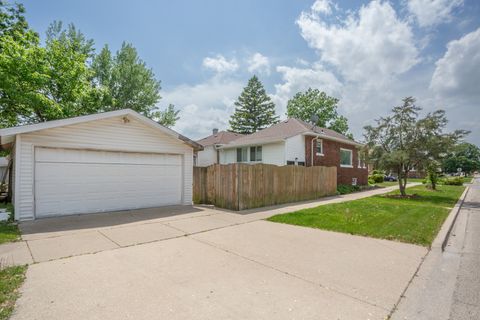
Active
$297,000
4
bds
|
2
ba
|
2,360
sqft
|
built
1927
9226 S Ellis Ave, Chicago, IL 60619
$-180
Cash flow
-3.2%
Cash-on-Cash Return
4.9%
Cap rate
0.7%
Rent to Value Ratio
Active
$255,000
2
bds
|
2
ba
|
1,724
sqft
|
built
1926
2101 S 7th Ave, Maywood, IL 60153
$-325
Cash flow
-6.6%
Cash-on-Cash Return
4.2%
Cap rate
0.9%
Rent to Value Ratio
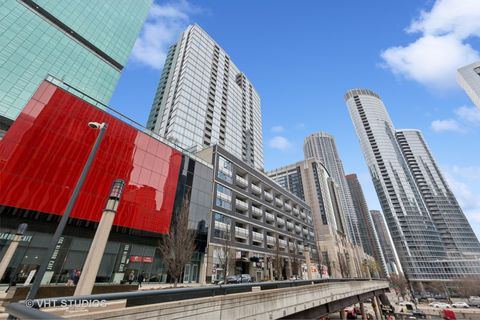
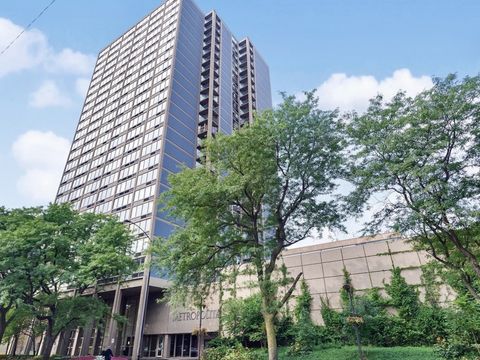
Active
$360,000
1
bds
|
1
ba
|
933
sqft
|
built
2006
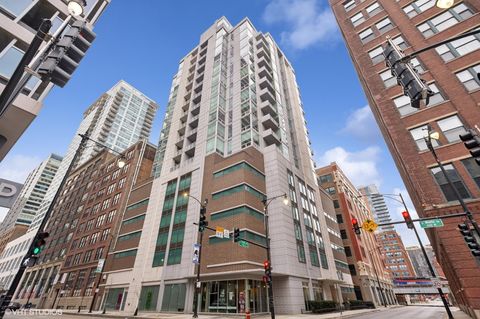
240 E Illinois St, Chicago, IL 60611
$-1,226
Cash flow
-17.8%
Cash-on-Cash Return
1.6%
Cap rate
0.8%
Rent to Value Ratio
Active
$830,000
4
bds
|
2
ba
|
1,613
sqft
|
built
1921
421 Leonard St, Park Ridge, IL 60068
$-2,372
Cash flow
-14.9%
Cash-on-Cash Return
2.2%
Cap rate
0.4%
Rent to Value Ratio
Active
$195,000
2
bds
|
1
ba
|
854
sqft
|
built
1978
630 Perrie Dr, Elk Grove Village, IL 60007
$-412
Cash flow
-11.0%
Cash-on-Cash Return
3.1%
Cap rate
0.8%
Rent to Value Ratio
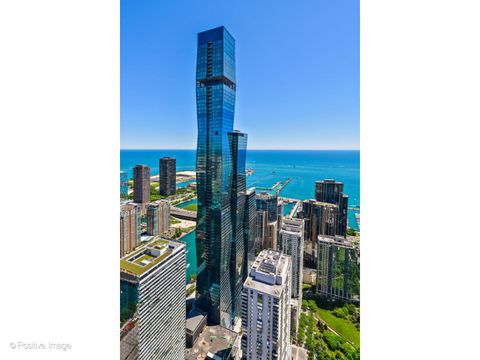
Active
$2,745,000
4
bds
|
5
ba
|
3,500
sqft
|
built
2020
363 E Wacker Dr, Chicago, IL 60601
$-12,934
Cash flow
-24.6%
Cash-on-Cash Return
0.0%
Cap rate
0.4%
Rent to Value Ratio
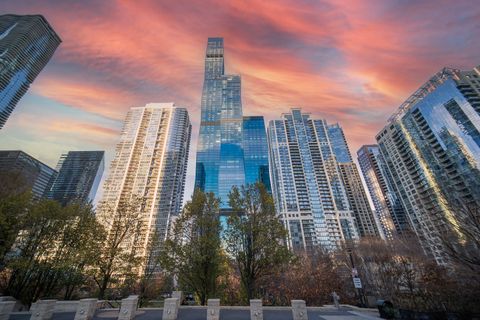
Active
$1,725,000
3
bds
|
2
ba
|
2,337
sqft
|
built
2021
363 E Wacker Dr, Chicago, IL 60601
$-6,095
Cash flow
-18.4%
Cash-on-Cash Return
1.4%
Cap rate
0.5%
Rent to Value Ratio
Active
$324,900
4
bds
|
2
ba
|
2,213
sqft
|
built
1962
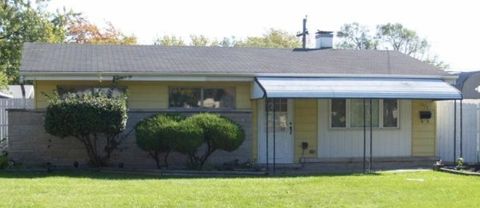
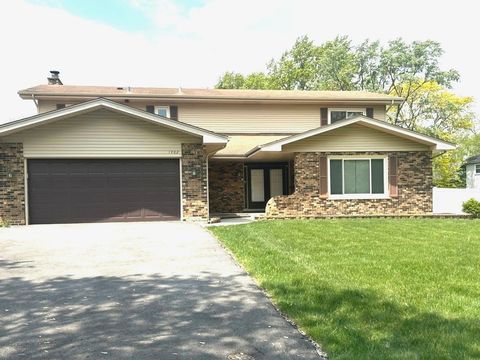
5440 Oak Center Dr, Oak Lawn, IL 60453
$220
Cash flow
3.5%
Cash-on-Cash Return
6.5%
Cap rate
1.0%
Rent to Value Ratio
Active
$375,000
1
bds
|
1
ba
|
750
sqft
|
built
1971
2020 N Lincoln Park W, Chicago, IL 60614
$-1,385
Cash flow
-19.3%
Cash-on-Cash Return
1.2%
Cap rate
0.7%
Rent to Value Ratio
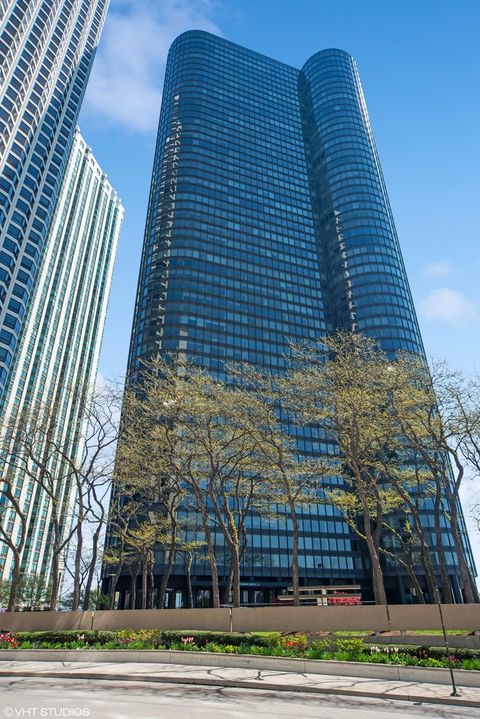
Active
$499,000
2
bds
|
2
ba
|
1,250
sqft
|
built
1974
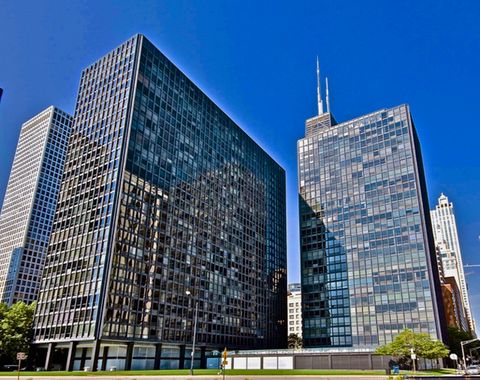
155 N Harbor Dr, Chicago, IL 60601
$-1,501
Cash flow
-15.7%
Cash-on-Cash Return
2.1%
Cap rate
0.8%
Rent to Value Ratio
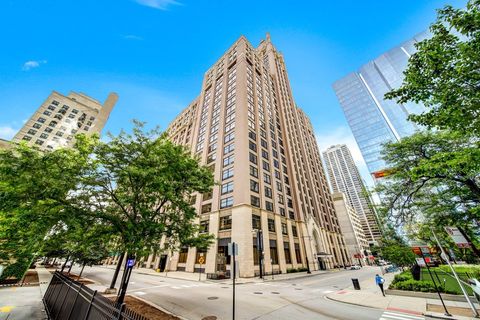
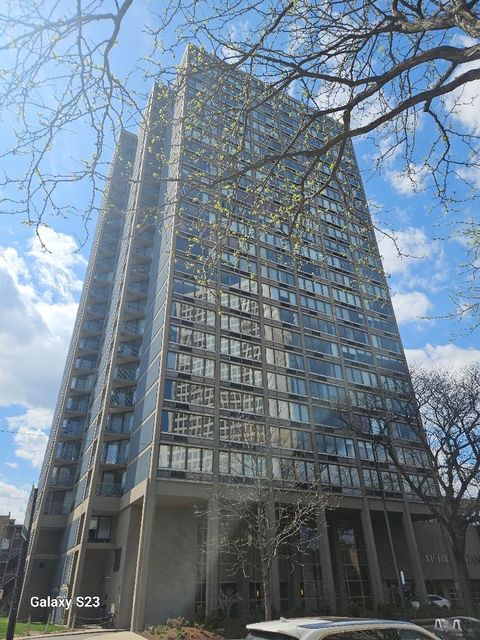
Active
$399,000
1
bds
|
2
ba
|
1,475
sqft
|
built
1926
680 N Lake Shore Dr, Chicago, IL 60611
$-1,379
Cash flow
-18.0%
Cash-on-Cash Return
1.5%
Cap rate
0.8%
Rent to Value Ratio
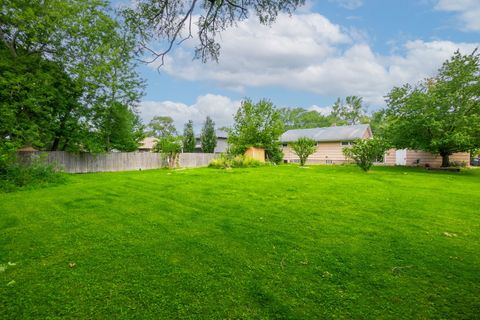
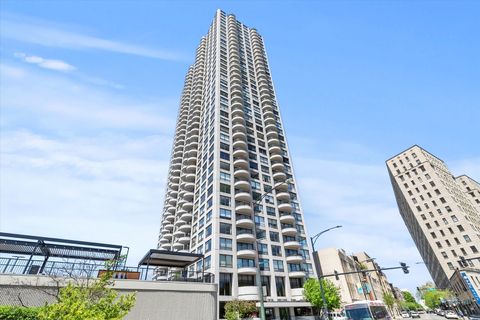
Active
$340,000
5
bds
|
4
ba
|
0
sqft
|
built
1893
2460 Indiana Ave, Lansing, IL 60438
$-874
Cash flow
-13.4%
Cash-on-Cash Return
2.6%
Cap rate
0.6%
Rent to Value Ratio
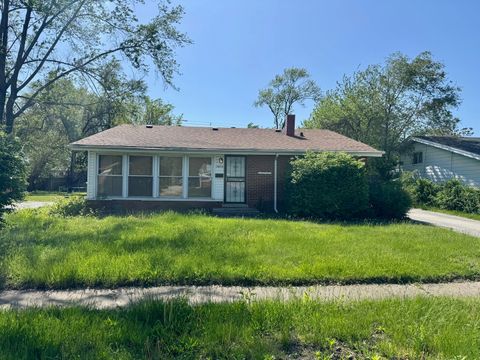
Active
$85,000
3
bds
|
2
ba
|
1,117
sqft
|
built
1962
16614 Plymouth Dr, Markham, IL 60428
$352
Cash flow
21.6%
Cash-on-Cash Return
10.6%
Cap rate
2.4%
Rent to Value Ratio
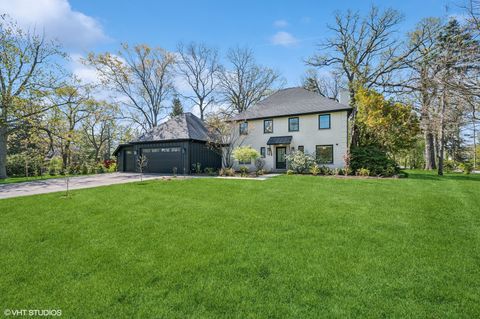
Active
$2,599,000
4
bds
|
5
ba
|
6,500
sqft
|
built
1941
1933 Ridgewood Ln W, Glenview, IL 60025
$-10,392
Cash flow
-20.9%
Cash-on-Cash Return
0.9%
Cap rate
0.2%
Rent to Value Ratio
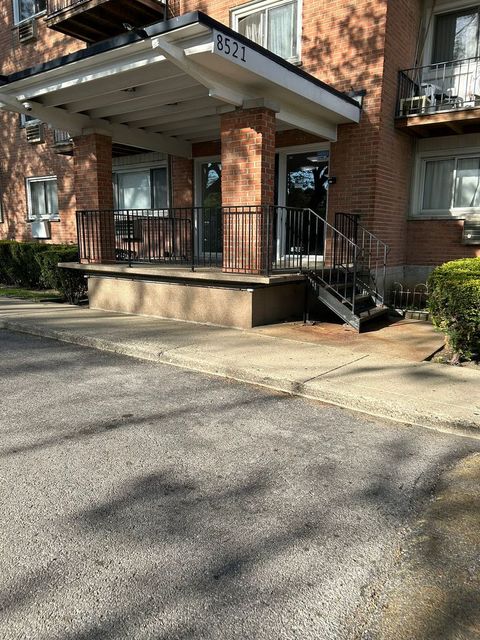
Active
$170,000
1
bds
|
1
ba
|
0
sqft
|
built
1956
8521 Lotus Ave, Skokie, IL 60077
$-328
Cash flow
-10.1%
Cash-on-Cash Return
3.4%
Cap rate
0.9%
Rent to Value Ratio
Active
$139,999
3
bds
|
1
ba
|
6,160
sqft
|
built
1955
1373 Stanley Blvd, Calumet City, IL 60409
$-61
Cash flow
-2.3%
Cash-on-Cash Return
5.2%
Cap rate
1.3%
Rent to Value Ratio
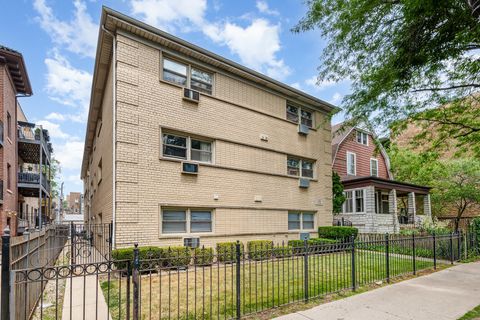
Active
$333,900
2
bds
|
2
ba
|
1,015
sqft
|
built
1985
5320 N Sheridan Rd, Chicago, IL 60640
$-1,085
Cash flow
-17.0%
Cash-on-Cash Return
1.8%
Cap rate
0.7%
Rent to Value Ratio
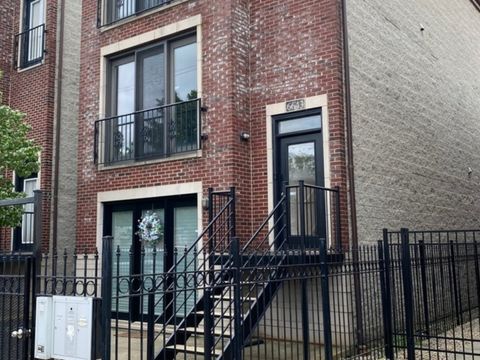
Active
$299,000
2
bds
|
2
ba
|
1,250
sqft
|
built
2008
6643 W Belmont Ave, Chicago, IL 60634
$-77
Cash flow
-1.3%
Cash-on-Cash Return
5.4%
Cap rate
0.8%
Rent to Value Ratio
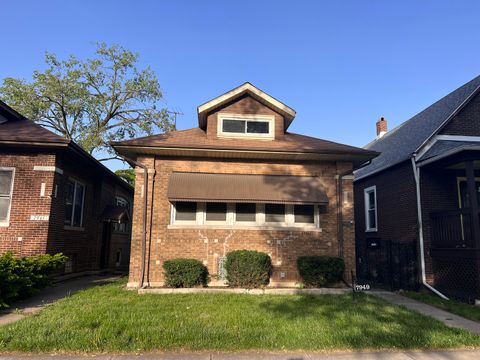
Active
$247,000
3
bds
|
2
ba
|
1,900
sqft
|
built
1920
7949 S Manistee Ave, Chicago, IL 60617
$397
Cash flow
8.4%
Cash-on-Cash Return
7.6%
Cap rate
1.0%
Rent to Value Ratio
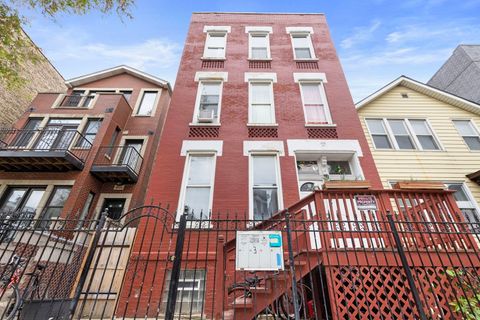
Active
$575,000
6
bds
|
6
ba
|
0
sqft
|
built
1890
1036 W 18th St, Chicago, IL 60608
$-2,074
Cash flow
-18.8%
Cash-on-Cash Return
1.4%
Cap rate
0.4%
Rent to Value Ratio
Active
$160,000
3
bds
|
2
ba
|
7,186
sqft
|
built
1942
14735 Myrtle Ave, Harvey, IL 60426
$347
Cash flow
11.3%
Cash-on-Cash Return
8.3%
Cap rate
1.0%
Rent to Value Ratio
Active
$199,900
3
bds
|
1
ba
|
1,340
sqft
|
built
1950
17613 Dundee Ave, Homewood, IL 60430
$383
Cash flow
10.0%
Cash-on-Cash Return
8.0%
Cap rate
1.3%
Rent to Value Ratio
Active
$665,000
6
bds
|
4
ba
|
0
sqft
|
built
1879
1507 W Erie St, Chicago, IL 60642
$-2,200
Cash flow
-17.3%
Cash-on-Cash Return
1.7%
Cap rate
0.5%
Rent to Value Ratio
Active
$199,900
3
bds
|
2
ba
|
1,129
sqft
|
built
1960
2320 E 103rd St, Chicago, IL 60617
$328
Cash flow
8.6%
Cash-on-Cash Return
7.6%
Cap rate
1.0%
Rent to Value Ratio
Active
$325,000
2
bds
|
2
ba
|
1,015
sqft
|
built
1984
5320 N Sheridan Rd, Chicago, IL 60640
$-1,038
Cash flow
-16.7%
Cash-on-Cash Return
1.8%
Cap rate
0.7%
Rent to Value Ratio
Active
$287,000
2
bds
|
2
ba
|
1,200
sqft
|
built
1971
1238 W Pratt Blvd, Chicago, IL 60626
$-330
Cash flow
-6.0%
Cash-on-Cash Return
4.3%
Cap rate
0.8%
Rent to Value Ratio
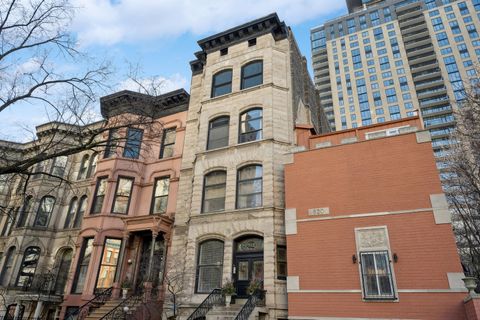
Active
$485,000
2
bds
|
2
ba
|
1,000
sqft
|
built
1891
818 N Dearborn St, Chicago, IL 60610
$-479
Cash flow
-5.2%
Cash-on-Cash Return
4.5%
Cap rate
0.7%
Rent to Value Ratio
Active
$449,000
4
bds
|
2
ba
|
1,417
sqft
|
built
1967
416 Trinity Ct, Buffalo Grove, IL 60089
$-453
Cash flow
-5.3%
Cash-on-Cash Return
4.5%
Cap rate
0.7%
Rent to Value Ratio
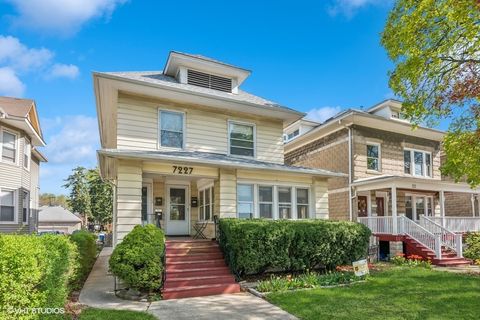
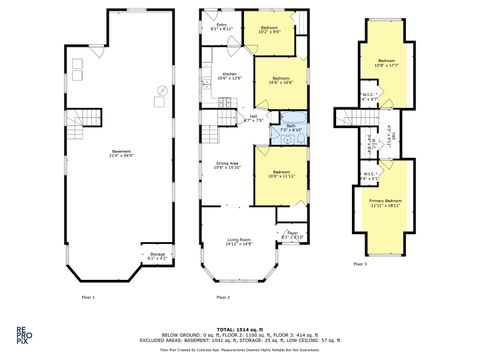
Active
$537,000
6
bds
|
3
ba
|
0
sqft
|
built
1910
7227 Jackson Blvd, Forest Park, IL 60130
$-2,093
Cash flow
-20.3%
Cash-on-Cash Return
1.0%
Cap rate
0.5%
Rent to Value Ratio
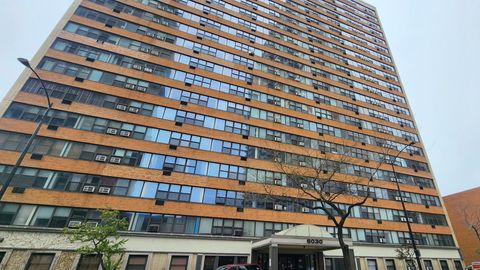
Active
$138,000
1
bds
|
1
ba
|
750
sqft
|
built
1951
6030 N Sheridan Rd, Chicago, IL 60660
$-67
Cash flow
-2.5%
Cash-on-Cash Return
5.1%
Cap rate
1.3%
Rent to Value Ratio
Active
$239,900
5
bds
|
2
ba
|
1,347
sqft
|
built
1928
9028 S Ada St, Chicago, IL 60620
$119
Cash flow
2.6%
Cash-on-Cash Return
6.3%
Cap rate
0.9%
Rent to Value Ratio
Active
$499,900
4
bds
|
3
ba
|
2,958
sqft
|
built
1971
1402 Berry Ln, Flossmoor, IL 60422
$-876
Cash flow
-9.1%
Cash-on-Cash Return
3.6%
Cap rate
0.7%
Rent to Value Ratio
Active
$435,000
2
bds
|
2
ba
|
1,250
sqft
|
built
2007
170 W Polk St, Chicago, IL 60605
$-928
Cash flow
-11.1%
Cash-on-Cash Return
3.1%
Cap rate
0.8%
Rent to Value Ratio
Active
$289,000
bds
|
1
ba
|
645
sqft
|
built
1955
900 N Lake Shore Dr, Chicago, IL 60611
$-803
Cash flow
-14.5%
Cash-on-Cash Return
2.3%
Cap rate
0.7%
Rent to Value Ratio
Active
$149,900
2
bds
|
2
ba
|
0
sqft
|
built
1967
22121 Karlov Ave, Richton Park, IL 60471
$107
Cash flow
3.7%
Cash-on-Cash Return
6.5%
Cap rate
1.2%
Rent to Value Ratio