Cook County Investment Properties for Sale
Browse homes for sale and investment properties in Cook County. Refine your search by price, property type, or more.
Best cash flowing properties in Cook County
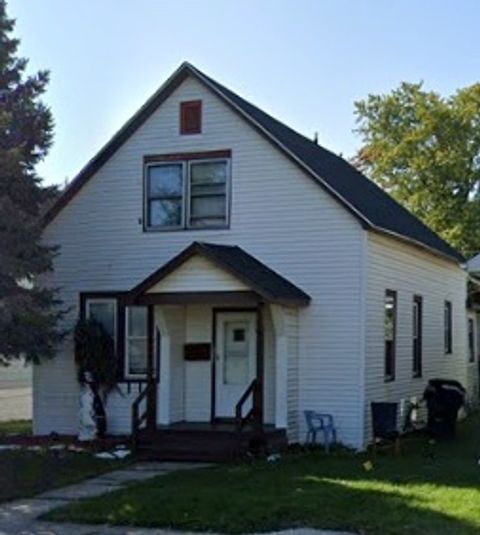
Active
$49,000
3
bds
|
2
ba
|
1,242
sqft
|
built
1913
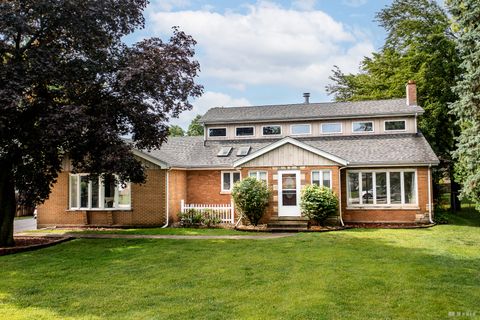
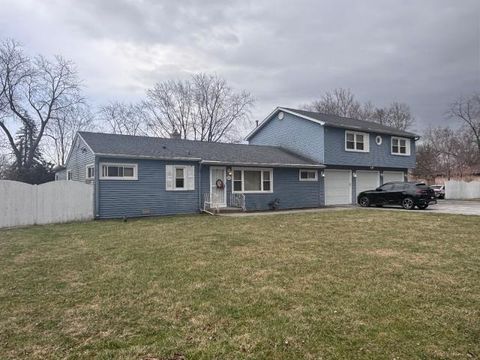
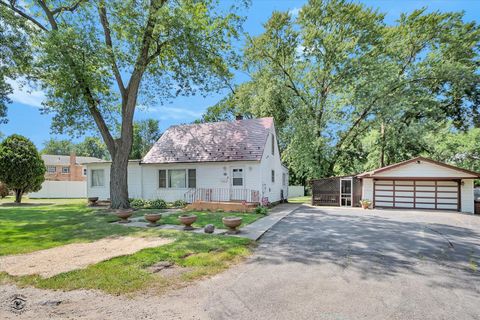
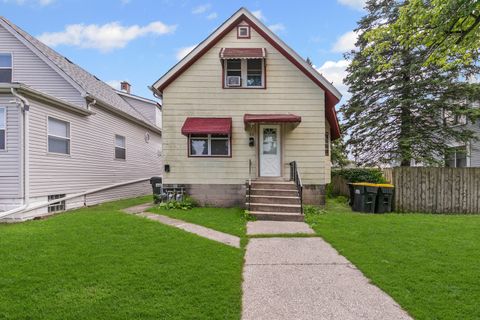
2728 Jackson Ave, South Chicago Heights, IL 60411
$806
Cash flow
19.2%
Cash-on-Cash Return
19.7%
Cap rate
3.3%
Rent to Value Ratio
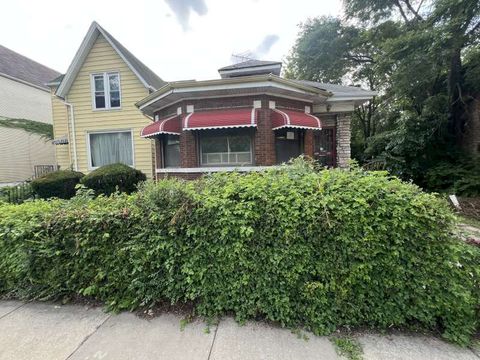
Active
$78,500
3
bds
|
2
ba
|
1,385
sqft
|
built
1922
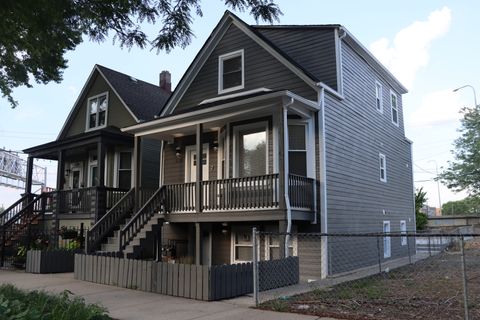
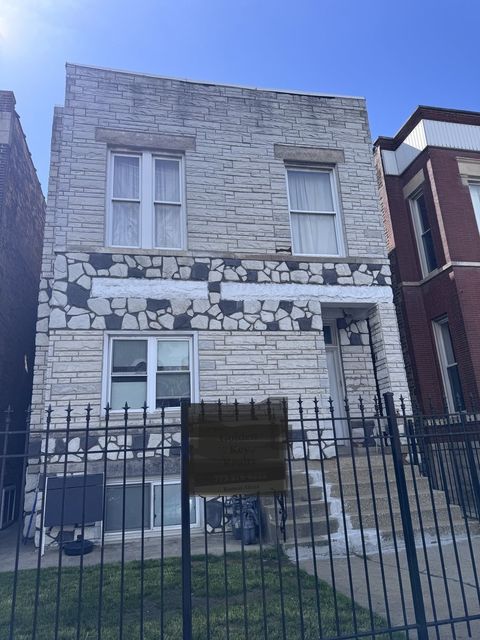
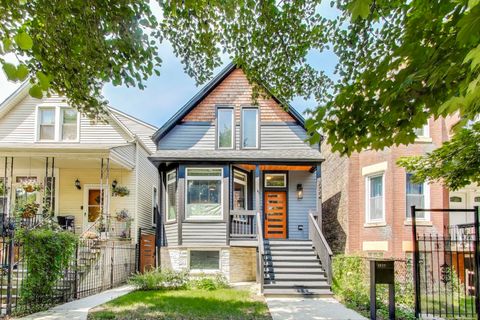
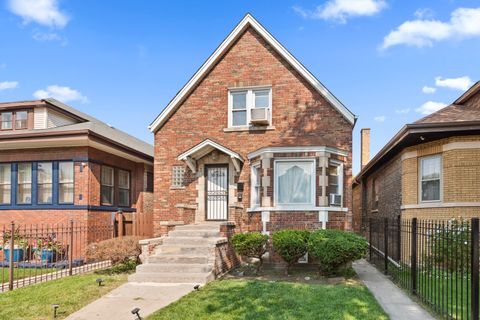
7022 S Kimbark Ave, Chicago, IL 60637
$757
Cash flow
50.3%
Cash-on-Cash Return
17.2%
Cap rate
2.3%
Rent to Value Ratio
5,242 out of 6,069 properties for sale in Cook County
Limited Results Shown
Create a free account, or log in to reveal all property listings and enjoy the complete experience.
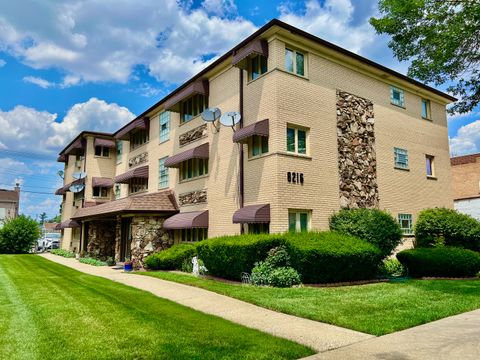
Active
$149,900
1
bds
|
1
ba
|
643
sqft
|
built
1970
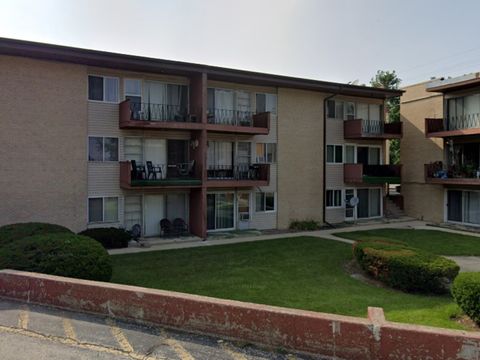
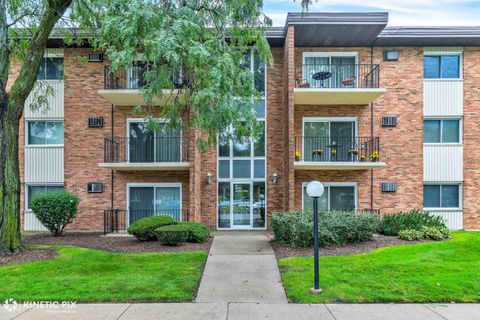
8216 W Belmont Ave, Chicago, IL 60634
$-109
Cash flow
-3.8%
Cash-on-Cash Return
4.8%
Cap rate
0.9%
Rent to Value Ratio
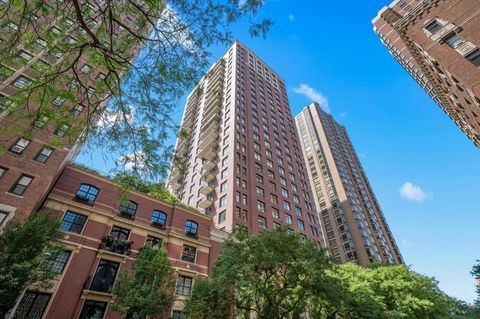
Active
$875,000
3
bds
|
3
ba
|
1,750
sqft
|
built
1999
1122 N Dearborn St, Chicago, IL 60610
$-2,757
Cash flow
-16.4%
Cash-on-Cash Return
1.9%
Cap rate
0.7%
Rent to Value Ratio
Active
$349,900
1
bds
|
1
ba
|
966
sqft
|
built
2008
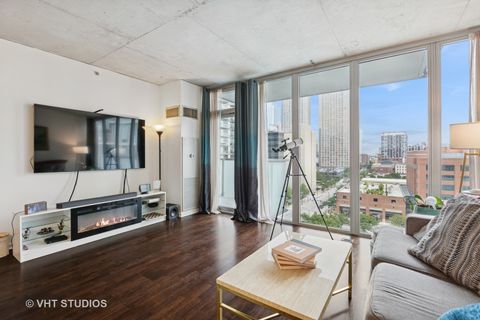
659 W Randolph St, Chicago, IL 60661
$-1,049
Cash flow
-15.6%
Cash-on-Cash Return
2.1%
Cap rate
0.8%
Rent to Value Ratio
Active
$132,800
1
bds
|
1
ba
|
900
sqft
|
built
1908
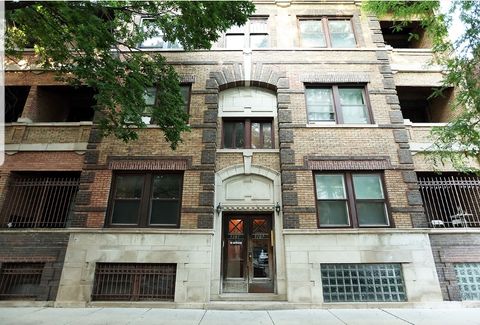
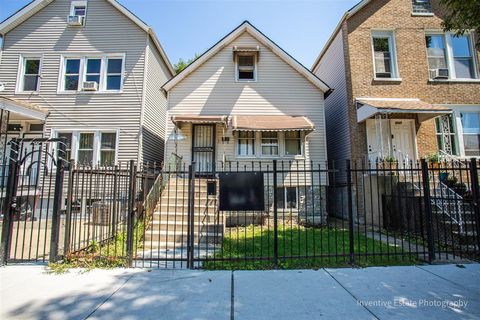
5107 S Ingleside Ave, Chicago, IL 60615
$189
Cash flow
7.4%
Cash-on-Cash Return
7.4%
Cap rate
1.5%
Rent to Value Ratio
Active
$1,895,000
4
bds
|
5
ba
|
4,259
sqft
|
built
1905
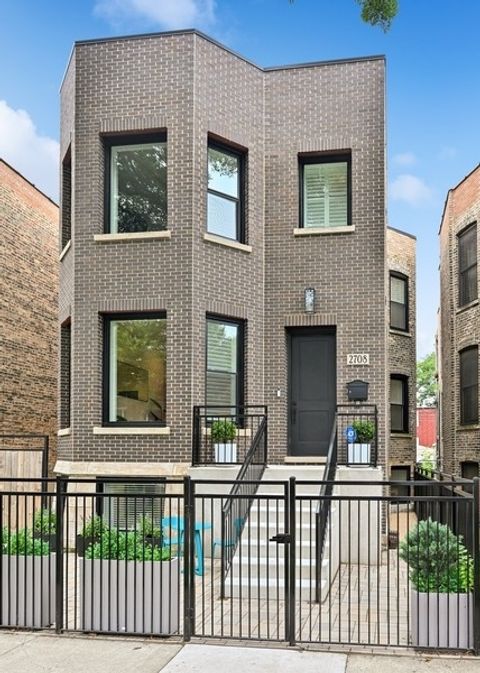
2708 N Albany Ave, Chicago, IL 60647
$-5,794
Cash flow
-16.0%
Cash-on-Cash Return
2.0%
Cap rate
0.4%
Rent to Value Ratio
Active
$375,000
2
bds
|
2
ba
|
0
sqft
|
built
2005
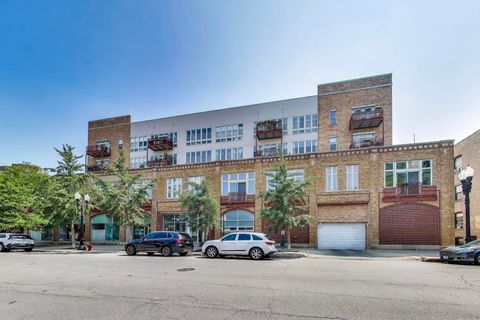
1225 W Morse Ave, Chicago, IL 60626
$-1,027
Cash flow
-14.3%
Cash-on-Cash Return
2.4%
Cap rate
0.7%
Rent to Value Ratio
Active
$369,000
3
bds
|
2
ba
|
1,568
sqft
|
built
1906
4721 S Greenwood Ave, Chicago, IL 60615
$-681
Cash flow
-9.6%
Cash-on-Cash Return
3.5%
Cap rate
0.8%
Rent to Value Ratio
Active
$399,900
3
bds
|
2
ba
|
1,380
sqft
|
built
1972
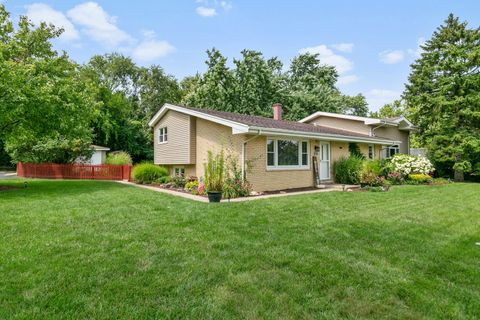
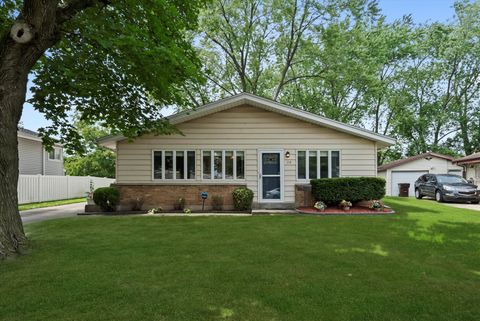
10153 S 87th Ave, Palos Hills, IL 60465
$-420
Cash flow
-5.5%
Cash-on-Cash Return
4.4%
Cap rate
0.8%
Rent to Value Ratio
Active
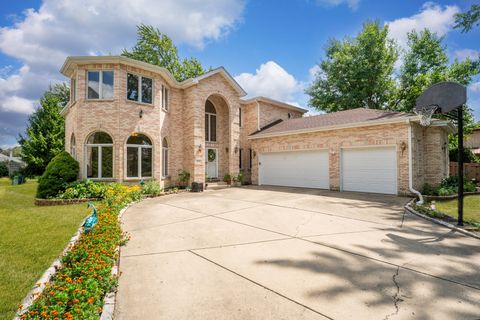
$699,950
4
bds
|
4
ba
|
4,128
sqft
|
built
2016
16829 Sheridans Trl, Orland Park, IL 60467
$-1,906
Cash flow
-14.2%
Cash-on-Cash Return
2.4%
Cap rate
0.5%
Rent to Value Ratio
Active
$399,000
3
bds
|
3
ba
|
0
sqft
|
built
1948
3736 W 70th St, Chicago, IL 60629
$-466
Cash flow
-6.1%
Cash-on-Cash Return
4.3%
Cap rate
0.6%
Rent to Value Ratio
Active
$225,000
1
bds
|
1
ba
|
709
sqft
|
built
1912
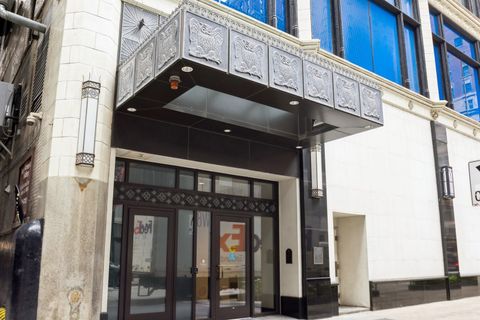
8 W Monroe St, Chicago, IL 60603
$-698
Cash flow
-16.2%
Cash-on-Cash Return
2.0%
Cap rate
0.8%
Rent to Value Ratio

Active
$165,000
2
bds
|
1
ba
|
0
sqft
|
built
1961
4416 N Harding Ave, Chicago, IL 60625
$-33
Cash flow
-1.0%
Cash-on-Cash Return
5.4%
Cap rate
1.0%
Rent to Value Ratio
Active
$750,000
5
bds
|
3
ba
|
0
sqft
|
built
1911
3331 N Drake Ave, Chicago, IL 60618
$-2,386
Cash flow
-16.6%
Cash-on-Cash Return
1.9%
Cap rate
0.3%
Rent to Value Ratio
Active
$99,900
1
bds
|
1
ba
|
700
sqft
|
built
1970
605 N Wolf Rd, Hillside, IL 60162
$232
Cash flow
12.1%
Cash-on-Cash Return
8.5%
Cap rate
1.5%
Rent to Value Ratio

Active
$134,999
2
bds
|
1
ba
|
850
sqft
|
built
1974
11010 Central Ave, Chicago Ridge, IL 60415
$-77
Cash flow
-3.0%
Cash-on-Cash Return
5.0%
Cap rate
1.2%
Rent to Value Ratio
Active
$519,000
4
bds
|
4
ba
|
2,489
sqft
|
built
1946
5821 W 127th St, Palos Heights, IL 60463
$-1,239
Cash flow
-12.5%
Cash-on-Cash Return
2.8%
Cap rate
0.6%
Rent to Value Ratio
Active
$459,999
9
bds
|
3
ba
|
0
sqft
|
built
1896
1940 N Pulaski Rd, Chicago, IL 60639
$-1,111
Cash flow
-12.6%
Cash-on-Cash Return
2.8%
Cap rate
0.5%
Rent to Value Ratio

Active
$215,000
3
bds
|
2
ba
|
1,134
sqft
|
built
1925
432 E 88th St, Chicago, IL 60619
$412
Cash flow
10.0%
Cash-on-Cash Return
8.0%
Cap rate
1.0%
Rent to Value Ratio
Active
$429,900
3
bds
|
2
ba
|
2,145
sqft
|
built
1963
9050 S 84th Ave, Hickory Hills, IL 60457
$-648
Cash flow
-7.9%
Cash-on-Cash Return
3.9%
Cap rate
0.7%
Rent to Value Ratio
Active
$269,000
4
bds
|
3
ba
|
2,494
sqft
|
built
1954
19119 S Saint Lawrence Ave, Glenwood, IL 60425
$330
Cash flow
6.4%
Cash-on-Cash Return
7.2%
Cap rate
1.2%
Rent to Value Ratio
Active
$100,000
2
bds
|
1
ba
|
630
sqft
|
built
1900
5045 S Winchester Ave, Chicago, IL 60609
$654
Cash flow
34.1%
Cash-on-Cash Return
13.5%
Cap rate
1.8%
Rent to Value Ratio
Active
$899,000
3
bds
|
4
ba
|
3,000
sqft
|
built
1891
2922 N Sawyer Ave, Chicago, IL 60618
$-2,433
Cash flow
-14.1%
Cash-on-Cash Return
2.4%
Cap rate
0.4%
Rent to Value Ratio
Active
$165,000
2
bds
|
1
ba
|
0
sqft
|
built
1968
9720 S Karlov Ave, Oak Lawn, IL 60453
$-87
Cash flow
-2.8%
Cash-on-Cash Return
5.0%
Cap rate
1.0%
Rent to Value Ratio
Active
$227,000
3
bds
|
2
ba
|
1,468
sqft
|
built
1947
14504 Central Park Ave, Midlothian, IL 60445
$197
Cash flow
4.5%
Cash-on-Cash Return
6.7%
Cap rate
1.0%
Rent to Value Ratio

Active
$299,900
4
bds
|
2
ba
|
1,986
sqft
|
built
1926
531 E 89th Pl, Chicago, IL 60619
$-614
Cash flow
-10.7%
Cash-on-Cash Return
3.2%
Cap rate
0.5%
Rent to Value Ratio
Active
$309,900
2
bds
|
2
ba
|
1,591
sqft
|
built
1945
5145 S Avers Ave, Chicago, IL 60632
$-335
Cash flow
-5.6%
Cash-on-Cash Return
4.4%
Cap rate
0.6%
Rent to Value Ratio
Active
$349,990
3
bds
|
2
ba
|
1,623
sqft
|
built
1944
1516 Heidorn Ave, Westchester, IL 60154
$-271
Cash flow
-4.0%
Cash-on-Cash Return
4.7%
Cap rate
0.7%
Rent to Value Ratio
Active
$319,000
3
bds
|
2
ba
|
1,500
sqft
|
built
1945
2003 S 24th Ave, Broadview, IL 60155
$-361
Cash flow
-5.9%
Cash-on-Cash Return
4.3%
Cap rate
0.8%
Rent to Value Ratio
Active
$320,000
1
bds
|
1
ba
|
780
sqft
|
built
2007
451 W Huron St, Chicago, IL 60654
$-755
Cash flow
-12.3%
Cash-on-Cash Return
2.8%
Cap rate
0.8%
Rent to Value Ratio
Active
$189,000
2
bds
|
1
ba
|
935
sqft
|
built
1943
429 Geneva Ave, Bellwood, IL 60104
$46
Cash flow
1.3%
Cash-on-Cash Return
6.0%
Cap rate
1.1%
Rent to Value Ratio
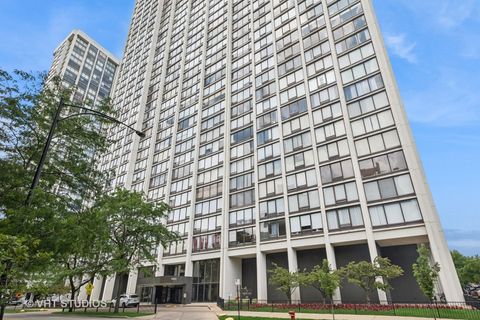
Active
$364,875
2
bds
|
2
ba
|
1,225
sqft
|
built
1972
5445 N Sheridan Rd, Chicago, IL 60640
$-965
Cash flow
-13.8%
Cash-on-Cash Return
2.5%
Cap rate
0.8%
Rent to Value Ratio
Active
$649,900
3
bds
|
4
ba
|
2,746
sqft
|
built
1969
2342 S Shag Bark Trl, Arlington Heights, IL 60005
$-1,093
Cash flow
-8.8%
Cash-on-Cash Return
3.7%
Cap rate
0.6%
Rent to Value Ratio
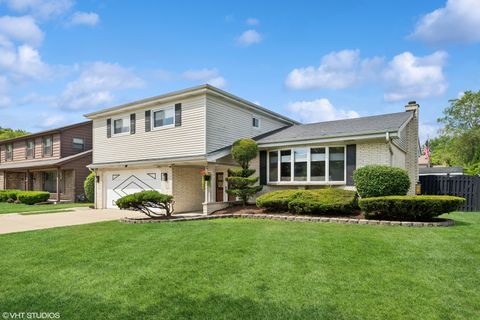
Active
$289,900
2
bds
|
2
ba
|
1,350
sqft
|
built
1976
1020 Denham Pl, Schaumburg, IL 60194
$-212
Cash flow
-3.8%
Cash-on-Cash Return
4.8%
Cap rate
0.9%
Rent to Value Ratio
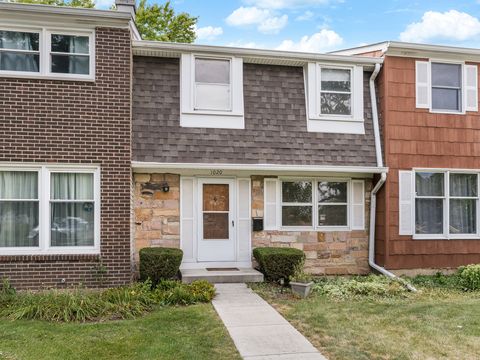
Active
$159,900
1
bds
|
1
ba
|
1,200
sqft
|
built
1930
7344 N Ridge Blvd, Chicago, IL 60645
$-370
Cash flow
-12.1%
Cash-on-Cash Return
2.9%
Cap rate
1.1%
Rent to Value Ratio
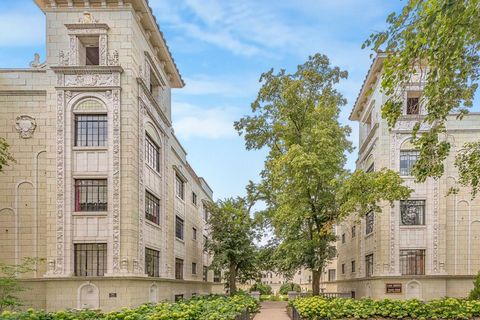
Active
$205,000
3
bds
|
2
ba
|
1,676
sqft
|
built
1956
114 Willow St, Park Forest, IL 60466
$-218
Cash flow
-5.5%
Cash-on-Cash Return
4.4%
Cap rate
1.1%
Rent to Value Ratio
Active
$124,900
3
bds
|
2
ba
|
0
sqft
|
built
1907
90 W 28th Pl, South Chicago Heights, IL 60411
$53
Cash flow
2.2%
Cash-on-Cash Return
6.2%
Cap rate
1.1%
Rent to Value Ratio
Active
$990,000
4
bds
|
4
ba
|
4,015
sqft
|
built
1999
1007 Wildwood Ln, Mount Prospect, IL 60056
$-2,738
Cash flow
-14.4%
Cash-on-Cash Return
2.4%
Cap rate
0.5%
Rent to Value Ratio
Active
$245,000
5
bds
|
2
ba
|
2,040
sqft
|
built
1950
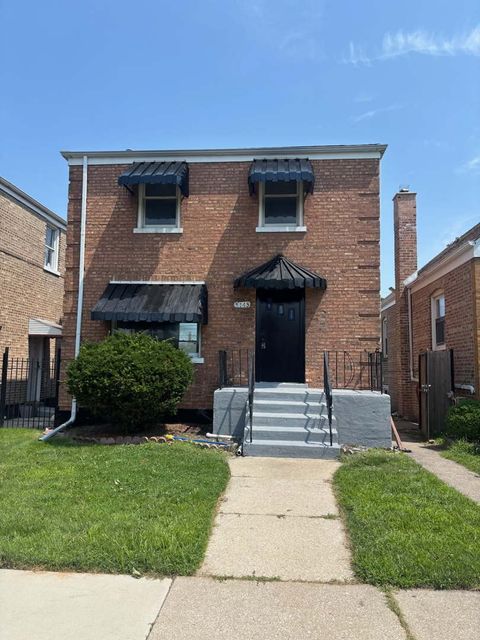
6935 S Campbell Ave, Chicago, IL 60629
$-62
Cash flow
-1.3%
Cash-on-Cash Return
5.4%
Cap rate
0.8%
Rent to Value Ratio