Cook County Investment Properties for Sale
Browse homes for sale and investment properties in Cook County. Refine your search by price, property type, or more.
Best cash flowing properties in Cook County
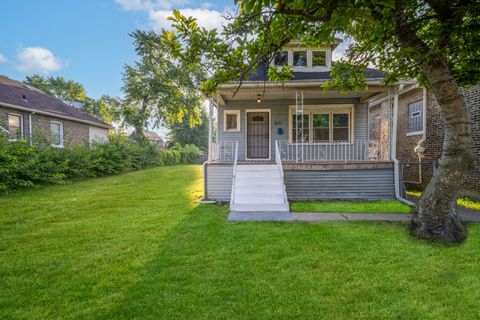
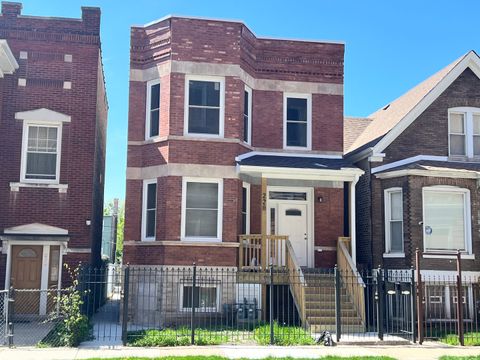
Active
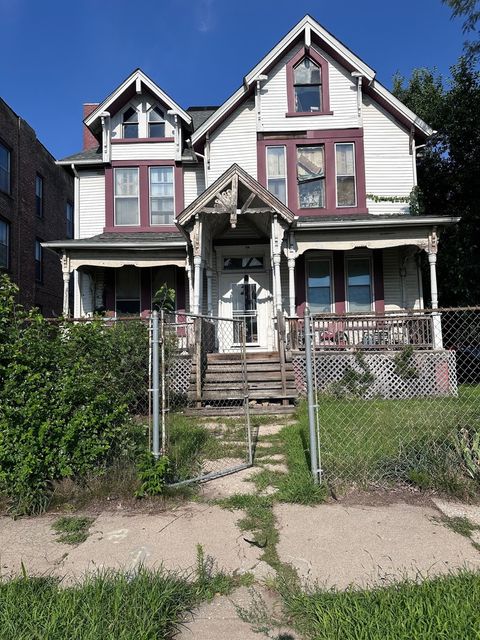
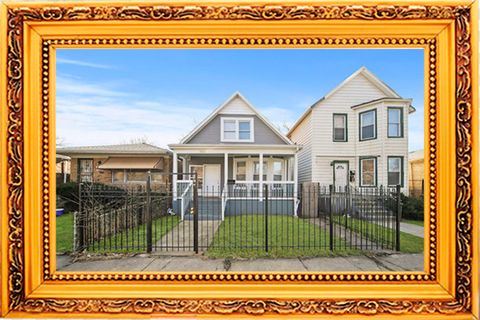
$113,000
5
bds
|
4
ba
|
3,954
sqft
|
built
1887
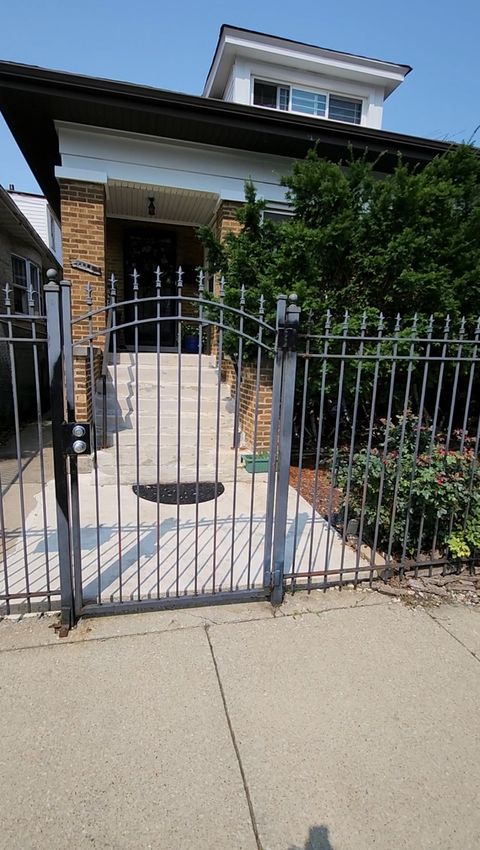
6500 S Yale Ave, Chicago, IL 60621
$2,456
Cash flow
113.4%
Cash-on-Cash Return
31.8%
Cap rate
3.9%
Rent to Value Ratio
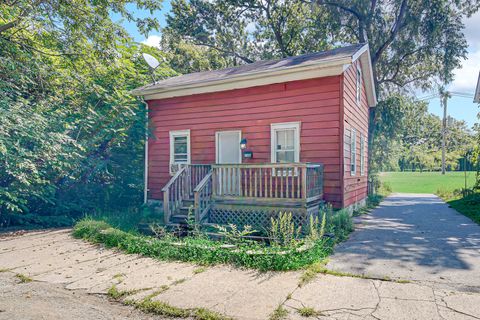
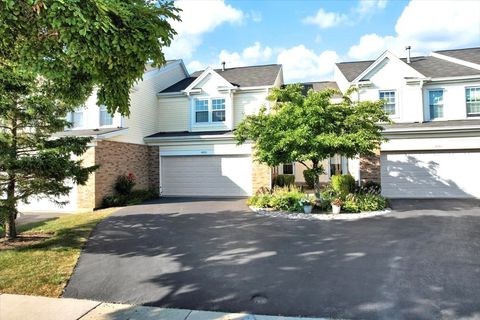
Active
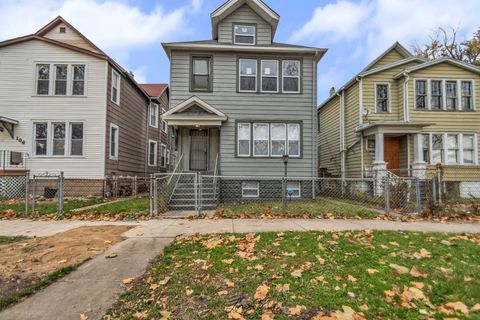
$149,000
3
bds
|
1
ba
|
800
sqft
|
built
1879
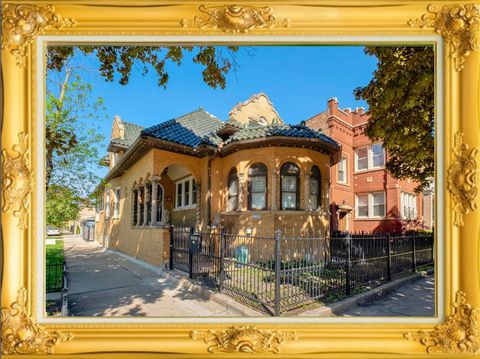
21607 Main St, Matteson, IL 60443
$693
Cash flow
24.3%
Cash-on-Cash Return
11.3%
Cap rate
1.7%
Rent to Value Ratio
4,699 out of 5,467 properties for sale in Cook County
Limited Results Shown
Create a free account, or log in to reveal all property listings and enjoy the complete experience.
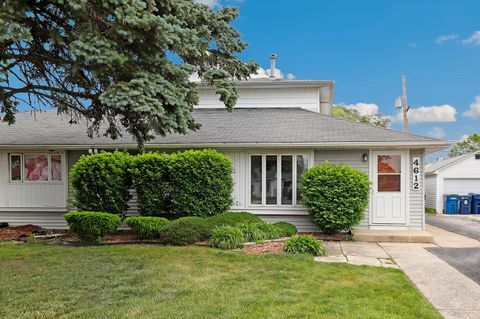
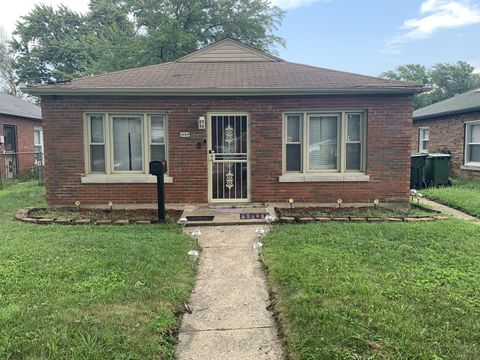
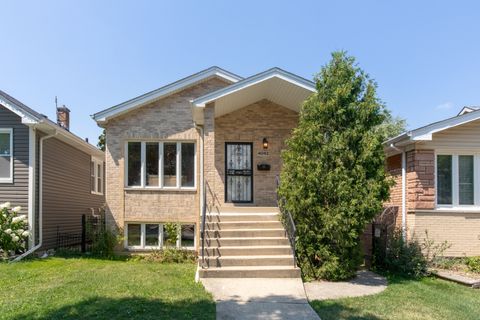
Active
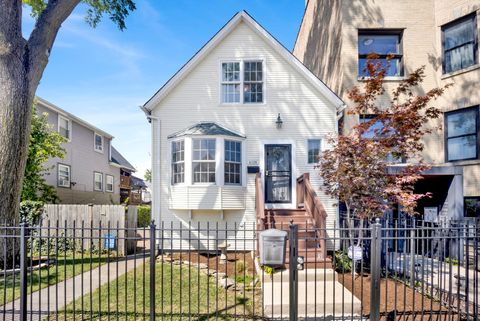
$229,900
4
bds
|
2
ba
|
1,740
sqft
|
built
1953
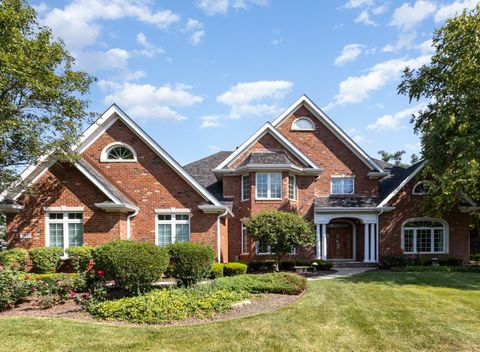
4612 W 89th Pl, Hometown, IL 60456
$150
Cash flow
3.4%
Cash-on-Cash Return
6.5%
Cap rate
0.8%
Rent to Value Ratio
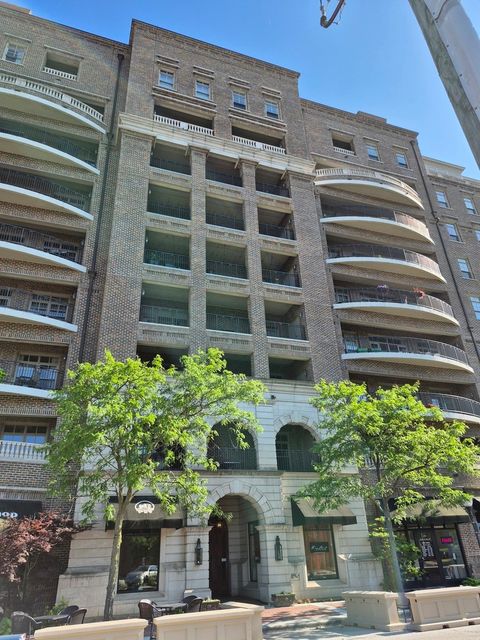
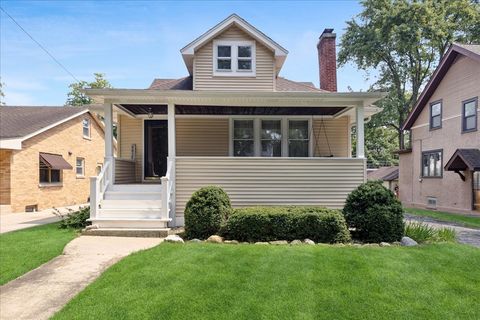
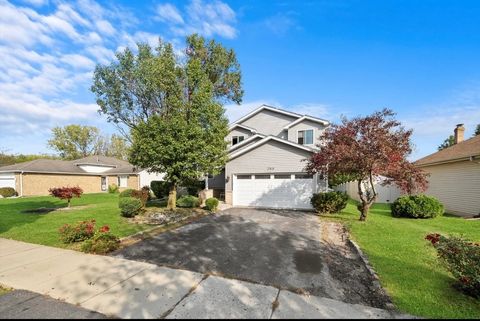
Active
$350,000
1
bds
|
1
ba
|
1,100
sqft
|
built
2003
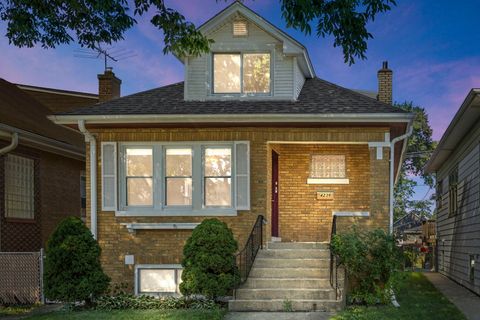
151 W Wing St, Arlington Heights, IL 60005
$-1,297
Cash flow
-19.3%
Cash-on-Cash Return
1.2%
Cap rate
0.7%
Rent to Value Ratio
Active
$69,000
2
bds
|
2
ba
|
0
sqft
|
built
1974
400 Park Ave, Calumet City, IL 60409
$256
Cash flow
4.3%
Cash-on-Cash Return
4.5%
Cap rate
2.0%
Rent to Value Ratio
Active
$224,900
3
bds
|
2
ba
|
1,462
sqft
|
built
1966
15354 Dobson Ave, South Holland, IL 60473
$346
Cash flow
8.0%
Cash-on-Cash Return
7.5%
Cap rate
1.2%
Rent to Value Ratio
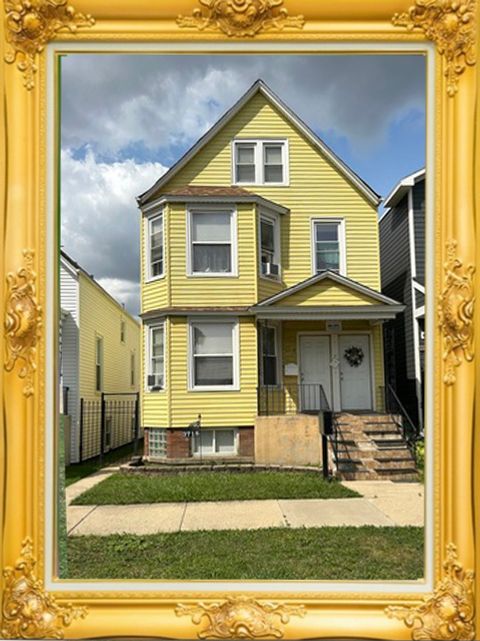
Active
$699,999
4
bds
|
0
ba
|
0
sqft
|
built
1911
3718 N Spaulding Ave, Chicago, IL 60618
$-2,752
Cash flow
-20.5%
Cash-on-Cash Return
1.0%
Cap rate
0.2%
Rent to Value Ratio
Active
$385,000
3
bds
|
2
ba
|
1,800
sqft
|
built
1925
7519 N Claremont Ave, Chicago, IL 60645
$-687
Cash flow
-9.3%
Cash-on-Cash Return
3.5%
Cap rate
0.7%
Rent to Value Ratio
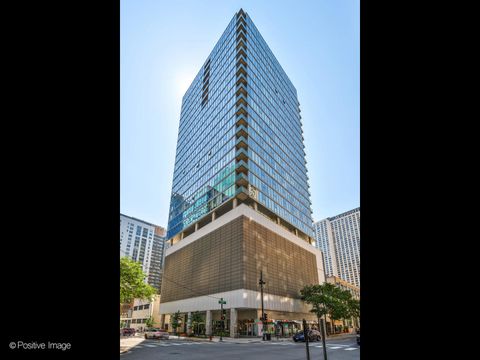
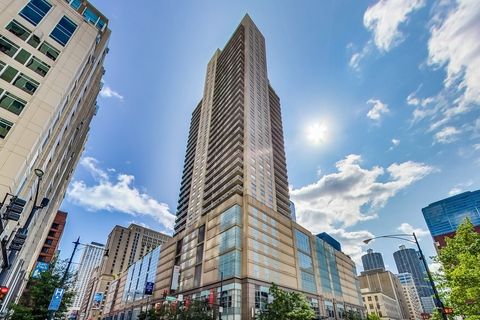
Active
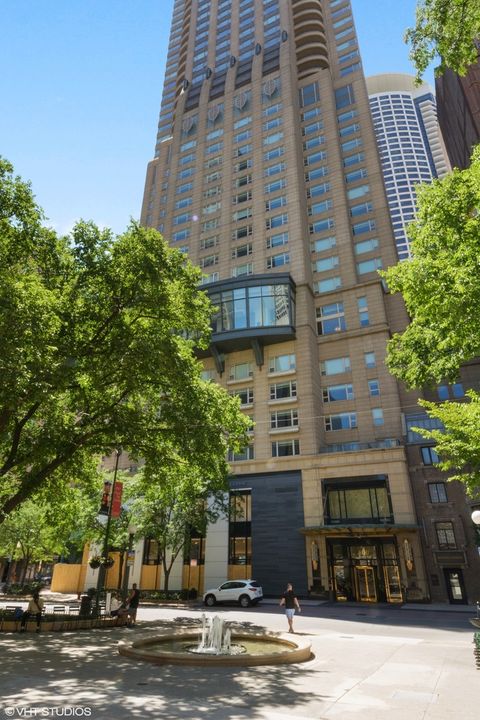
$2,500,000
4
bds
|
4
ba
|
3,200
sqft
|
built
2000
800 N Michigan Ave, Chicago, IL 60611
$-9,770
Cash flow
-20.4%
Cash-on-Cash Return
1.0%
Cap rate
0.4%
Rent to Value Ratio
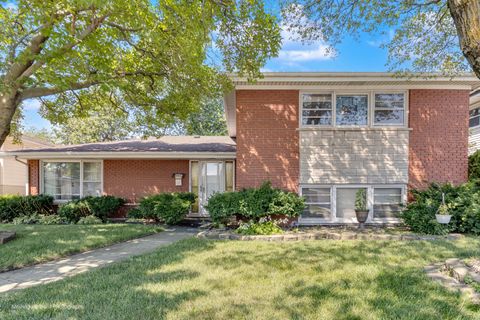
Active
$229,000
3
bds
|
1
ba
|
880
sqft
|
built
1900
7931 S East End Ave, Chicago, IL 60617
$125
Cash flow
2.8%
Cash-on-Cash Return
6.3%
Cap rate
0.9%
Rent to Value Ratio
Active
$320,000
7
bds
|
3
ba
|
0
sqft
|
built
1908
104 W 110th Pl, Chicago, IL 60628
$-550
Cash flow
-9.0%
Cash-on-Cash Return
3.6%
Cap rate
0.5%
Rent to Value Ratio
Active
$515,000
4
bds
|
2
ba
|
0
sqft
|
built
1901
4126 N Kimball Ave, Chicago, IL 60618
$-1,058
Cash flow
-10.7%
Cash-on-Cash Return
3.2%
Cap rate
0.6%
Rent to Value Ratio
Active
$349,000
3
bds
|
2
ba
|
1,100
sqft
|
built
1915
7822 S Throop St, Chicago, IL 60620
$-369
Cash flow
-5.5%
Cash-on-Cash Return
4.4%
Cap rate
0.6%
Rent to Value Ratio
Active
$799,999
4
bds
|
3
ba
|
0
sqft
|
built
1927
2100 N Avers Ave, Chicago, IL 60647
$-1,034
Cash flow
-6.7%
Cash-on-Cash Return
4.1%
Cap rate
0.6%
Rent to Value Ratio
Active
$1,459,000
5
bds
|
6
ba
|
5,500
sqft
|
built
1999
10924 Crystal Springs Ln, Orland Park, IL 60467
$-4,476
Cash flow
-16.0%
Cash-on-Cash Return
2.0%
Cap rate
0.4%
Rent to Value Ratio
Active
$470,000
3
bds
|
2
ba
|
1,800
sqft
|
built
1928
4236 N Ozark Ave, Norridge, IL 60706
$-565
Cash flow
-6.3%
Cash-on-Cash Return
4.2%
Cap rate
0.7%
Rent to Value Ratio
Active
$575,000
3
bds
|
3
ba
|
2,372
sqft
|
built
1980
1167 Longtree Ln, Wheeling, IL 60090
$-1,041
Cash flow
-9.4%
Cash-on-Cash Return
3.5%
Cap rate
0.6%
Rent to Value Ratio
Active
$649,900
4
bds
|
4
ba
|
3,133
sqft
|
built
1996
9149 Beloit Ave, Bridgeview, IL 60455
$-1,530
Cash flow
-12.3%
Cash-on-Cash Return
2.9%
Cap rate
0.5%
Rent to Value Ratio
Active
$424,900
5
bds
|
2
ba
|
2,100
sqft
|
built
1951
2202 River Rd, River Grove, IL 60171
$-264
Cash flow
-3.2%
Cash-on-Cash Return
4.9%
Cap rate
0.8%
Rent to Value Ratio
Active
$299,900
1
bds
|
1
ba
|
0
sqft
|
built
1899
2329 N Oakley Ave, Chicago, IL 60647
$-504
Cash flow
-8.8%
Cash-on-Cash Return
3.7%
Cap rate
0.7%
Rent to Value Ratio
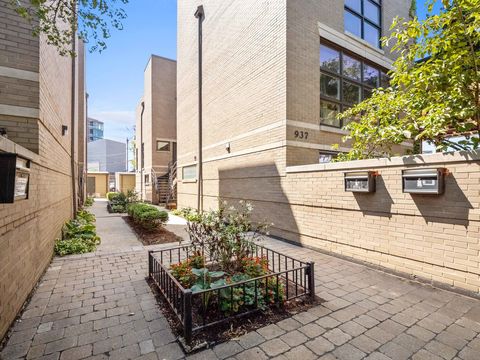
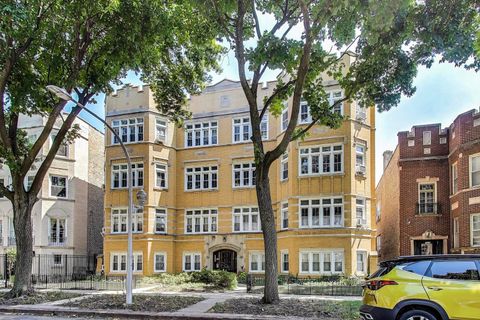
Active
$599,000
3
bds
|
3
ba
|
1,500
sqft
|
built
1988
937 W Wrightwood Ave, Chicago, IL 60614
$-834
Cash flow
-7.3%
Cash-on-Cash Return
4.0%
Cap rate
0.8%
Rent to Value Ratio
Active
$549,000
4
bds
|
3
ba
|
2,432
sqft
|
built
1956
9406 S Leavitt St, Chicago, IL 60643
$-612
Cash flow
-5.8%
Cash-on-Cash Return
4.3%
Cap rate
0.7%
Rent to Value Ratio
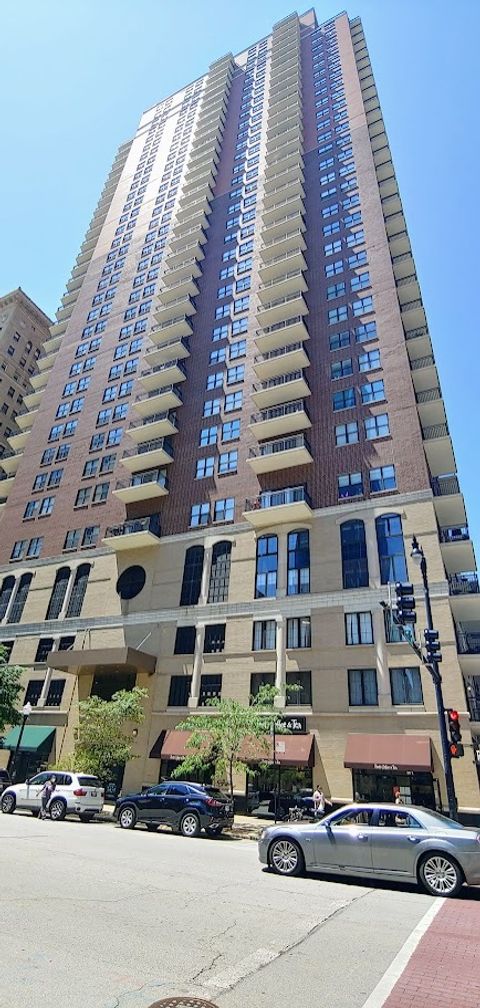
Active
$1,299,000
3
bds
|
3
ba
|
3,200
sqft
|
built
2008
550 N Saint Clair St, Chicago, IL 60611
$-5,996
Cash flow
-24.1%
Cash-on-Cash Return
0.1%
Cap rate
0.6%
Rent to Value Ratio
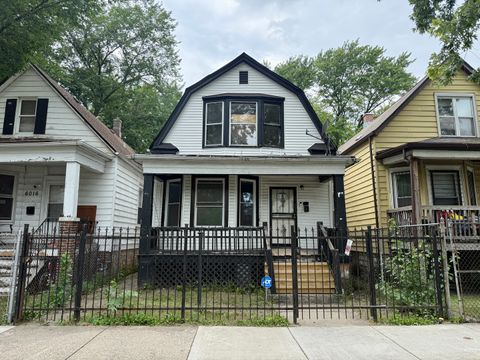
Active
$139,000
4
bds
|
2
ba
|
1,375
sqft
|
built
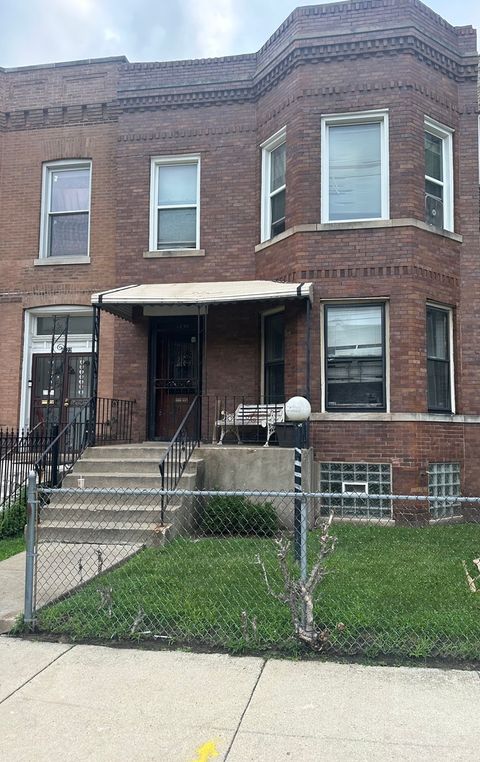
1910
6012 S Honore St, Chicago, IL 60636
$660
Cash flow
24.8%
Cash-on-Cash Return
11.4%
Cap rate
1.4%
Rent to Value Ratio
Active
$280,000
3
bds
|
2
ba
|
1,081
sqft
|
built
1906
9131 S Blackstone Ave, Chicago, IL 60619
$-240
Cash flow
-4.5%
Cash-on-Cash Return
4.7%
Cap rate
0.6%
Rent to Value Ratio
Active
$270,000
2
bds
|
2
ba
|
1,260
sqft
|
built
1988
6300 W Montrose Ave, Chicago, IL 60634
$-73
Cash flow
-1.4%
Cash-on-Cash Return
5.4%
Cap rate
0.9%
Rent to Value Ratio
Active
$340,000
5
bds
|
2
ba
|
0
sqft
|
built
1906
6420 S Evans Ave, Chicago, IL 60637
$-511
Cash flow
-7.8%
Cash-on-Cash Return
3.9%
Cap rate
0.6%
Rent to Value Ratio
Active
$210,000
3
bds
|
1
ba
|
4,389
sqft
|
built
1924
8830 S Bishop St, Chicago, IL 60620
$330
Cash flow
8.2%
Cash-on-Cash Return
7.6%
Cap rate
1.0%
Rent to Value Ratio
Active
$550,000
7
bds
|
3
ba
|
0
sqft
|
built
1900
228 N Leclaire Ave, Chicago, IL 60644
$-1,328
Cash flow
-12.6%
Cash-on-Cash Return
2.8%
Cap rate
0.4%
Rent to Value Ratio
Active
$402,000
2
bds
|
3
ba
|
1,798
sqft
|
built
1991
4890 Prestwick Pl, Hoffman Estates, IL 60010
$-938
Cash flow
-12.2%
Cash-on-Cash Return
2.9%
Cap rate
0.7%
Rent to Value Ratio
Active
$139,900
2
bds
|
1
ba
|
980
sqft
|
built
1950
14819 Champlain Ave, Dolton, IL 60419
$169
Cash flow
6.3%
Cash-on-Cash Return
7.1%
Cap rate
1.3%
Rent to Value Ratio
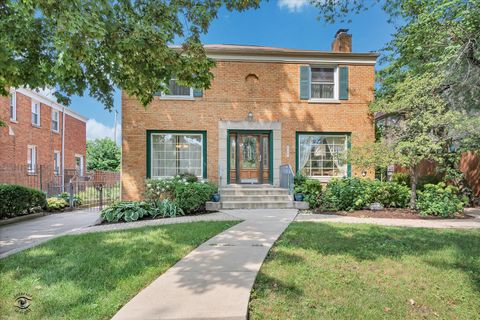
Active
$500,000
4
bds
|
2
ba
|
1,789
sqft
|
built
1921
4037 Grand Ave, Western Springs, IL 60558
$-162
Cash flow
-1.7%
Cash-on-Cash Return
5.3%
Cap rate
0.8%
Rent to Value Ratio
Active
$475,000
3
bds
|
3
ba
|
1,347
sqft
|
built
2000
4042 N Overhill Ave, Norridge, IL 60706
$-436
Cash flow
-4.8%
Cash-on-Cash Return
4.6%
Cap rate
0.7%
Rent to Value Ratio
Active
$319,000
3
bds
|
4
ba
|
1,700
sqft
|
built
2005
255 Central Ave, Matteson, IL 60443
$-17
Cash flow
-0.3%
Cash-on-Cash Return
5.6%
Cap rate
1.0%
Rent to Value Ratio
Active
$335,000
1
bds
|
1
ba
|
900
sqft
|
built
2003
545 N Dearborn St, Chicago, IL 60654
$-1,204
Cash flow
-18.8%
Cash-on-Cash Return
1.4%
Cap rate
0.8%
Rent to Value Ratio
Active
$225,000
1
bds
|
1
ba
|
800
sqft
|
built
2003
41 E 8th St, Chicago, IL 60605
$-354
Cash flow
-8.2%
Cash-on-Cash Return
3.8%
Cap rate
1.0%
Rent to Value Ratio
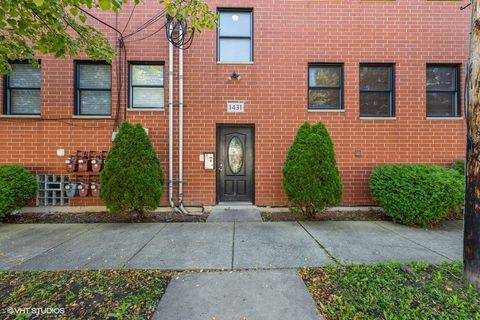
Active
$139,900
3
bds
|
2
ba
|
0
sqft
|
built
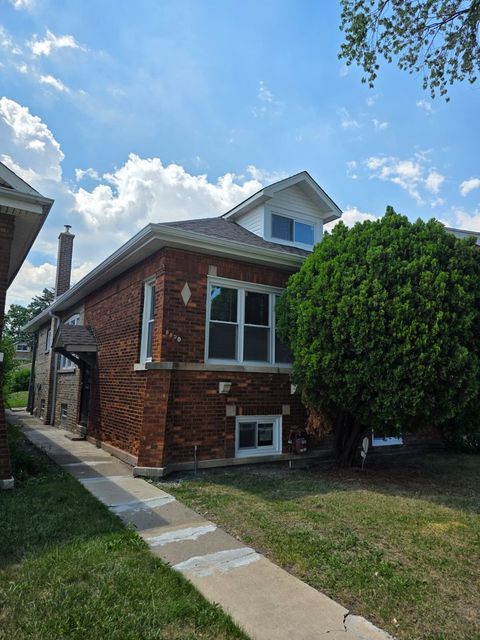
2006
1431 W 108th St, Chicago, IL 60643
$-461
Cash flow
-17.2%
Cash-on-Cash Return
1.7%
Cap rate
1.8%
Rent to Value Ratio
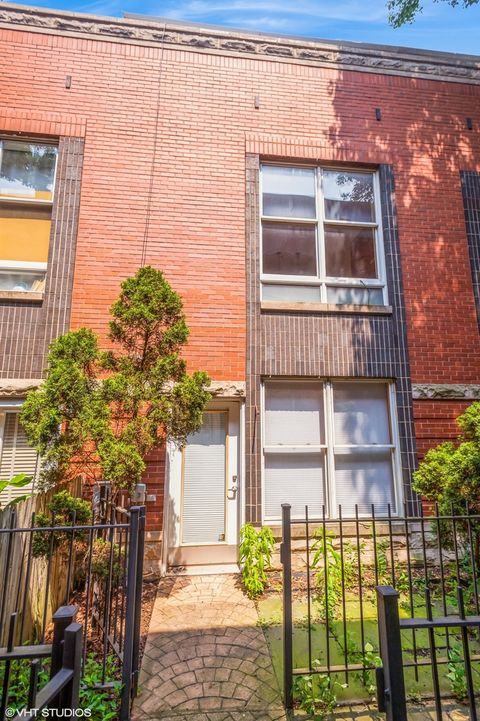
Active
$399,000
1
bds
|
2
ba
|
1,050
sqft
|
built
1998
1724 N Winnebago Ave, Chicago, IL 60647
$-747
Cash flow
-9.8%
Cash-on-Cash Return
3.4%
Cap rate
0.7%
Rent to Value Ratio
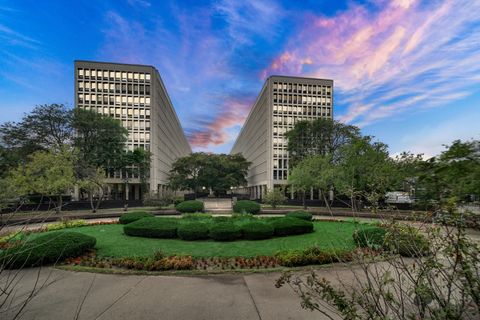
Active
$137,900
0
bds
|
1
ba
|
0
sqft
|
built
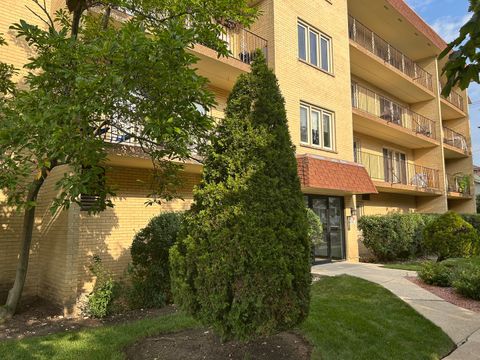
1961
1401 E 55th St, Chicago, IL 60615
$16
Cash flow
0.6%
Cash-on-Cash Return
5.8%
Cap rate
1.3%
Rent to Value Ratio
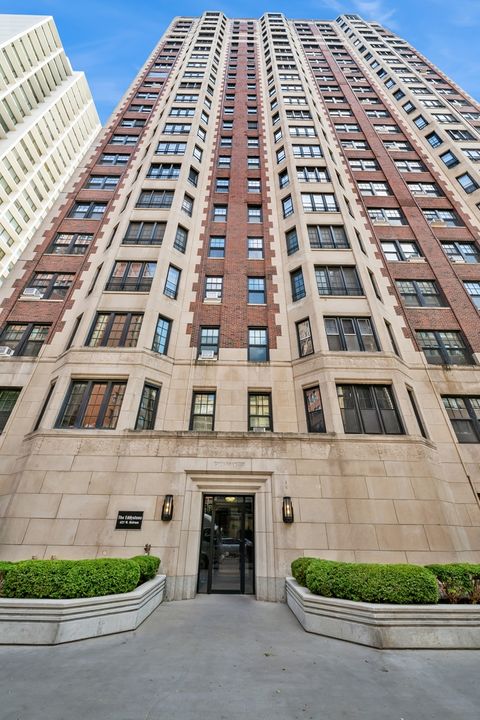
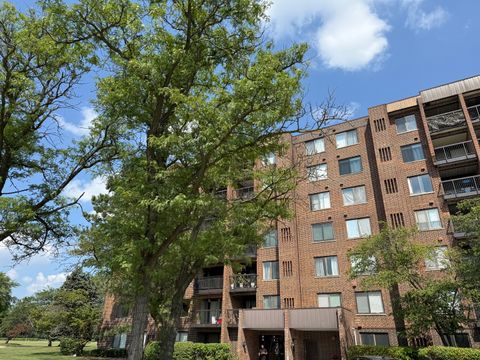
Active
$310,000
1
bds
|
1
ba
|
1,100
sqft
|
built
1929
421 W Melrose St, Chicago, IL 60657
$-1,446
Cash flow
-24.3%
Cash-on-Cash Return
0.1%
Cap rate
0.8%
Rent to Value Ratio