Cook County Investment Properties for Sale
Browse homes for sale and investment properties in Cook County. Refine your search by price, property type, or more.
Best cash flowing properties in Cook County
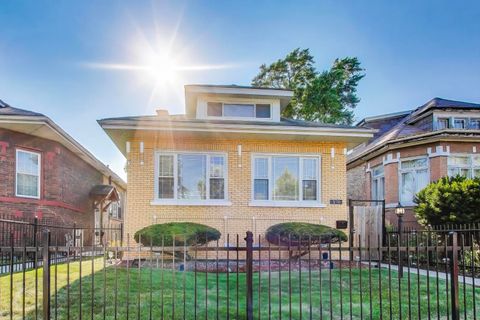
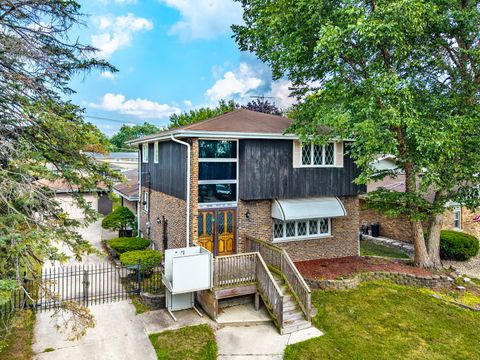
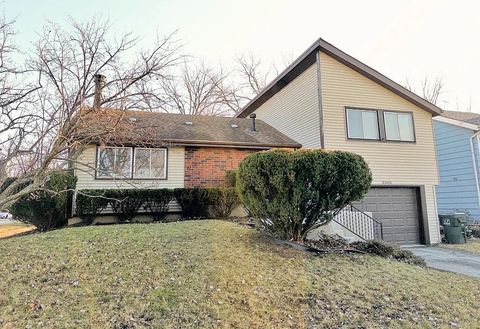
Active
$98,000
3
bds
|
1
ba
|
1,196
sqft
|
built
1923
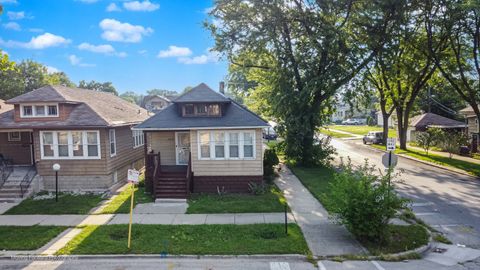
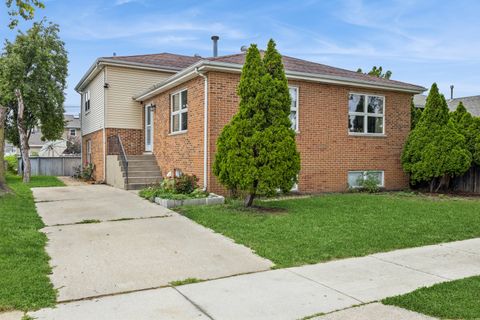
10059 S Lafayette Ave, Chicago, IL 60628
$1,053
Cash flow
56.1%
Cash-on-Cash Return
18.6%
Cap rate
2.2%
Rent to Value Ratio
Active
$359,999
3
bds
|
3
ba
|
2,300
sqft
|
built
1954
7741 Taylor St, Forest Park, IL 60130
$1,022
Cash flow
14.8%
Cash-on-Cash Return
9.1%
Cap rate
1.4%
Rent to Value Ratio
4,699 out of 5,467 properties for sale in Cook County
Limited Results Shown
Create a free account, or log in to reveal all property listings and enjoy the complete experience.
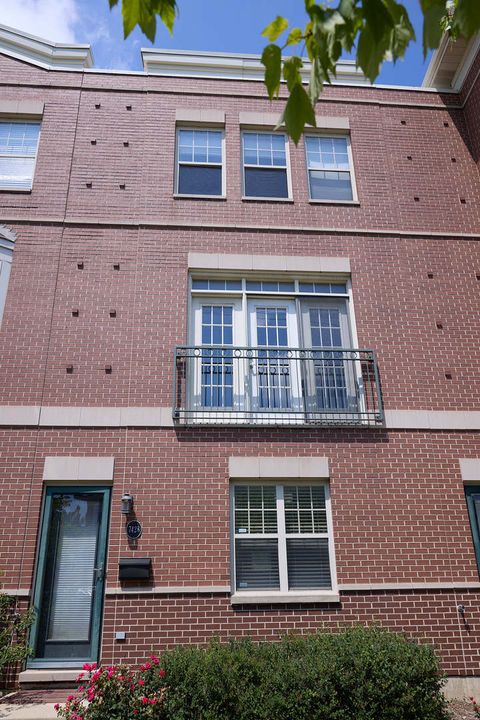
Active
$669,000
2
bds
|
2
ba
|
1,600
sqft
|
built
1924
154 W Hubbard St, Chicago, IL 60654
$-1,562
Cash flow
-12.2%
Cash-on-Cash Return
2.9%
Cap rate
0.7%
Rent to Value Ratio
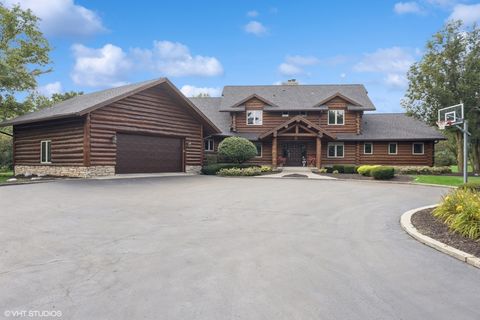
Active
$2,990,000
6
bds
|
7
ba
|
6,350
sqft
|
built
2007
3628 N Lakewood Ave, Chicago, IL 60613
$-10,922
Cash flow
-19.1%
Cash-on-Cash Return
1.3%
Cap rate
0.3%
Rent to Value Ratio
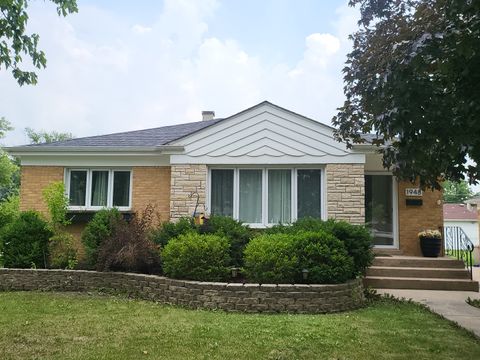
Active
$349,900
3
bds
|
1
ba
|
1,130
sqft
|
built
1957
1948 Boeger Ave, Westchester, IL 60154
$-315
Cash flow
-4.7%
Cash-on-Cash Return
4.6%
Cap rate
0.8%
Rent to Value Ratio
Active
$126,900
2
bds
|
1
ba
|
949
sqft
|
built
1952
240 Miami St, Park Forest, IL 60466
$39
Cash flow
1.6%
Cash-on-Cash Return
6.1%
Cap rate
1.5%
Rent to Value Ratio
Active
$210,000
1
bds
|
1
ba
|
0
sqft
|
built
1950
3100 N Lake Shore Dr, Chicago, IL 60657
$-38
Cash flow
-0.9%
Cash-on-Cash Return
5.5%
Cap rate
1.2%
Rent to Value Ratio
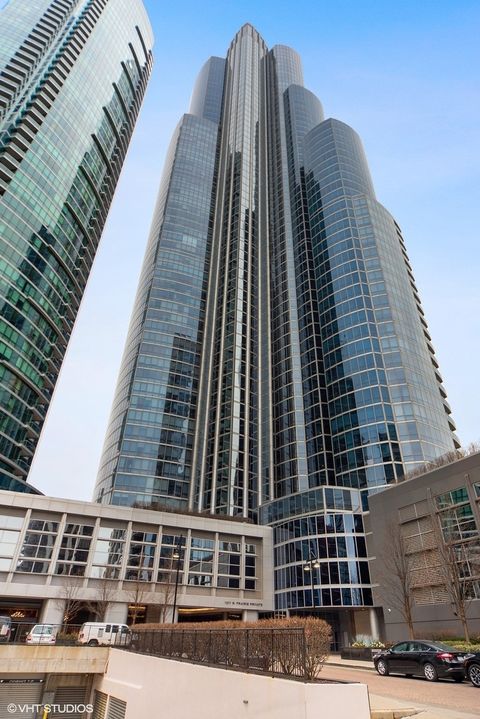
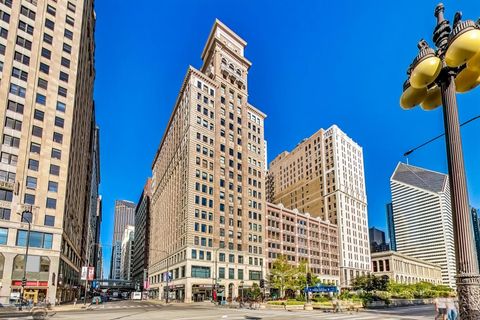
Active
$1,325,000
3
bds
|
3
ba
|
2,420
sqft
|
built
2007
1211 S Prairie Ave, Chicago, IL 60605
$-5,821
Cash flow
-22.9%
Cash-on-Cash Return
0.4%
Cap rate
0.5%
Rent to Value Ratio
Active
$1,325,000
6
bds
|
6
ba
|
0
sqft
|
built
1884
1242 W Huron St, Chicago, IL 60642
$-4,595
Cash flow
-18.1%
Cash-on-Cash Return
1.5%
Cap rate
0.3%
Rent to Value Ratio
Active
$360,000
3
bds
|
3
ba
|
1,749
sqft
|
built
1991
1111 Clover Hill Ln, Elgin, IL 60120
$-647
Cash flow
-9.4%
Cash-on-Cash Return
3.5%
Cap rate
0.7%
Rent to Value Ratio
Active
$350,500
3
bds
|
2
ba
|
1,439
sqft
|
built
1952
2419 Elm St, River Grove, IL 60171
$-525
Cash flow
-7.8%
Cash-on-Cash Return
3.9%
Cap rate
0.8%
Rent to Value Ratio
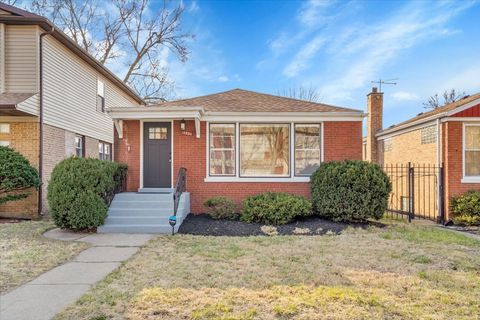
Active
$156,000
3
bds
|
1
ba
|
0
sqft
|
built
1964
15522 Dearborn St, South Holland, IL 60473
$571
Cash flow
19.1%
Cash-on-Cash Return
10.1%
Cap rate
1.6%
Rent to Value Ratio
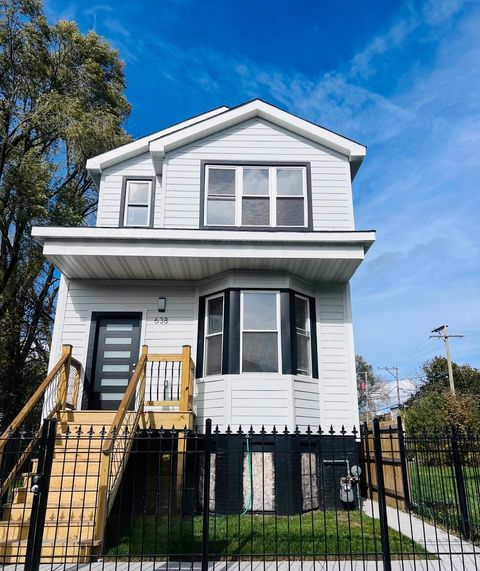
Active
$525,000
4
bds
|
4
ba
|
3,808
sqft
|
built
1890
638 E 65th St, Chicago, IL 60637
$-694
Cash flow
-6.9%
Cash-on-Cash Return
4.1%
Cap rate
0.6%
Rent to Value Ratio
Active
$779,000
4
bds
|
3
ba
|
3,400
sqft
|
built
1929
421 W Melrose St, Chicago, IL 60657
$-4,805
Cash flow
-32.2%
Cash-on-Cash Return
-1.7%
Cap rate
0.9%
Rent to Value Ratio
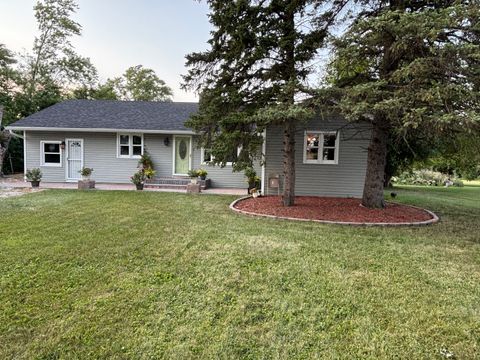
Active
$199,900
3
bds
|
2
ba
|
1,152
sqft
|
built
1965
772 Memorial Dr, Calumet City, IL 60409
$-180
Cash flow
-4.7%
Cash-on-Cash Return
4.6%
Cap rate
1.1%
Rent to Value Ratio
Active
$420,000
5
bds
|
4
ba
|
0
sqft
|
built
1912
5758 S Honore St, Chicago, IL 60636
$-676
Cash flow
-8.4%
Cash-on-Cash Return
3.7%
Cap rate
0.5%
Rent to Value Ratio
Active
$299,900
3
bds
|
2
ba
|
3,286
sqft
|
built
1927
9118 S Marshfield Ave, Chicago, IL 60620
$479
Cash flow
8.3%
Cash-on-Cash Return
7.6%
Cap rate
1.0%
Rent to Value Ratio
Active
$334,900
3
bds
|
3
ba
|
2,529
sqft
|
built
1913
7842 S Evans Ave, Chicago, IL 60619
$-449
Cash flow
-7.0%
Cash-on-Cash Return
4.1%
Cap rate
0.5%
Rent to Value Ratio
Active
$255,000
1
bds
|
1
ba
|
850
sqft
|
built
2007
974 W 35th Pl, Chicago, IL 60609
$-338
Cash flow
-6.9%
Cash-on-Cash Return
4.1%
Cap rate
0.9%
Rent to Value Ratio
Active
$279,000
2
bds
|
1
ba
|
1,050
sqft
|
built
1949
1543 Cleveland Ave, La Grange Park, IL 60526
$-187
Cash flow
-3.5%
Cash-on-Cash Return
4.9%
Cap rate
0.9%
Rent to Value Ratio
Active
$490,000
4
bds
|
2
ba
|
2,318
sqft
|
built
1986
6614 Kane Ave, Hodgkins, IL 60525
$-891
Cash flow
-9.5%
Cash-on-Cash Return
3.5%
Cap rate
0.6%
Rent to Value Ratio
Active
$185,000
4
bds
|
2
ba
|
1,530
sqft
|
built
1985
2925 201st Pl, Lynwood, IL 60411
$357
Cash flow
10.1%
Cash-on-Cash Return
8.0%
Cap rate
1.4%
Rent to Value Ratio
Active
$499,000
3
bds
|
4
ba
|
3,820
sqft
|
built
2001
109 Commons Dr, Palos Park, IL 60464
$-1,174
Cash flow
-12.3%
Cash-on-Cash Return
2.9%
Cap rate
0.6%
Rent to Value Ratio
Active
$284,999
5
bds
|
2
ba
|
0
sqft
|
built
1898
6615 S Rhodes Ave, Chicago, IL 60637
$-37
Cash flow
-0.7%
Cash-on-Cash Return
5.5%
Cap rate
0.8%
Rent to Value Ratio
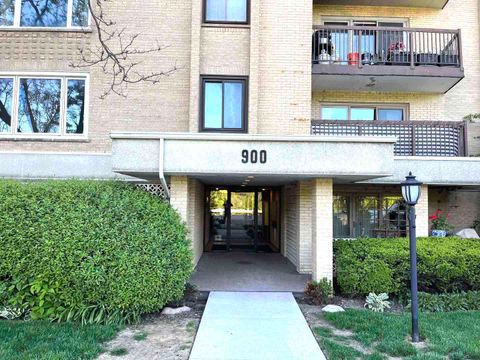
Active
$249,900
2
bds
|
2
ba
|
1,200
sqft
|
built
1974
900 S River Rd, Des Plaines, IL 60016
$-363
Cash flow
-7.6%
Cash-on-Cash Return
3.9%
Cap rate
0.9%
Rent to Value Ratio
Active
$289,000
1
bds
|
1
ba
|
800
sqft
|
built
1964
1460 N Sandburg Ter, Chicago, IL 60610
$-765
Cash flow
-13.8%
Cash-on-Cash Return
2.5%
Cap rate
0.9%
Rent to Value Ratio
Active
$175,000
1
bds
|
1
ba
|
0
sqft
|
built
1955
2424 W Estes Ave, Chicago, IL 60645
$-300
Cash flow
-8.9%
Cash-on-Cash Return
3.6%
Cap rate
0.9%
Rent to Value Ratio
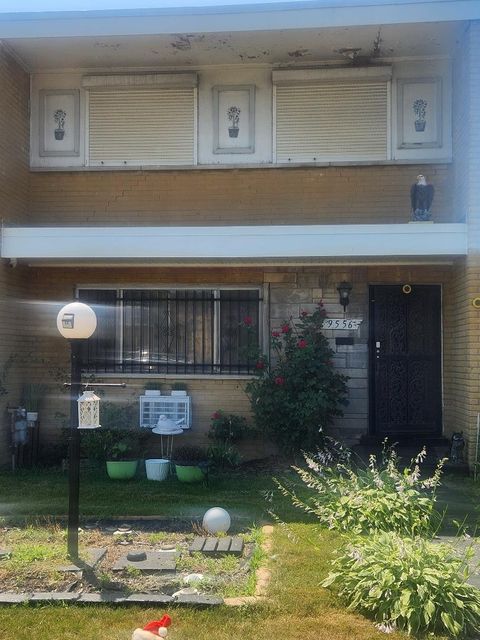
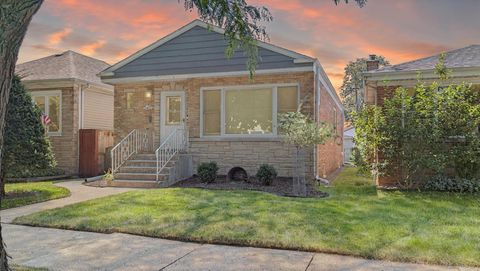
Active
$160,000
3
bds
|
2
ba
|
950
sqft
|
built
1952
9556 S Colfax Ave, Chicago, IL 60617
$347
Cash flow
11.3%
Cash-on-Cash Return
8.3%
Cap rate
1.0%
Rent to Value Ratio
Active
$375,000
3
bds
|
3
ba
|
2,052
sqft
|
built
2004
7428 W Fullerton Ave, Elmwood Park, IL 60707
$-827
Cash flow
-11.5%
Cash-on-Cash Return
3.0%
Cap rate
0.8%
Rent to Value Ratio
Active
$1,250,000
6
bds
|
4
ba
|
4,005
sqft
|
built
2000
11711 Juanita Dr, Orland Park, IL 60467
$-2,209
Cash flow
-9.2%
Cash-on-Cash Return
3.6%
Cap rate
0.6%
Rent to Value Ratio
Active
$450,000
2
bds
|
2
ba
|
1,350
sqft
|
built
1898
6 N Michigan Ave, Chicago, IL 60602
$-1,416
Cash flow
-16.4%
Cash-on-Cash Return
1.9%
Cap rate
0.9%
Rent to Value Ratio
Active
$284,900
4
bds
|
1
ba
|
1,709
sqft
|
built
1959
2312 209th St, Chicago Heights, IL 60411
$-77
Cash flow
-1.4%
Cash-on-Cash Return
5.4%
Cap rate
0.8%
Rent to Value Ratio
Active
$275,000
3
bds
|
3
ba
|
1,537
sqft
|
built
1973
18309 Bock Rd, Lansing, IL 60438
$-710
Cash flow
-13.5%
Cash-on-Cash Return
2.6%
Cap rate
0.8%
Rent to Value Ratio
Active
$220,900
3
bds
|
2
ba
|
3,720
sqft
|
built
1921
11814 S Parnell Ave, Chicago, IL 60628
$66
Cash flow
1.6%
Cash-on-Cash Return
6.0%
Cap rate
0.8%
Rent to Value Ratio
Active
$215,000
4
bds
|
2
ba
|
0
sqft
|
built
1888
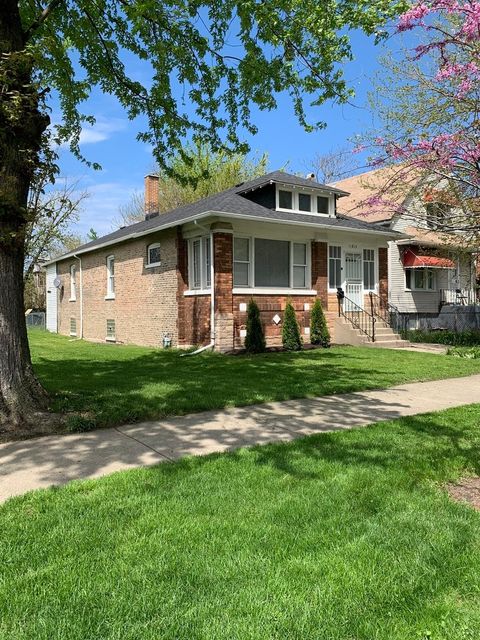
13430 Ann St, Blue Island, IL 60406
$-424
Cash flow
-10.3%
Cash-on-Cash Return
3.3%
Cap rate
0.8%
Rent to Value Ratio
Active
$437,900
5
bds
|
3
ba
|
3,882
sqft
|
built
1999
3713 Dewey Ave, Richton Park, IL 60471
$-695
Cash flow
-8.3%
Cash-on-Cash Return
3.8%
Cap rate
0.9%
Rent to Value Ratio
Active
$245,900
3
bds
|
2
ba
|
1,500
sqft
|
built
1971
3303 Charlemagne Ave, Hazel Crest, IL 60429
$42
Cash flow
0.9%
Cash-on-Cash Return
5.9%
Cap rate
1.1%
Rent to Value Ratio
Active
$465,000
2
bds
|
2
ba
|
1,730
sqft
|
built
1954
5452 N Natchez Ave, Chicago, IL 60656
$-549
Cash flow
-6.2%
Cash-on-Cash Return
4.3%
Cap rate
0.7%
Rent to Value Ratio
Active
$699,000
4
bds
|
3
ba
|
2,563
sqft
|
built
1895
603 Wesley Ave, Oak Park, IL 60304
$-1,841
Cash flow
-13.7%
Cash-on-Cash Return
2.5%
Cap rate
0.6%
Rent to Value Ratio
Active
$250,000
3
bds
|
3
ba
|
1,185
sqft
|
built
1954
10854 S Union Ave, Chicago, IL 60628
$-62
Cash flow
-1.3%
Cash-on-Cash Return
5.4%
Cap rate
0.8%
Rent to Value Ratio