Cook County Investment Properties for Sale
Browse homes for sale and investment properties in Cook County. Refine your search by price, property type, or more.
Best cash flowing properties in Cook County
Active
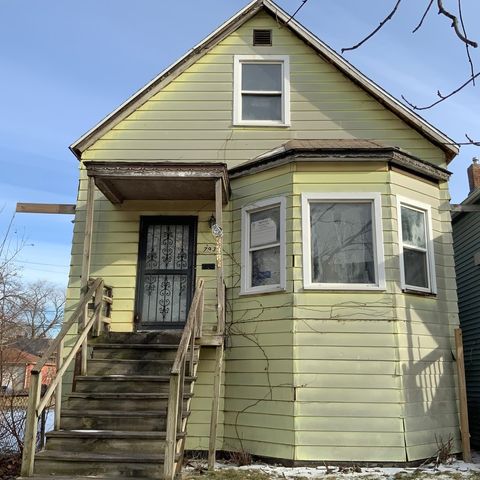
$50,000
4
bds
|
3
ba
|
2,000
sqft
|
built
1910
7935 S Coles Ave, Chicago, IL 60617
$1,300
Cash flow
30.3%
Cash-on-Cash Return
31.2%
Cap rate
4.0%
Rent to Value Ratio
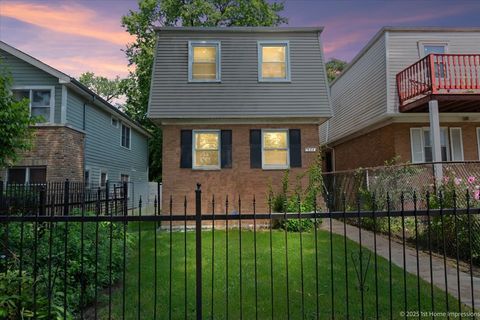
Active
$130,000
3
bds
|
2
ba
|
1,192
sqft
|
built
1981
644 W Englewood Ave, Chicago, IL 60621
$651
Cash flow
26.1%
Cash-on-Cash Return
11.7%
Cap rate
1.5%
Rent to Value Ratio
4,811 out of 5,592 properties for sale in Cook County
Limited Results Shown
Create a free account, or log in to reveal all property listings and enjoy the complete experience.
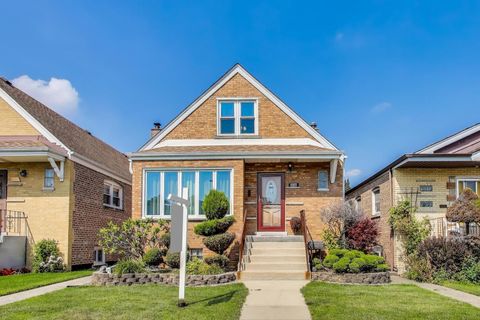
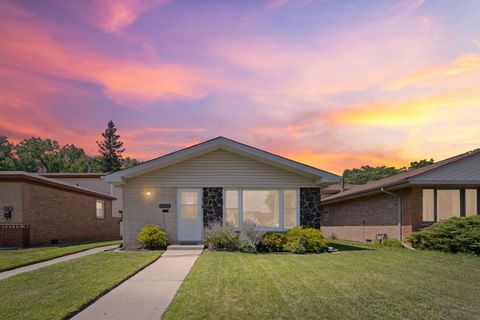
Active
$325,000
4
bds
|
2
ba
|
2,644
sqft
|
built
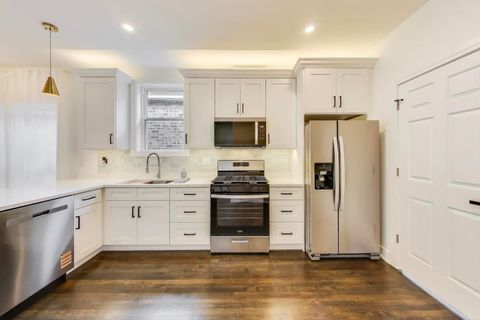
1955
5030 S Laporte Ave, Chicago, IL 60638
$-79
Cash flow
-1.3%
Cash-on-Cash Return
5.4%
Cap rate
0.8%
Rent to Value Ratio
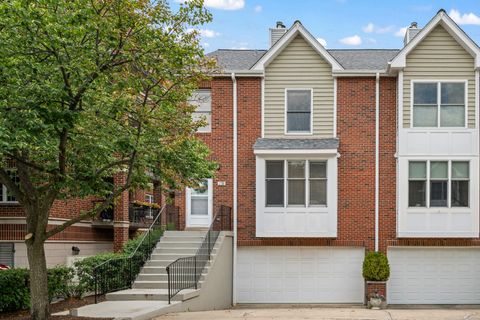
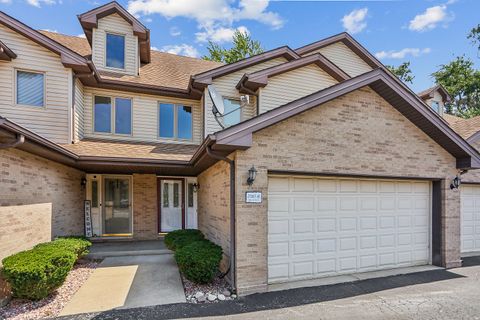
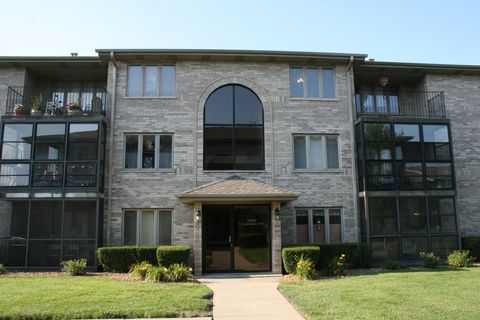
Active
$450,000
3
bds
|
3
ba
|
2,000
sqft
|
built
1997
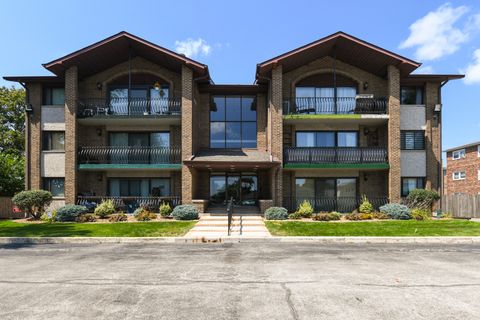
238 N Village Ct, Palatine, IL 60067
$-1,536
Cash flow
-17.8%
Cash-on-Cash Return
1.6%
Cap rate
0.6%
Rent to Value Ratio
Active
$270,000
2
bds
|
3
ba
|
1,684
sqft
|
built
2001
7025 167th St, Tinley Park, IL 60477
$77
Cash flow
1.5%
Cash-on-Cash Return
6.0%
Cap rate
1.0%
Rent to Value Ratio
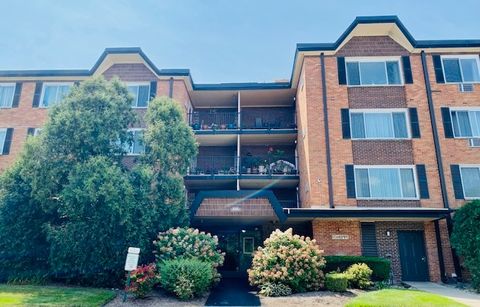
Active
$189,900
1
bds
|
1
ba
|
860
sqft
|
built
1971
1217 S Old Wilke Rd, Arlington Heights, IL 60005
$-269
Cash flow
-7.4%
Cash-on-Cash Return
4.0%
Cap rate
0.9%
Rent to Value Ratio
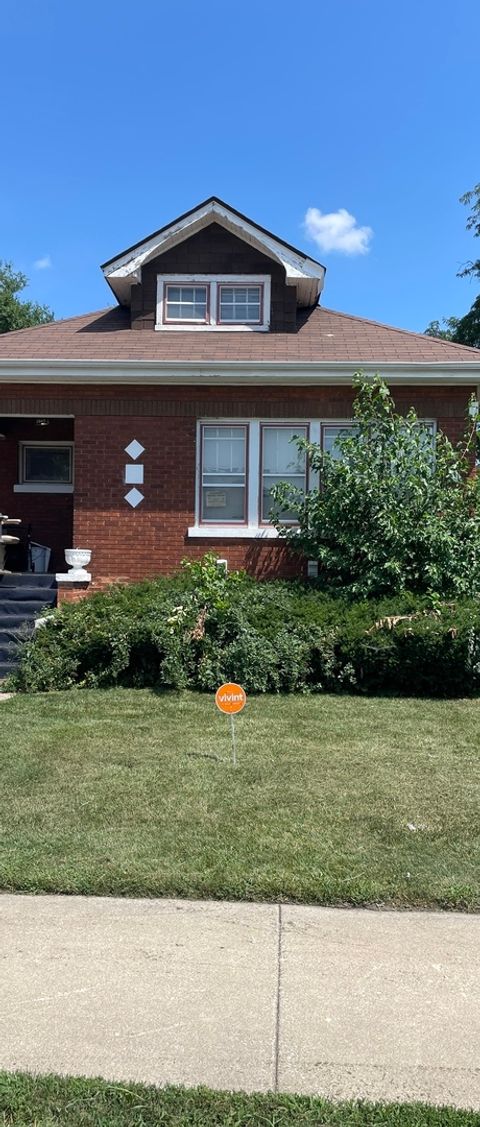
Active
$160,000
2
bds
|
1
ba
|
972
sqft
|
built
1922
2015 S 11th Ave, Maywood, IL 60153
$326
Cash flow
10.6%
Cash-on-Cash Return
8.1%
Cap rate
1.4%
Rent to Value Ratio
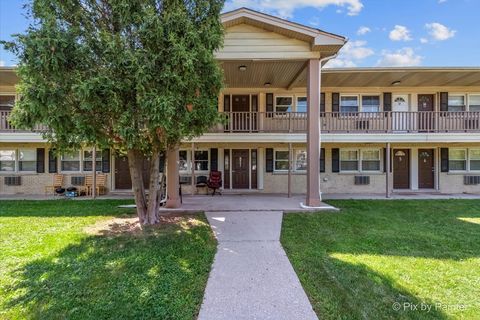
Active
$124,900
1
bds
|
1
ba
|
563
sqft
|
built
1967
821 Bode Rd, Elgin, IL 60120
$19
Cash flow
0.8%
Cash-on-Cash Return
5.9%
Cap rate
1.3%
Rent to Value Ratio
Active
$230,000
3
bds
|
2
ba
|
1,100
sqft
|
built
1971
14112 S Saginaw Ave, Burnham, IL 60633
$-240
Cash flow
-5.4%
Cash-on-Cash Return
4.4%
Cap rate
0.9%
Rent to Value Ratio
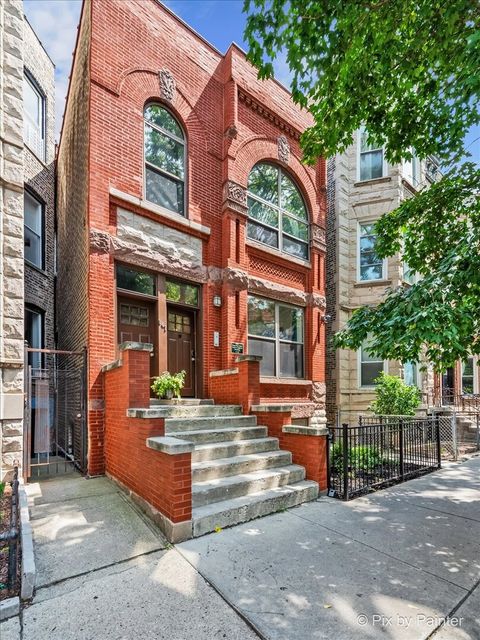
Active
$495,000
3
bds
|
3
ba
|
1,400
sqft
|
built
1886
847 N Damen Ave, Chicago, IL 60622
$-765
Cash flow
-8.1%
Cash-on-Cash Return
3.8%
Cap rate
0.7%
Rent to Value Ratio
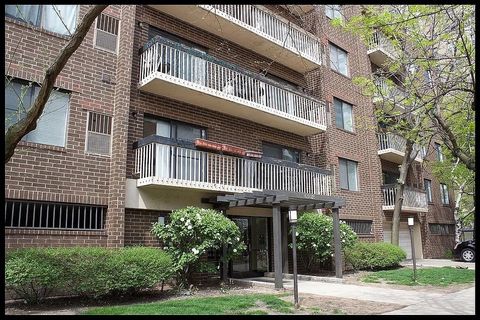
Active
$199,900
1
bds
|
1
ba
|
750
sqft
|
built
1988
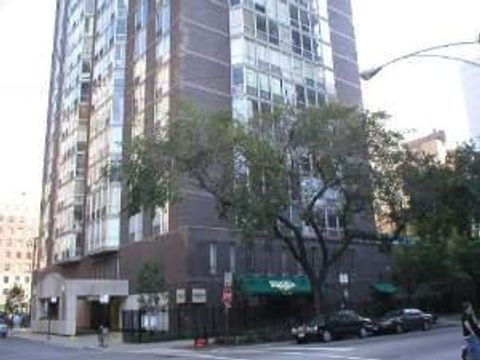
6102 N Sheridan Rd, Chicago, IL 60660
$143
Cash flow
3.7%
Cash-on-Cash Return
6.5%
Cap rate
1.0%
Rent to Value Ratio
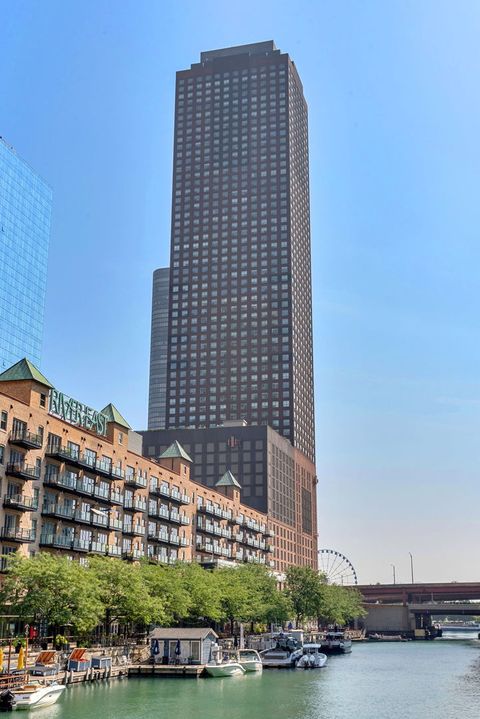
Active
$225,000
0
bds
|
1
ba
|
642
sqft
|
built
1991
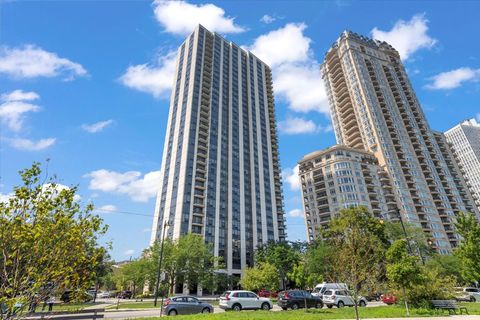
474 N Lake Shore Dr, Chicago, IL 60611
$-597
Cash flow
-13.8%
Cash-on-Cash Return
2.5%
Cap rate
0.9%
Rent to Value Ratio
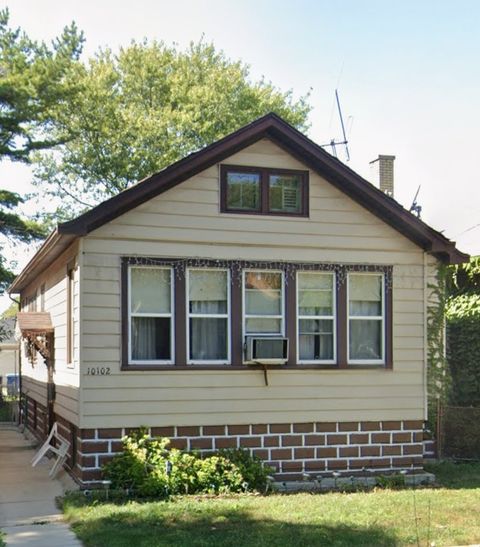
Active
$140,000
3
bds
|
1
ba
|
1,008
sqft
|
built
1923
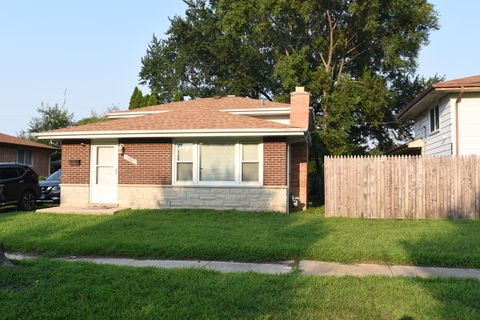
10102 S Yale Ave, Chicago, IL 60628
$500
Cash flow
18.6%
Cash-on-Cash Return
10.0%
Cap rate
1.3%
Rent to Value Ratio
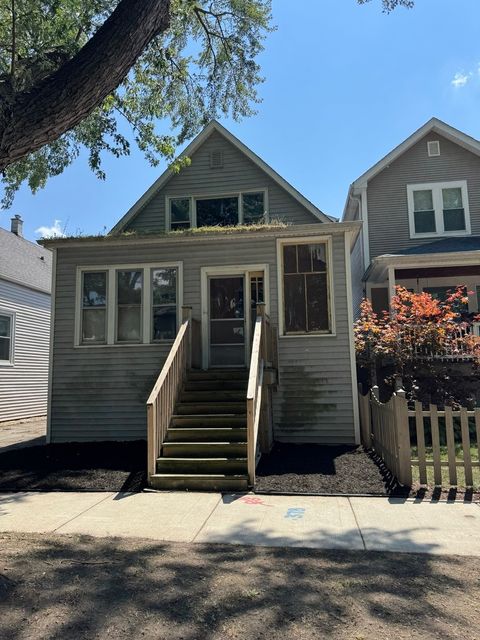
Active
$374,900
4
bds
|
2
ba
|
1,320
sqft
|
built
1906
3721 W Sunnyside Ave, Chicago, IL 60625
$-219
Cash flow
-3.0%
Cash-on-Cash Return
5.0%
Cap rate
0.9%
Rent to Value Ratio
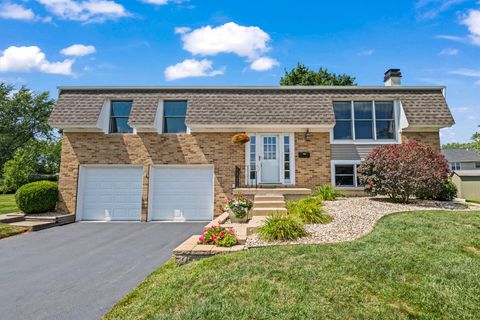
Active
$469,900
4
bds
|
2
ba
|
1,900
sqft
|
built
1972
3960 Colony Ct, Hoffman Estates, IL 60192
$-719
Cash flow
-8.0%
Cash-on-Cash Return
3.8%
Cap rate
0.7%
Rent to Value Ratio
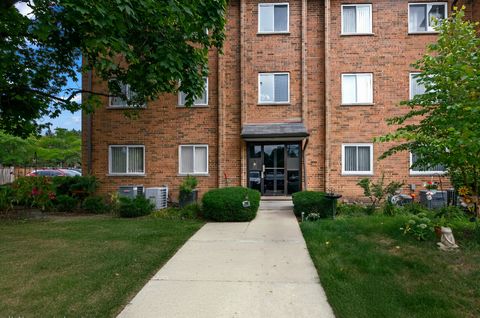
Active
$237,000
2
bds
|
2
ba
|
0
sqft
|
built
1984
900 Casey Ct, Schaumburg, IL 60173
$-173
Cash flow
-3.8%
Cash-on-Cash Return
4.8%
Cap rate
0.8%
Rent to Value Ratio
Active
$370,000
3
bds
|
2
ba
|
1,573
sqft
|
built
1985
82 Washington Ave, Streamwood, IL 60107
$-358
Cash flow
-5.0%
Cash-on-Cash Return
4.5%
Cap rate
0.8%
Rent to Value Ratio
Active
$325,000
2
bds
|
3
ba
|
2,190
sqft
|
built
1981
6400 N Cicero Ave, Lincolnwood, IL 60712
$-673
Cash flow
-10.8%
Cash-on-Cash Return
3.2%
Cap rate
1.1%
Rent to Value Ratio
Active
$199,900
2
bds
|
1
ba
|
900
sqft
|
built
1969
633 Dulles Rd, Des Plaines, IL 60016
$-328
Cash flow
-8.6%
Cash-on-Cash Return
3.7%
Cap rate
0.9%
Rent to Value Ratio
Active
$215,000
2
bds
|
2
ba
|
1,050
sqft
|
built
1971
10210 Washington Ave, Oak Lawn, IL 60453
$-323
Cash flow
-7.8%
Cash-on-Cash Return
3.9%
Cap rate
0.8%
Rent to Value Ratio
Active
$149,990
2
bds
|
1
ba
|
960
sqft
|
built
1923
1710 169th St, Hazel Crest, IL 60429
$270
Cash flow
9.4%
Cash-on-Cash Return
7.8%
Cap rate
1.3%
Rent to Value Ratio
Active
$380,000
3
bds
|
3
ba
|
1,512
sqft
|
built
1961
436 Glendale Rd, Glenview, IL 60025
$78
Cash flow
1.1%
Cash-on-Cash Return
5.9%
Cap rate
0.8%
Rent to Value Ratio
Active
$599,900
3
bds
|
2
ba
|
2,300
sqft
|
built
1953
4021 W Estes Ave, Lincolnwood, IL 60712
$-579
Cash flow
-5.0%
Cash-on-Cash Return
4.5%
Cap rate
0.7%
Rent to Value Ratio
Active
$1,100,000
6
bds
|
5
ba
|
3,943
sqft
|
built
2008
11942 S Oak Park Ave, Palos Heights, IL 60463
$-2,967
Cash flow
-14.1%
Cash-on-Cash Return
2.4%
Cap rate
0.5%
Rent to Value Ratio
Active
$229,000
2
bds
|
2
ba
|
1,100
sqft
|
built
1980
9051 S Roberts Rd, Hickory Hills, IL 60457
$-235
Cash flow
-5.4%
Cash-on-Cash Return
4.4%
Cap rate
0.9%
Rent to Value Ratio
Active
$194,900
2
bds
|
2
ba
|
0
sqft
|
built
2003
13934 E Leamington Dr, Crestwood, IL 60418
$-223
Cash flow
-6.0%
Cash-on-Cash Return
4.3%
Cap rate
0.9%
Rent to Value Ratio
Active
$450,000
3
bds
|
2
ba
|
1,726
sqft
|
built
1952
1504 E Olive St, Arlington Heights, IL 60004
$-619
Cash flow
-7.2%
Cash-on-Cash Return
4.0%
Cap rate
0.7%
Rent to Value Ratio
Active
$99,980
3
bds
|
1
ba
|
1,044
sqft
|
built
1961
16454 Paulina St, Markham, IL 60428
$627
Cash flow
32.7%
Cash-on-Cash Return
13.2%
Cap rate
2.2%
Rent to Value Ratio
Active
$374,999
2
bds
|
1
ba
|
788
sqft
|
built
1949
17 N Pine St, Mount Prospect, IL 60056
$-630
Cash flow
-8.8%
Cash-on-Cash Return
3.7%
Cap rate
0.7%
Rent to Value Ratio

Active
$379,900
3
bds
|
2
ba
|
1,248
sqft
|
built
1965
1408 S Hickory Dr, Mount Prospect, IL 60056
$-203
Cash flow
-2.8%
Cash-on-Cash Return
5.0%
Cap rate
0.8%
Rent to Value Ratio
Active
$142,500
0
bds
|
1
ba
|
0
sqft
|
built
1976
1813 Hemlock Pl, Schaumburg, IL 60173
$-130
Cash flow
-4.8%
Cash-on-Cash Return
4.6%
Cap rate
0.9%
Rent to Value Ratio
Active
$319,900
3
bds
|
3
ba
|
1,500
sqft
|
built
1998
14517 S Troy Ave, Posen, IL 60469
$34
Cash flow
0.6%
Cash-on-Cash Return
5.8%
Cap rate
0.9%
Rent to Value Ratio
Active
$449,900
4
bds
|
4
ba
|
2,700
sqft
|
built
1987
3007 Monterey Dr, Flossmoor, IL 60422
$-397
Cash flow
-4.6%
Cash-on-Cash Return
4.6%
Cap rate
0.9%
Rent to Value Ratio
Active
$148,600
3
bds
|
2
ba
|
889
sqft
|
built
1972
14647 Irving Ave, Dolton, IL 60419
$37
Cash flow
1.3%
Cash-on-Cash Return
6.0%
Cap rate
1.3%
Rent to Value Ratio
Active
$153,200
bds
|
1
ba
|
0
sqft
|
built
1960
21 W Goethe St, Chicago, IL 60610
$-481
Cash flow
-16.4%
Cash-on-Cash Return
1.9%
Cap rate
1.1%
Rent to Value Ratio
Active
$920,000
3
bds
|
2
ba
|
1,850
sqft
|
built
1975
2500 N Lakeview Ave, Chicago, IL 60614
$-3,618
Cash flow
-20.5%
Cash-on-Cash Return
1.0%
Cap rate
0.5%
Rent to Value Ratio
Active
$325,000
2
bds
|
2
ba
|
1,198
sqft
|
built
1924
6446 S Whipple St, Chicago, IL 60629
$-473
Cash flow
-7.6%
Cash-on-Cash Return
3.9%
Cap rate
0.6%
Rent to Value Ratio
Active
$199,900
3
bds
|
2
ba
|
1,296
sqft
|
built
1891
17 W 30th Pl, Steger, IL 60475
$154
Cash flow
4.0%
Cash-on-Cash Return
6.6%
Cap rate
1.0%
Rent to Value Ratio
Active
$180,000
3
bds
|
1
ba
|
1,393
sqft
|
built
1961
920 Sunnyside Ave, Thornton, IL 60476
$359
Cash flow
10.4%
Cash-on-Cash Return
8.1%
Cap rate
1.4%
Rent to Value Ratio
Active
$250,000
3
bds
|
3
ba
|
1,333
sqft
|
built
1957
320 Streamside Dr, Harvey, IL 60426
$-162
Cash flow
-3.4%
Cash-on-Cash Return
4.9%
Cap rate
0.8%
Rent to Value Ratio