Cook County Investment Properties for Sale
Browse homes for sale and investment properties in Cook County. Refine your search by price, property type, or more.
Best cash flowing properties in Cook County
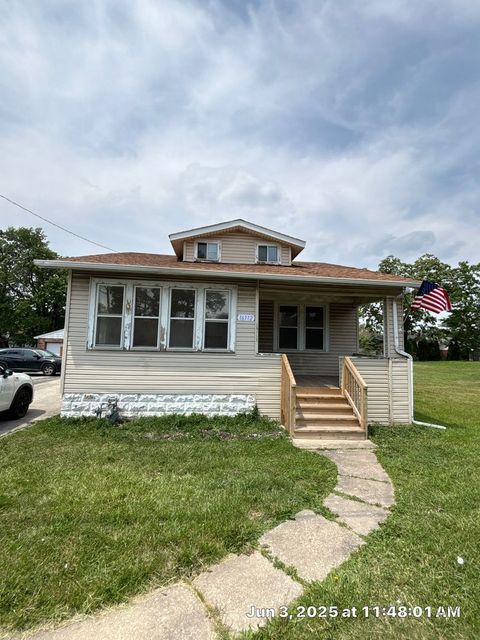
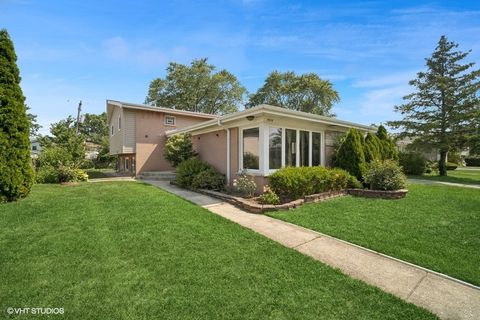
Active
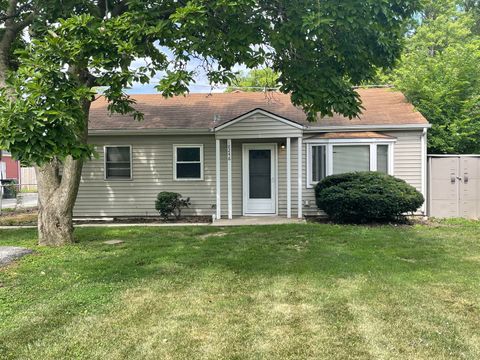
$149,900
3
bds
|
1
ba
|
0
sqft
|
built
1930
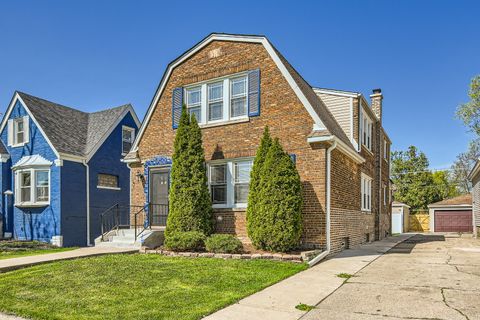
16112 Cicero Ave, Oak Forest, IL 60452
$476
Cash flow
16.6%
Cash-on-Cash Return
9.5%
Cap rate
1.5%
Rent to Value Ratio
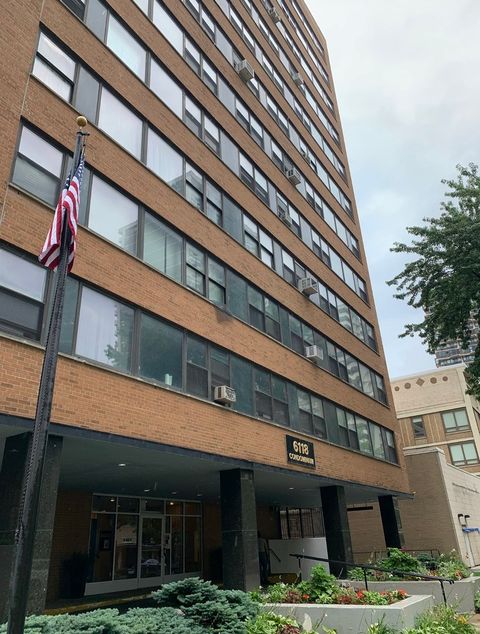
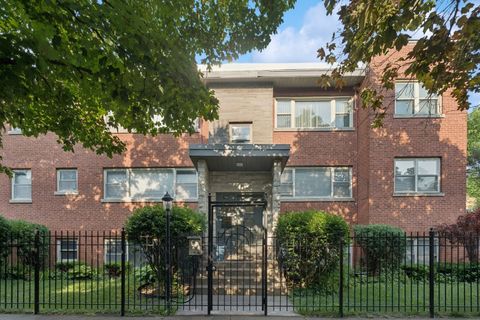
Active
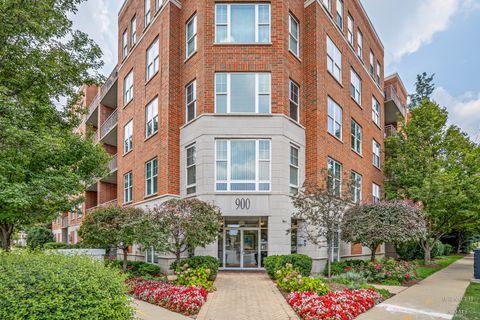
$200,000
2
bds
|
1
ba
|
900
sqft
|
built
1957
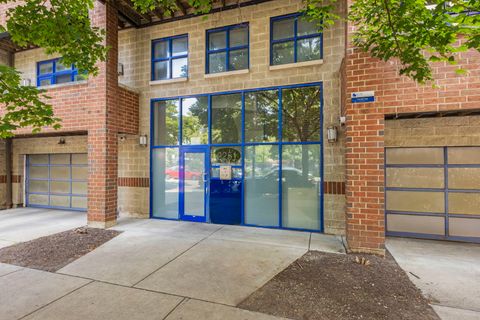
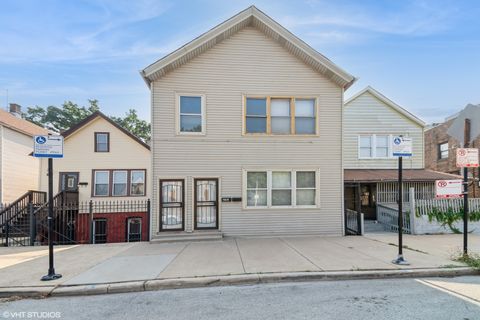
6118 N Sheridan Rd, Chicago, IL 60660
$343
Cash flow
8.9%
Cash-on-Cash Return
7.7%
Cap rate
1.1%
Rent to Value Ratio
4,738 out of 5,507 properties for sale in Cook County
Limited Results Shown
Create a free account, or log in to reveal all property listings and enjoy the complete experience.
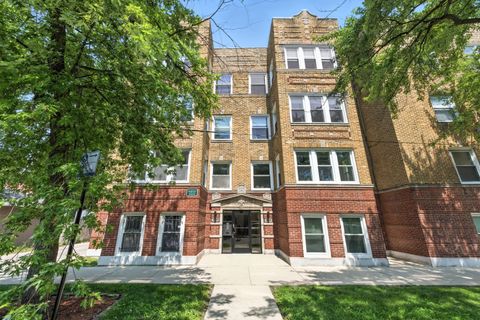
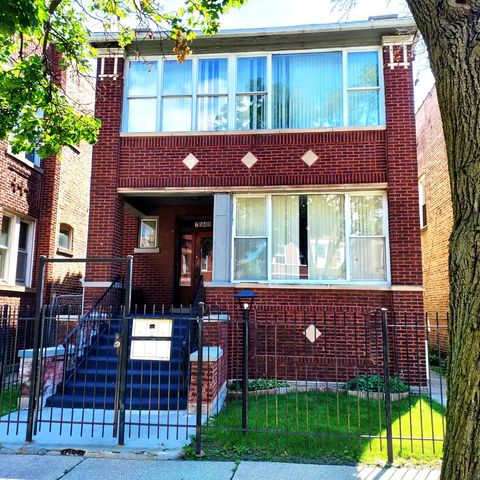
Active
$229,900
2
bds
|
2
ba
|
1,103
sqft
|
built
1900
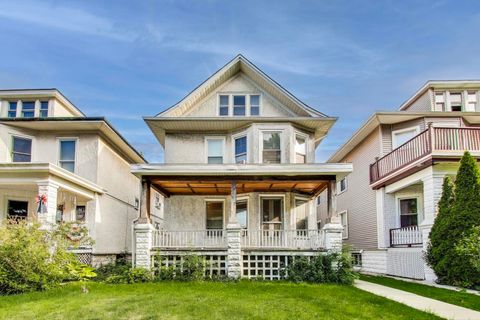
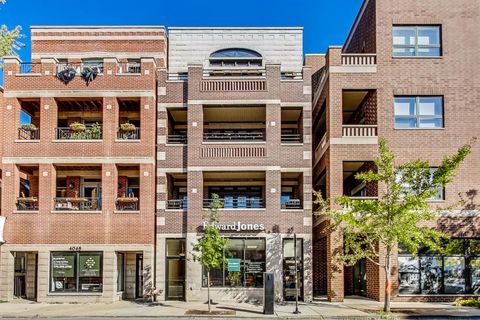
3708 W Ainslie St, Chicago, IL 60625
$-230
Cash flow
-5.2%
Cash-on-Cash Return
4.5%
Cap rate
1.0%
Rent to Value Ratio
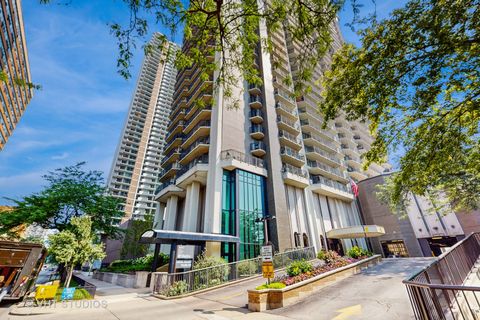
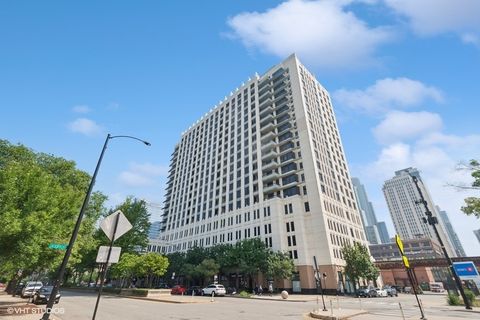
Active
$325,000
2
bds
|
2
ba
|
1,433
sqft
|
built
1969
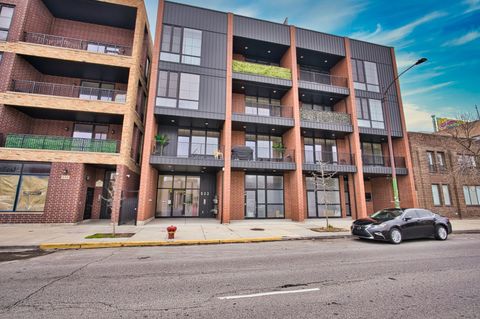
6007 N Sheridan Rd, Chicago, IL 60660
$-840
Cash flow
-13.5%
Cash-on-Cash Return
2.6%
Cap rate
0.9%
Rent to Value Ratio
Active
$350,000
1
bds
|
1
ba
|
765
sqft
|
built
1998
2251 W Saint Paul Ave, Chicago, IL 60647
$-928
Cash flow
-13.8%
Cash-on-Cash Return
2.5%
Cap rate
0.7%
Rent to Value Ratio
Active
$450,000
6
bds
|
2
ba
|
0
sqft
|
built
1914
5037 W Sunnyside Ave, Chicago, IL 60630
$-1,109
Cash flow
-12.9%
Cash-on-Cash Return
2.7%
Cap rate
0.6%
Rent to Value Ratio
Active
$399,900
3
bds
|
3
ba
|
2,200
sqft
|
built
1905
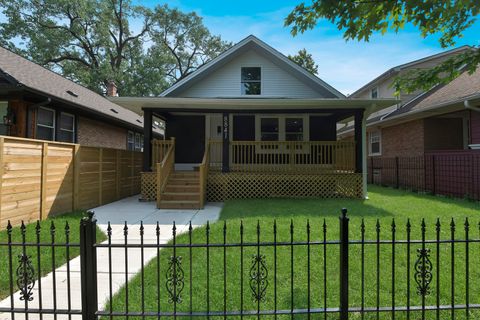
8841 S Elizabeth St, Chicago, IL 60620
$-861
Cash flow
-11.2%
Cash-on-Cash Return
3.1%
Cap rate
0.4%
Rent to Value Ratio
Active
$550,000
3
bds
|
2
ba
|
1,450
sqft
|
built
1903
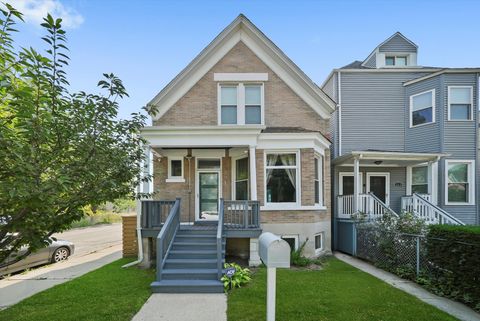
2917 N Richmond St, Chicago, IL 60618
$-871
Cash flow
-8.3%
Cash-on-Cash Return
3.8%
Cap rate
0.6%
Rent to Value Ratio
Active
$384,900
3
bds
|
2
ba
|
1,095
sqft
|
built
1972
7513 Dorothy Ln, Tinley Park, IL 60477
$-437
Cash flow
-5.9%
Cash-on-Cash Return
4.3%
Cap rate
0.7%
Rent to Value Ratio
Active
$220,000
2
bds
|
1
ba
|
1,000
sqft
|
built
1969
7957 163rd Pl, Tinley Park, IL 60477
$-324
Cash flow
-7.7%
Cash-on-Cash Return
3.9%
Cap rate
0.8%
Rent to Value Ratio
Active
$144,999
3
bds
|
1
ba
|
1,148
sqft
|
built
1957
1341 Gordon Ave, Calumet City, IL 60409
$14
Cash flow
0.5%
Cash-on-Cash Return
5.8%
Cap rate
1.4%
Rent to Value Ratio
Active
$799,999
4
bds
|
4
ba
|
3,937
sqft
|
built
1953
4600 Greenwood St, Skokie, IL 60076
$-1,658
Cash flow
-10.8%
Cash-on-Cash Return
3.2%
Cap rate
0.6%
Rent to Value Ratio
Active
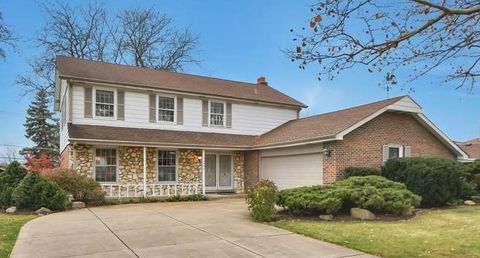
$429,900
4
bds
|
3
ba
|
2,220
sqft
|
built
1974
14508 Maycliff Dr, Orland Park, IL 60462
$-308
Cash flow
-3.7%
Cash-on-Cash Return
4.8%
Cap rate
0.8%
Rent to Value Ratio
Active
$329,900
2
bds
|
3
ba
|
1,753
sqft
|
built
1994
11905 Cormoy Ln, Orland Park, IL 60467
$-166
Cash flow
-2.6%
Cash-on-Cash Return
5.1%
Cap rate
0.9%
Rent to Value Ratio
Active
$435,000
3
bds
|
2
ba
|
0
sqft
|
built
1969
7615 N Oriole Ave, Niles, IL 60714
$-85
Cash flow
-1.0%
Cash-on-Cash Return
5.4%
Cap rate
0.7%
Rent to Value Ratio
Active
$650,000
3
bds
|
3
ba
|
1,650
sqft
|
built
1966
8426 W Betty Ter, Niles, IL 60714
$-1,337
Cash flow
-10.7%
Cash-on-Cash Return
3.2%
Cap rate
0.6%
Rent to Value Ratio
Active
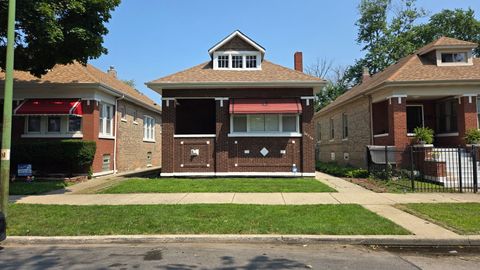
$315,000
3
bds
|
2
ba
|
1,130
sqft
|
built
1918
10215 S Emerald Ave, Chicago, IL 60628
$-88
Cash flow
-1.5%
Cash-on-Cash Return
5.3%
Cap rate
0.7%
Rent to Value Ratio
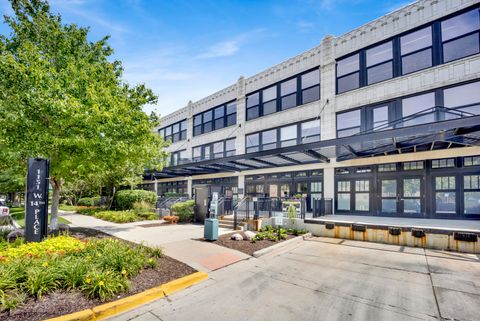
Active
$274,999
1
bds
|
1
ba
|
817
sqft
|
built
1920
1151 W 14th Pl, Chicago, IL 60608
$-503
Cash flow
-9.5%
Cash-on-Cash Return
3.5%
Cap rate
0.8%
Rent to Value Ratio
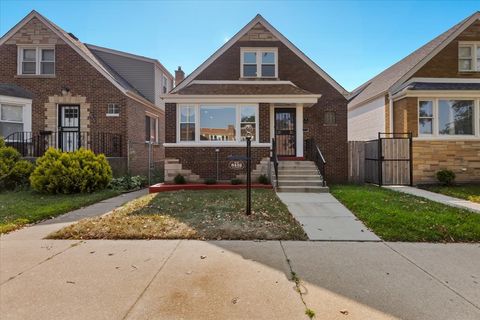
Active
$280,000
5
bds
|
2
ba
|
0
sqft
|
built
1918
7549 S Langley Ave, Chicago, IL 60619
$-364
Cash flow
-6.8%
Cash-on-Cash Return
4.1%
Cap rate
0.6%
Rent to Value Ratio
Active
$327,999
3
bds
|
3
ba
|
1,876
sqft
|
built
1950
8432 S Yates Blvd, Chicago, IL 60617
$-243
Cash flow
-3.9%
Cash-on-Cash Return
4.8%
Cap rate
0.6%
Rent to Value Ratio
Active
$249,900
1
bds
|
1
ba
|
956
sqft
|
built
1913
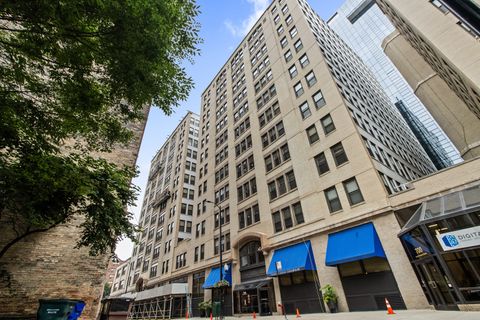
740 S Federal St, Chicago, IL 60605
$-750
Cash flow
-15.7%
Cash-on-Cash Return
2.1%
Cap rate
0.9%
Rent to Value Ratio
Active
$325,000
2
bds
|
1
ba
|
1,464
sqft
|
built
1913
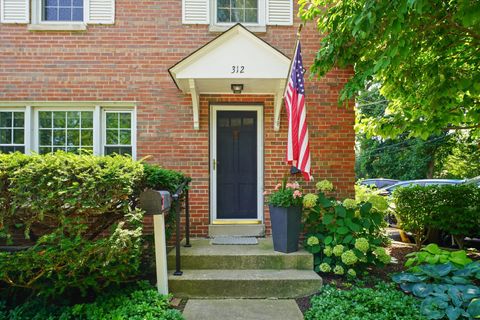
312 Jackson Ave, Glencoe, IL 60022
$-523
Cash flow
-8.4%
Cash-on-Cash Return
3.7%
Cap rate
0.8%
Rent to Value Ratio
Active
$608,000
4
bds
|
3
ba
|
3,135
sqft
|
built
1981
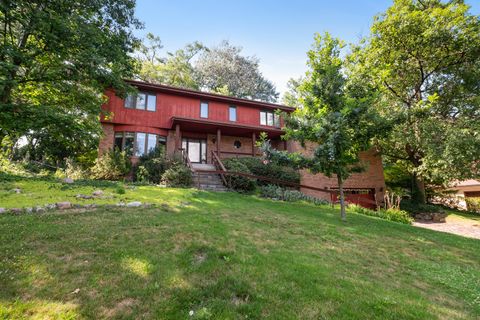
9940 S Wood Ln, Palos Hills, IL 60465
$-1,174
Cash flow
-10.1%
Cash-on-Cash Return
3.4%
Cap rate
0.6%
Rent to Value Ratio
Active
$420,000
5
bds
|
2
ba
|
1,906
sqft
|
built
1981
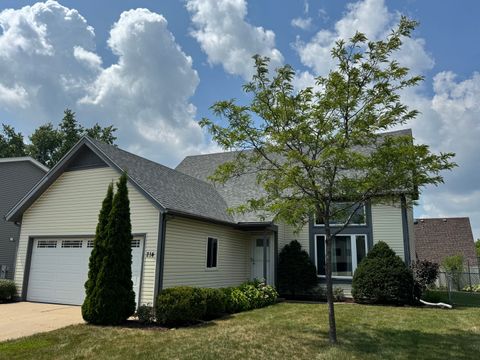
214 N Park Blvd, Streamwood, IL 60107
$-698
Cash flow
-8.7%
Cash-on-Cash Return
3.7%
Cap rate
0.7%
Rent to Value Ratio
Active
$799,000
3
bds
|
3
ba
|
2,400
sqft
|
built
2019
522 N Western Ave, Chicago, IL 60612
$-1,251
Cash flow
-8.2%
Cash-on-Cash Return
3.8%
Cap rate
0.7%
Rent to Value Ratio
Active
$639,000
3
bds
|
2
ba
|
1,502
sqft
|
built
2008
4043 N Damen Ave, Chicago, IL 60618
$-1,347
Cash flow
-11.0%
Cash-on-Cash Return
3.1%
Cap rate
0.6%
Rent to Value Ratio
Active
$299,850
4
bds
|
3
ba
|
3,000
sqft
|
built
1939
10940 S Wallace St, Chicago, IL 60628
$-33
Cash flow
-0.6%
Cash-on-Cash Return
5.5%
Cap rate
0.8%
Rent to Value Ratio
Active
$199,000
8
bds
|
3
ba
|
0
sqft
|
built
1878
9039 S Brandon Ave, Chicago, IL 60617
$300
Cash flow
7.9%
Cash-on-Cash Return
7.5%
Cap rate
0.9%
Rent to Value Ratio
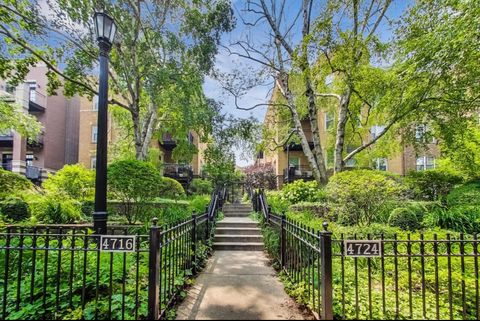
Active
$295,000
2
bds
|
1
ba
|
0
sqft
|
built
1924
4720 N Beacon St, Chicago, IL 60640
$-345
Cash flow
-6.1%
Cash-on-Cash Return
4.3%
Cap rate
0.7%
Rent to Value Ratio
Active
$369,000
4
bds
|
2
ba
|
1,653
sqft
|
built
1968
7211 Jonquil Ter, Hanover Park, IL 60133
$-682
Cash flow
-9.6%
Cash-on-Cash Return
3.5%
Cap rate
0.7%
Rent to Value Ratio
Active
$399,900
4
bds
|
2
ba
|
1,409
sqft
|
built
1958
217 Edgeware Rd, Elk Grove Village, IL 60007
$-247
Cash flow
-3.2%
Cash-on-Cash Return
4.9%
Cap rate
0.7%
Rent to Value Ratio
Active
$179,900
1
bds
|
1
ba
|
945
sqft
|
built
1970
1501 E Churchill Dr, Palatine, IL 60074
$-61
Cash flow
-1.8%
Cash-on-Cash Return
5.3%
Cap rate
1.1%
Rent to Value Ratio
Active
$175,000
2
bds
|
1
ba
|
864
sqft
|
built
1954
18246 Martin Ave, Homewood, IL 60430
$54
Cash flow
1.6%
Cash-on-Cash Return
6.0%
Cap rate
1.1%
Rent to Value Ratio
Active
$749,900
4
bds
|
3
ba
|
3,000
sqft
|
built
1987
64 Silo Ridge Rd S, Orland Park, IL 60467
$-1,341
Cash flow
-9.3%
Cash-on-Cash Return
3.5%
Cap rate
0.7%
Rent to Value Ratio
Active
$445,000
3
bds
|
1
ba
|
1,173
sqft
|
built
1953
3900 Gilbert Ave, Western Springs, IL 60558
$-448
Cash flow
-5.3%
Cash-on-Cash Return
4.5%
Cap rate
0.7%
Rent to Value Ratio
Active
$438,000
3
bds
|
2
ba
|
1,700
sqft
|
built
2007
900 Lee St, Des Plaines, IL 60016
$-1,605
Cash flow
-19.1%
Cash-on-Cash Return
1.3%
Cap rate
0.5%
Rent to Value Ratio
Active
$549,900
4
bds
|
4
ba
|
1,654
sqft
|
built
1962
7618 Beckwith Rd, Morton Grove, IL 60053
$-992
Cash flow
-9.4%
Cash-on-Cash Return
3.5%
Cap rate
0.6%
Rent to Value Ratio
Active
$239,500
3
bds
|
2
ba
|
0
sqft
|
built
1970
7501 N Damen Ave, Chicago, IL 60645
$-241
Cash flow
-5.3%
Cash-on-Cash Return
4.5%
Cap rate
0.8%
Rent to Value Ratio
Active
$350,000
2
bds
|
2
ba
|
1,068
sqft
|
built
2007
1255 S State St, Chicago, IL 60605
$-967
Cash flow
-14.4%
Cash-on-Cash Return
2.4%
Cap rate
0.9%
Rent to Value Ratio
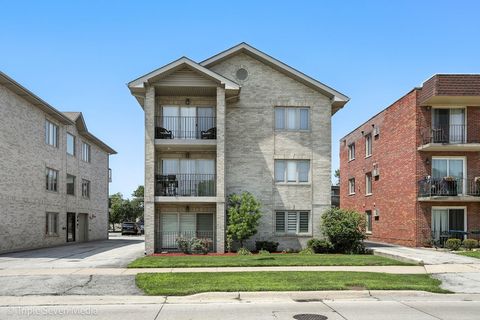
Active
$209,400
2
bds
|
2
ba
|
1,100
sqft
|
built
2005
10620 Central Ave, Chicago Ridge, IL 60415
$-155
Cash flow
-3.9%
Cash-on-Cash Return
4.8%
Cap rate
0.9%
Rent to Value Ratio