Cook County Investment Properties for Sale
Browse homes for sale and investment properties in Cook County. Refine your search by price, property type, or more.
Best cash flowing properties in Cook County
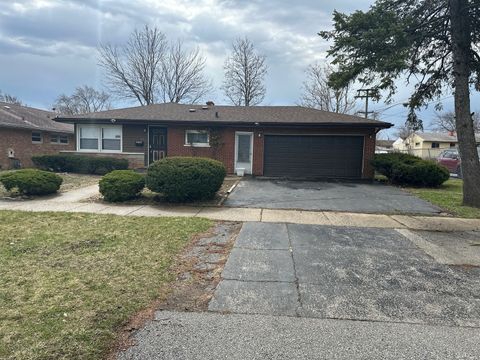
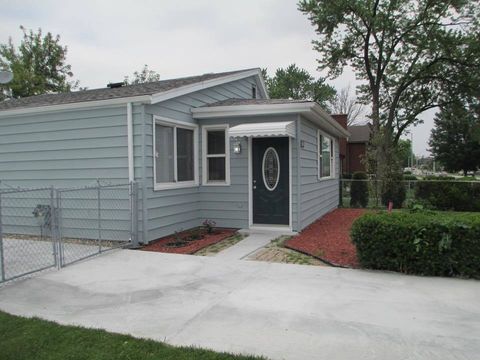
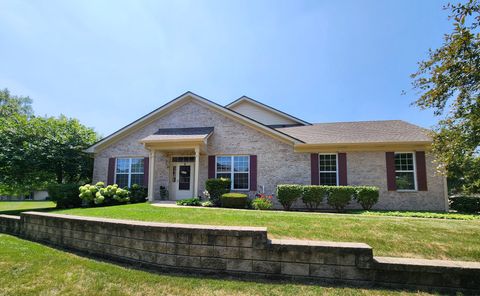
Active
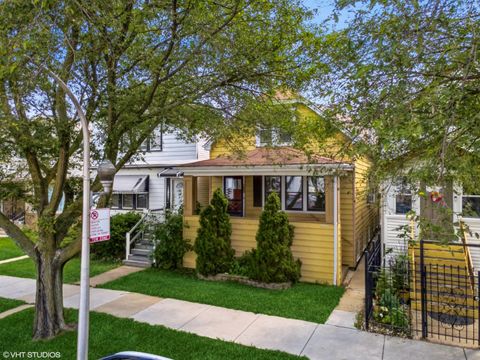
$159,500
3
bds
|
1
ba
|
1,188
sqft
|
built
1958
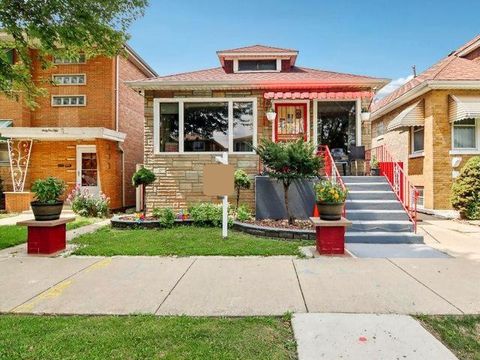
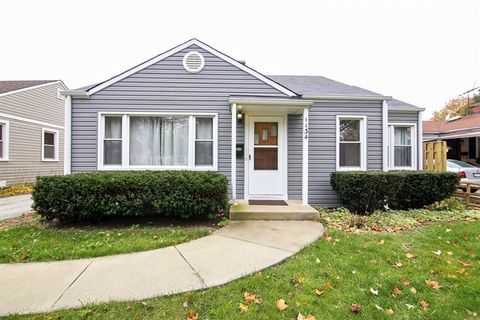
1945 W 163rd St, Markham, IL 60428
$753
Cash flow
24.6%
Cash-on-Cash Return
11.3%
Cap rate
1.6%
Rent to Value Ratio
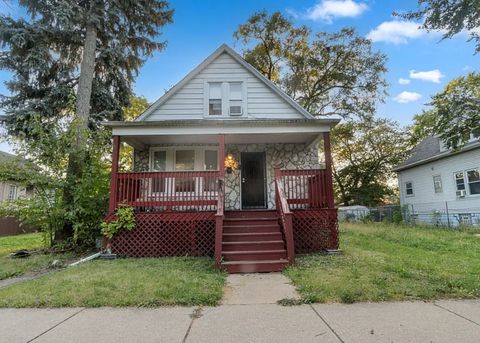
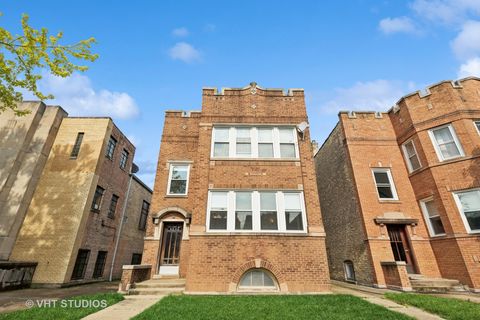
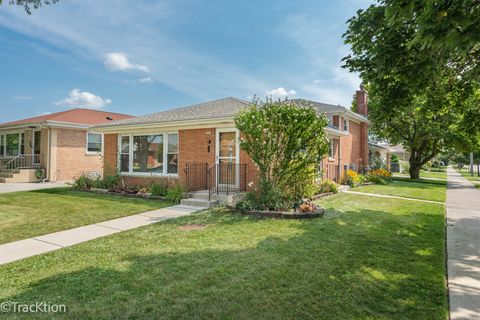
Active
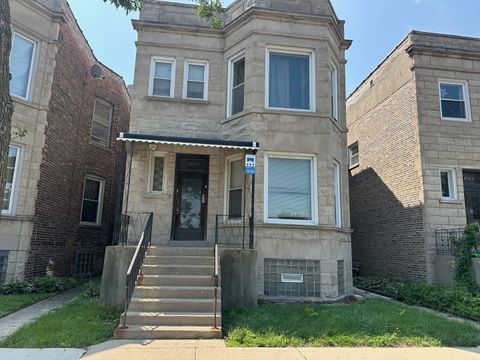
$112,000
4
bds
|
1
ba
|
1,405
sqft
|
built
1916
10530 S La Salle St, Chicago, IL 60628
$615
Cash flow
28.6%
Cash-on-Cash Return
12.3%
Cap rate
1.6%
Rent to Value Ratio
4,738 out of 5,507 properties for sale in Cook County
Limited Results Shown
Create a free account, or log in to reveal all property listings and enjoy the complete experience.
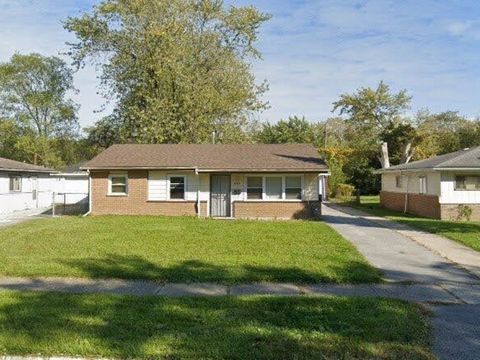
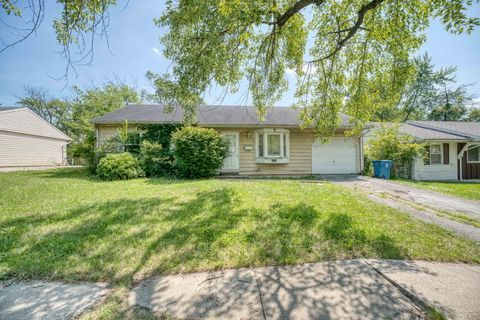
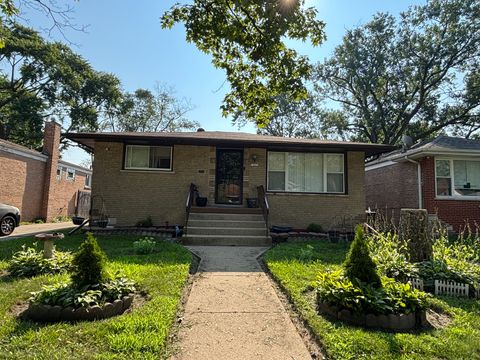
Active
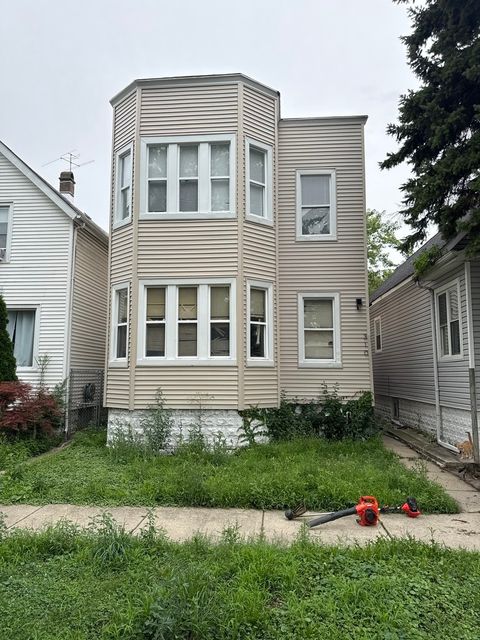
$144,999
3
bds
|
1
ba
|
1,147
sqft
|
built
1957
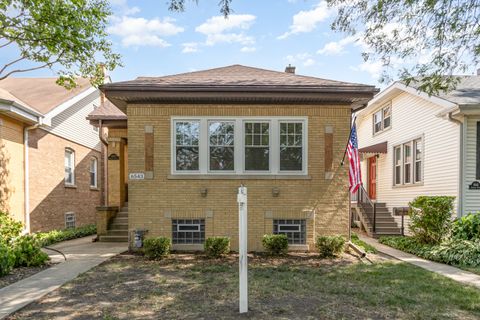
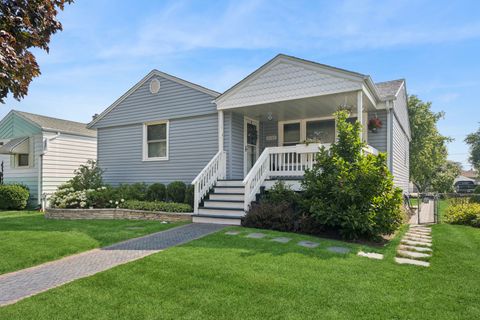
1375 Forest Pl, Calumet City, IL 60409
$70
Cash flow
2.5%
Cash-on-Cash Return
6.3%
Cap rate
1.4%
Rent to Value Ratio
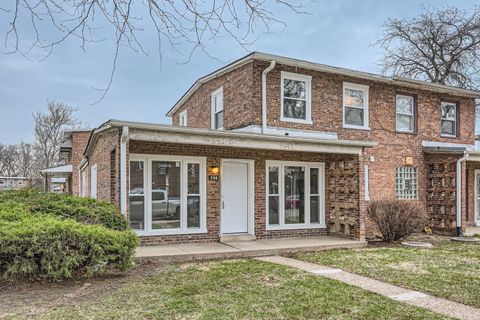
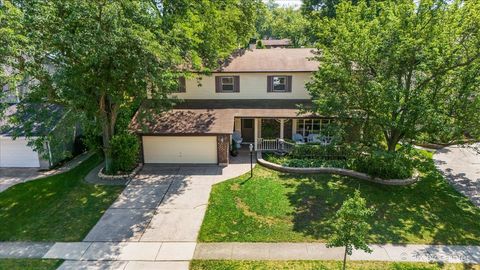
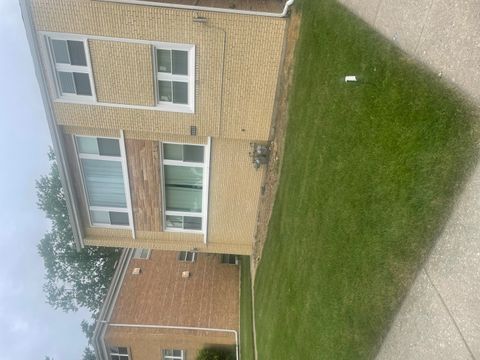
Active
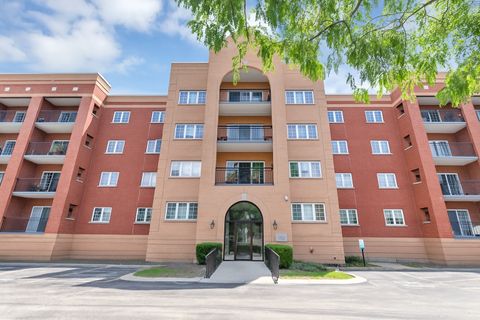
$195,000
3
bds
|
1
ba
|
1,144
sqft
|
built
1942
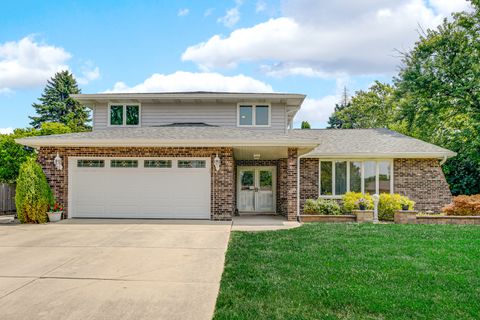
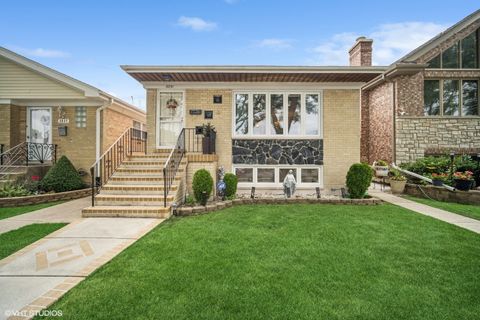
236 E 92nd St, Chicago, IL 60619
$392
Cash flow
10.5%
Cash-on-Cash Return
8.1%
Cap rate
1.0%
Rent to Value Ratio
Active
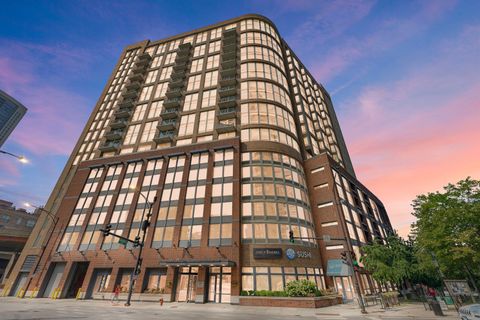
$1,800,000
4
bds
|
5
ba
|
4,924
sqft
|
built
2002
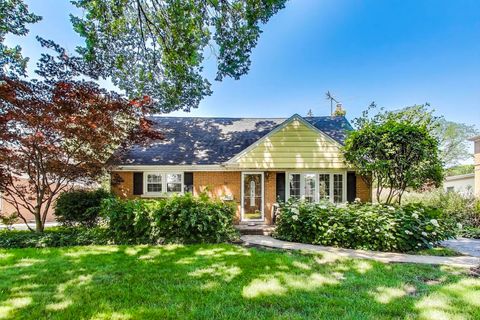
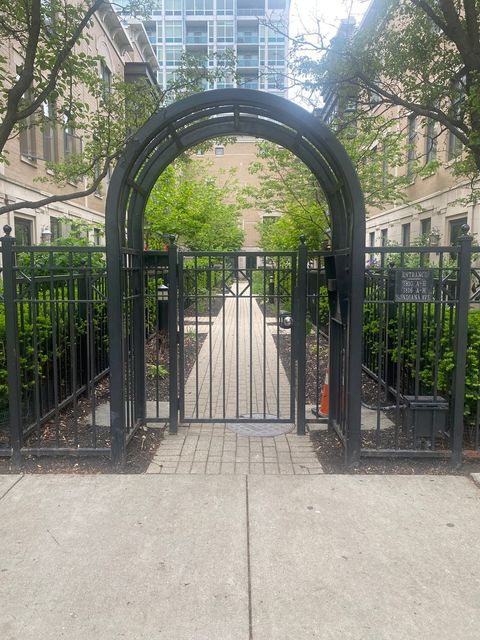
600 N Kingsbury St, Chicago, IL 60654
$-12,387
Cash flow
-35.9%
Cash-on-Cash Return
-2.6%
Cap rate
0.2%
Rent to Value Ratio
Active
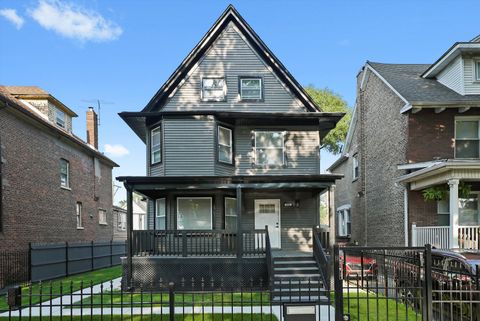
$479,999
6
bds
|
4
ba
|
2,500
sqft
|
built
1898
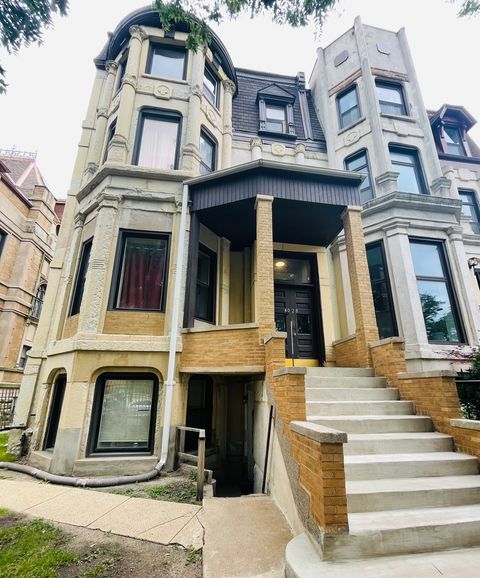
28 N Latrobe Ave, Chicago, IL 60644
$-722
Cash flow
-7.8%
Cash-on-Cash Return
3.9%
Cap rate
0.5%
Rent to Value Ratio
Active
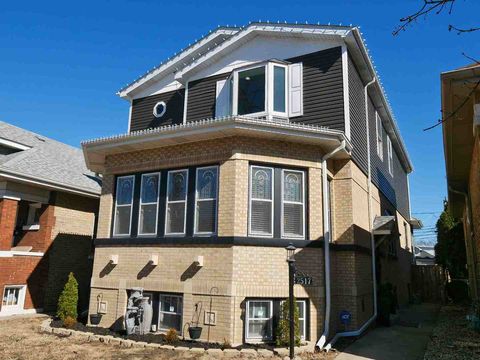
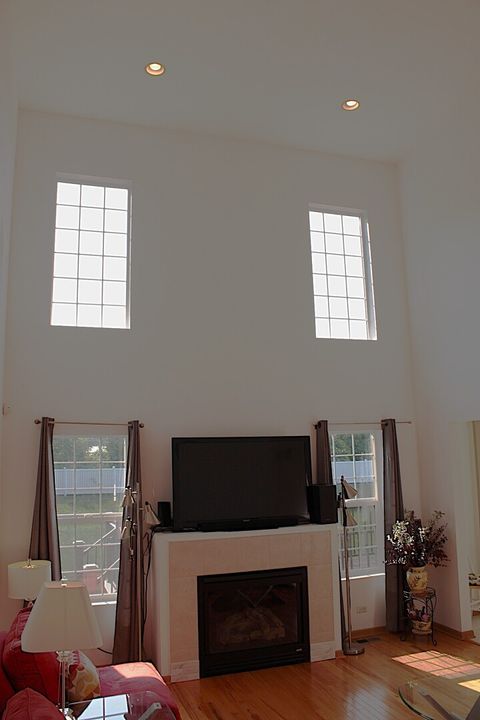
$460,000
4
bds
|
3
ba
|
2,381
sqft
|
built
1930
2517 Clinton Ave, Berwyn, IL 60402
$-855
Cash flow
-9.7%
Cash-on-Cash Return
3.4%
Cap rate
0.8%
Rent to Value Ratio
Active
$299,999
3
bds
|
3
ba
|
1,750
sqft
|
built
2001
20002 Park Ave, Lynwood, IL 60411
$-84
Cash flow
-1.5%
Cash-on-Cash Return
5.3%
Cap rate
0.8%
Rent to Value Ratio
Active
$160,000
2
bds
|
2
ba
|
982
sqft
|
built
1969
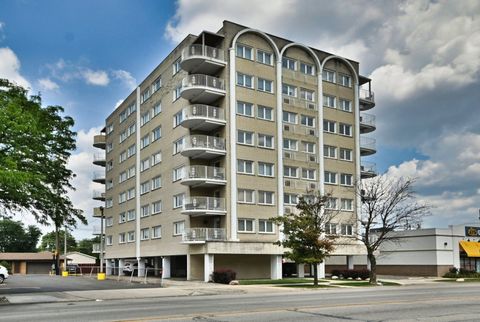
9720 S Pulaski Rd, Oak Lawn, IL 60453
$-308
Cash flow
-10.0%
Cash-on-Cash Return
3.4%
Cap rate
1.0%
Rent to Value Ratio
Active
$555,800
4
bds
|
3
ba
|
1,800
sqft
|
built
1898
3335 Clinton Ave, Berwyn, IL 60402
$-1,135
Cash flow
-10.7%
Cash-on-Cash Return
3.2%
Cap rate
0.6%
Rent to Value Ratio
Active
$399,900
3
bds
|
3
ba
|
1,664
sqft
|
built
1903
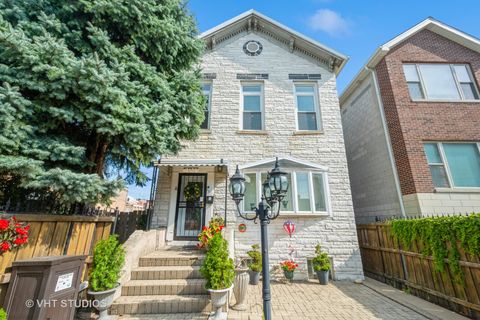
3918 N Newland Ave, Chicago, IL 60634
$14
Cash flow
0.2%
Cash-on-Cash Return
5.7%
Cap rate
0.8%
Rent to Value Ratio
Active
$439,000
2
bds
|
2
ba
|
0
sqft
|
built
1904
1801 W Thomas St, Chicago, IL 60622
$-697
Cash flow
-8.3%
Cash-on-Cash Return
3.8%
Cap rate
0.7%
Rent to Value Ratio
Active
$289,900
2
bds
|
1
ba
|
1,000
sqft
|
built
1916
6148 S Tripp Ave, Chicago, IL 60629
$-199
Cash flow
-3.6%
Cash-on-Cash Return
4.9%
Cap rate
0.7%
Rent to Value Ratio
Active
$449,900
3
bds
|
3
ba
|
0
sqft
|
built
1925
6543 N Oshkosh Ave, Chicago, IL 60631
$-487
Cash flow
-5.6%
Cash-on-Cash Return
4.4%
Cap rate
0.7%
Rent to Value Ratio
Active
$482,000
3
bds
|
3
ba
|
2,492
sqft
|
built
1979
14125 Trenton Ave, Orland Park, IL 60462
$-554
Cash flow
-6.0%
Cash-on-Cash Return
4.3%
Cap rate
0.7%
Rent to Value Ratio
Active
$399,000
4
bds
|
2
ba
|
2,752
sqft
|
built
1953
210 N Russel St, Mount Prospect, IL 60056
$-536
Cash flow
-7.0%
Cash-on-Cash Return
4.1%
Cap rate
0.7%
Rent to Value Ratio
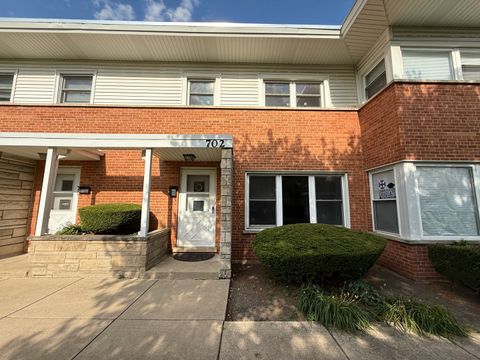
Active
$320,000
2
bds
|
3
ba
|
1,132
sqft
|
built
1958
702 E Shabonee Trl, Mount Prospect, IL 60056
$-547
Cash flow
-8.9%
Cash-on-Cash Return
3.6%
Cap rate
0.8%
Rent to Value Ratio
Active
$489,900
3
bds
|
2
ba
|
1,503
sqft
|
built
1958
2528 William Ave, Glenview, IL 60025
$12
Cash flow
0.1%
Cash-on-Cash Return
5.7%
Cap rate
0.7%
Rent to Value Ratio
Active
$825,000
3
bds
|
2
ba
|
1,751
sqft
|
built
1957
2017 Bosworth Ln, Northfield, IL 60093
$-1,771
Cash flow
-11.2%
Cash-on-Cash Return
3.1%
Cap rate
0.5%
Rent to Value Ratio
Active
$299,900
2
bds
|
1
ba
|
945
sqft
|
built
1954
4536 Oak Park Ave, Forest View, IL 60402
$-540
Cash flow
-9.4%
Cash-on-Cash Return
3.5%
Cap rate
0.7%
Rent to Value Ratio
Active
$100,000
3
bds
|
1
ba
|
950
sqft
|
built
1971
2912 223rd Pl, Sauk Village, IL 60411
$405
Cash flow
21.1%
Cash-on-Cash Return
10.5%
Cap rate
1.6%
Rent to Value Ratio
Active
$675,000
7
bds
|
3
ba
|
0
sqft
|
built
1919
6208 N Artesian Ave, Chicago, IL 60659
$-2,036
Cash flow
-15.7%
Cash-on-Cash Return
2.1%
Cap rate
0.4%
Rent to Value Ratio
Active
$515,000
5
bds
|
3
ba
|
2,552
sqft
|
built
1969
159 University Dr, Buffalo Grove, IL 60089
$-666
Cash flow
-6.7%
Cash-on-Cash Return
4.1%
Cap rate
0.7%
Rent to Value Ratio
Active
$283,000
3
bds
|
2
ba
|
1,063
sqft
|
built
1947
9814 Austin Ave, Oak Lawn, IL 60453
$-381
Cash flow
-7.0%
Cash-on-Cash Return
4.1%
Cap rate
0.8%
Rent to Value Ratio
Active
$279,000
2
bds
|
1
ba
|
906
sqft
|
built
1950
1134 Webster Ln, Des Plaines, IL 60016
$-238
Cash flow
-4.5%
Cash-on-Cash Return
4.7%
Cap rate
0.8%
Rent to Value Ratio
Active
$295,000
2
bds
|
2
ba
|
1,126
sqft
|
built
1952
4109 Home Ave, Stickney, IL 60402
$-185
Cash flow
-3.3%
Cash-on-Cash Return
4.9%
Cap rate
0.9%
Rent to Value Ratio
Active
$469,000
3
bds
|
2
ba
|
1,296
sqft
|
built
1979
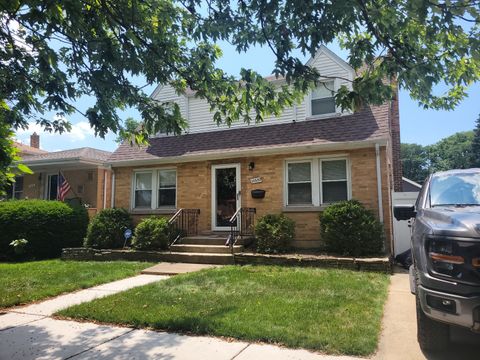
3231 N Osage Ave, Chicago, IL 60634
$-159
Cash flow
-1.8%
Cash-on-Cash Return
5.3%
Cap rate
0.7%
Rent to Value Ratio
Active
$1,145,000
4
bds
|
4
ba
|
3,100
sqft
|
built
2002
1816 S Indiana Ave, Chicago, IL 60616
$-2,753
Cash flow
-12.5%
Cash-on-Cash Return
2.8%
Cap rate
0.5%
Rent to Value Ratio
Active
$580,000
4
bds
|
2
ba
|
0
sqft
|
built
1904
2418 W Arthington St, Chicago, IL 60612
$-1,710
Cash flow
-15.4%
Cash-on-Cash Return
2.1%
Cap rate
0.4%
Rent to Value Ratio
Active
$975,000
11
bds
|
7
ba
|
0
sqft
|
built
1888
4028 S King Dr, Chicago, IL 60653
$-3,867
Cash flow
-20.7%
Cash-on-Cash Return
0.9%
Cap rate
0.2%
Rent to Value Ratio
Active
$390,000
3
bds
|
2
ba
|
1,500
sqft
|
built
1941
10632 S Hamlin Ave, Chicago, IL 60655
$-279
Cash flow
-3.7%
Cash-on-Cash Return
4.8%
Cap rate
0.7%
Rent to Value Ratio
Active
$239,900
2
bds
|
2
ba
|
1,500
sqft
|
built
1970
7410 W North Ave, Elmwood Park, IL 60707
$-699
Cash flow
-15.2%
Cash-on-Cash Return
2.2%
Cap rate
0.8%
Rent to Value Ratio
Active
$399,999
2
bds
|
2
ba
|
1,582
sqft
|
built
2007
982 Oak Ridge Blvd, Elgin, IL 60120
$-791
Cash flow
-10.3%
Cash-on-Cash Return
3.3%
Cap rate
0.7%
Rent to Value Ratio
Active
$449,900
4
bds
|
2
ba
|
1,511
sqft
|
built
1961
8605 N Merrill St, Niles, IL 60714
$-571
Cash flow
-6.6%
Cash-on-Cash Return
4.2%
Cap rate
0.7%
Rent to Value Ratio
Active
$229,900
2
bds
|
2
ba
|
1,803
sqft
|
built
1959
14221 Ingleside Ave, Dolton, IL 60419
$-366
Cash flow
-8.3%
Cash-on-Cash Return
3.8%
Cap rate
0.9%
Rent to Value Ratio
Active
$685,000
6
bds
|
3
ba
|
0
sqft
|
built
1960
3440 Main St, Skokie, IL 60076
$-2,517
Cash flow
-19.2%
Cash-on-Cash Return
1.3%
Cap rate
0.4%
Rent to Value Ratio
Active
$375,000
4
bds
|
3
ba
|
1,821
sqft
|
built
1924
3527 N Kostner Ave, Chicago, IL 60641
$-269
Cash flow
-3.7%
Cash-on-Cash Return
4.8%
Cap rate
0.8%
Rent to Value Ratio
Active
$250,000
6
bds
|
2
ba
|
0
sqft
|
built
1906
4119 W Harrison St, Chicago, IL 60624
$56
Cash flow
1.2%
Cash-on-Cash Return
5.9%
Cap rate
0.8%
Rent to Value Ratio
Active
$174,999
4
bds
|
2
ba
|
0
sqft
|
built
1890
310 W 105th St, Chicago, IL 60628
$483
Cash flow
14.4%
Cash-on-Cash Return
9.0%
Cap rate
1.1%
Rent to Value Ratio
Active
$288,000
2
bds
|
2
ba
|
1,400
sqft
|
built
1998
59 S Hale St, Palatine, IL 60067
$-524
Cash flow
-9.5%
Cash-on-Cash Return
3.5%
Cap rate
0.9%
Rent to Value Ratio