Cook County Investment Properties for Sale
Browse homes for sale and investment properties in Cook County. Refine your search by price, property type, or more.
Best cash flowing properties in Cook County
Active
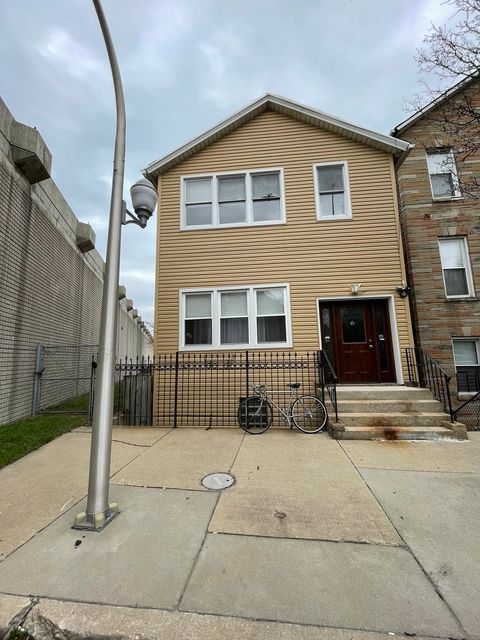
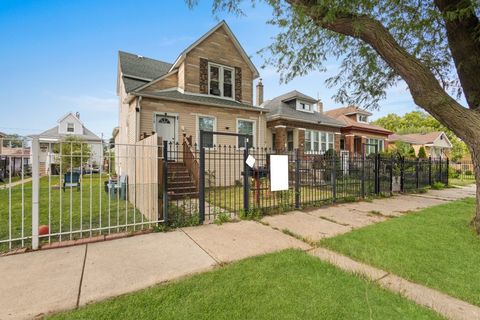
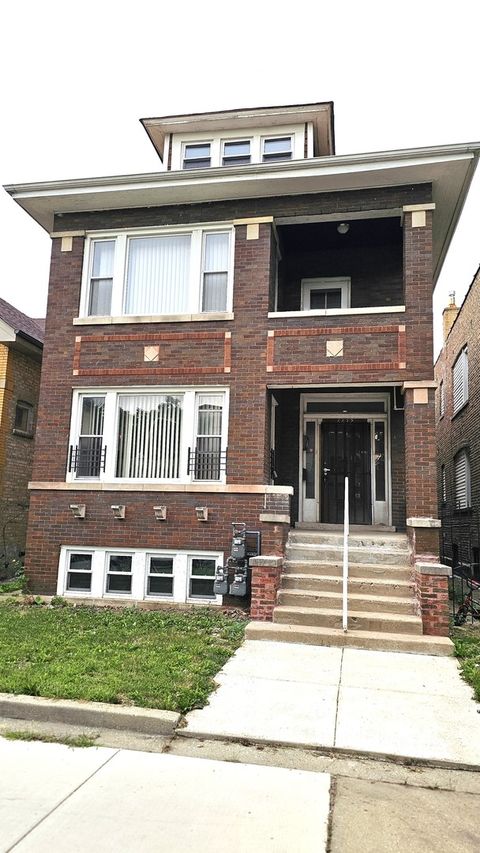
$42,500
3
bds
|
2
ba
|
1,150
sqft
|
built
1922
6836 S Crandon Ave, Chicago, IL 60649
$1,005
Cash flow
27.5%
Cash-on-Cash Return
28.4%
Cap rate
3.5%
Rent to Value Ratio
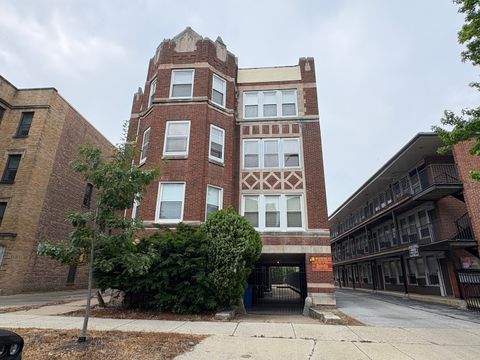
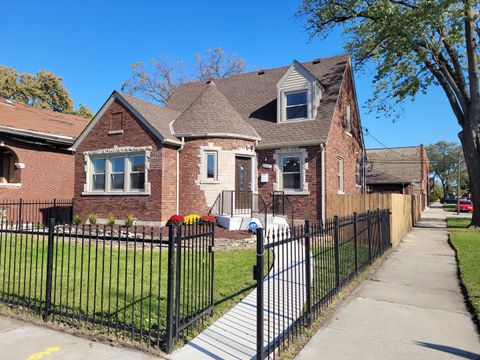
Active
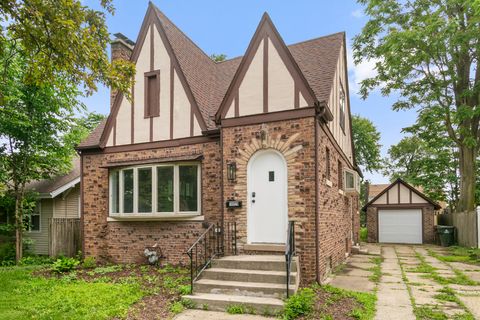
$80,000
8
bds
|
3
ba
|
0
sqft
|
built
1900
6835 S May St, Chicago, IL 60621
$966
Cash flow
63.0%
Cash-on-Cash Return
20.2%
Cap rate
2.5%
Rent to Value Ratio
4,904 out of 5,692 properties for sale in Cook County
Limited Results Shown
Create a free account, or log in to reveal all property listings and enjoy the complete experience.
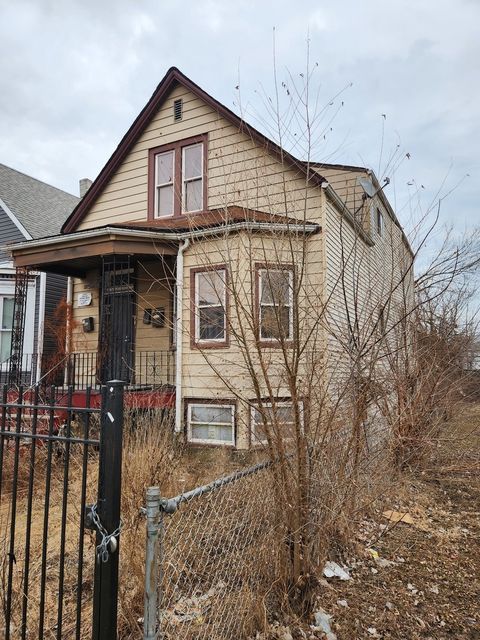
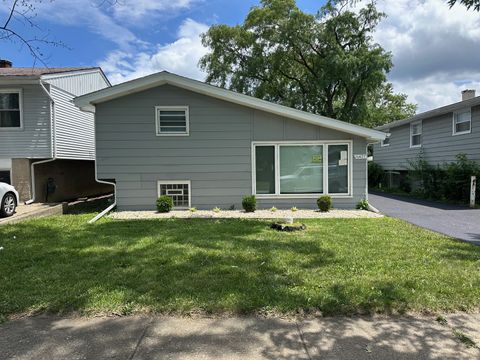
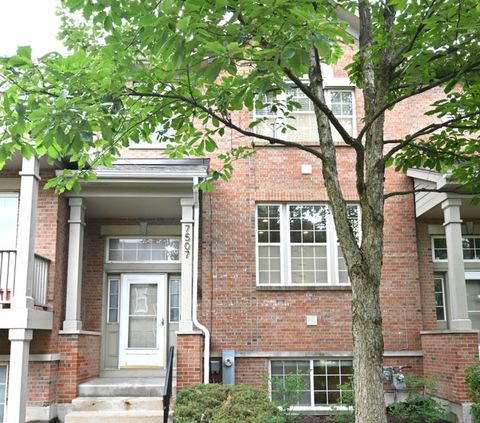
Active
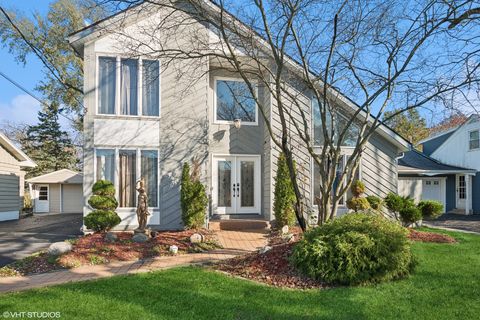
$314,900
8
bds
|
3
ba
|
0
sqft
|
built
1898
6948 S Eberhart Ave, Chicago, IL 60637
$-389
Cash flow
-6.4%
Cash-on-Cash Return
4.2%
Cap rate
0.6%
Rent to Value Ratio
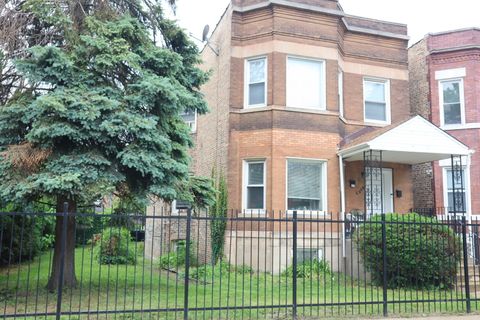
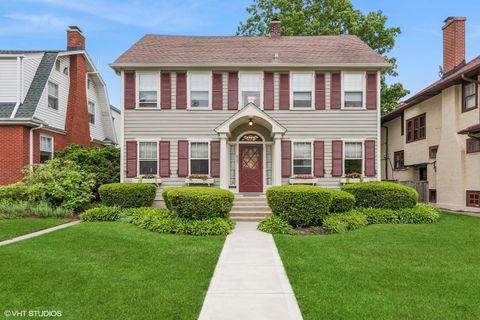
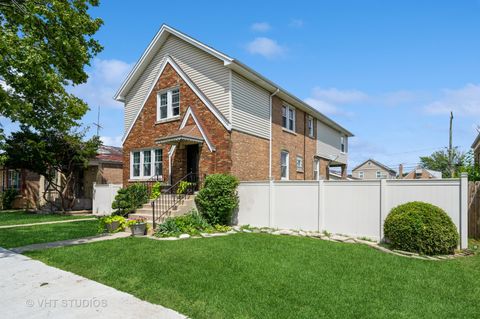
Active
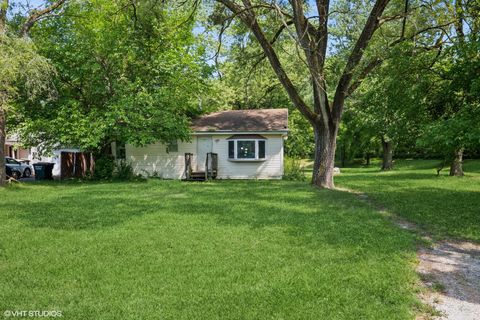
$340,000
7
bds
|
2
ba
|
0
sqft
|
built
1900
2849 S Kolin Ave, Chicago, IL 60623
$-839
Cash flow
-12.9%
Cash-on-Cash Return
2.7%
Cap rate
0.5%
Rent to Value Ratio
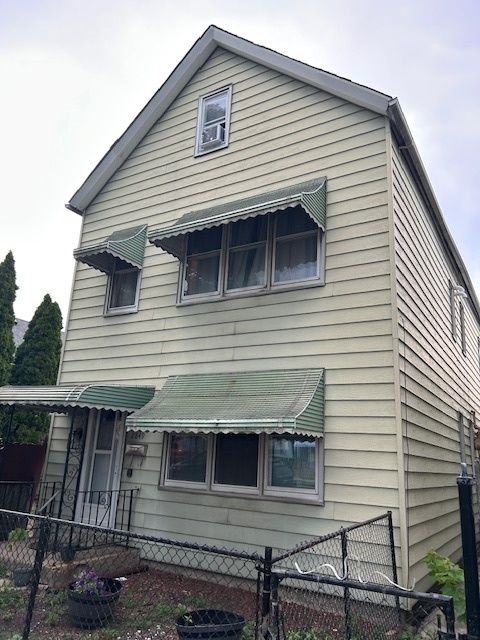
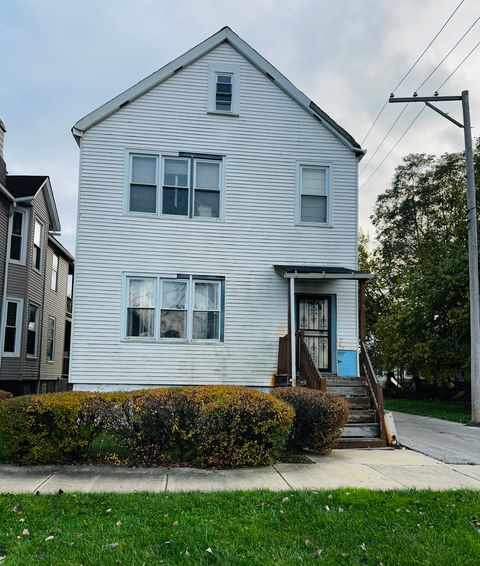
Active
$800,000
7
bds
|
5
ba
|
0
sqft
|
built
1885
2567 S Emerald Ave, Chicago, IL 60616
$-2,760
Cash flow
-18.0%
Cash-on-Cash Return
1.5%
Cap rate
0.3%
Rent to Value Ratio
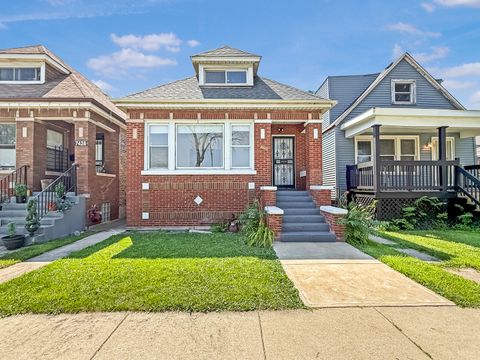
Active
$410,000
3
bds
|
4
ba
|
1,850
sqft
|
built
1940
8357 S Hermitage Ave, Chicago, IL 60620
$-13
Cash flow
-0.2%
Cash-on-Cash Return
5.6%
Cap rate
0.8%
Rent to Value Ratio
Active
$199,900
3
bds
|
1
ba
|
1,600
sqft
|
built
1961
16427 Wolcott Ave, Markham, IL 60428
$143
Cash flow
3.7%
Cash-on-Cash Return
6.5%
Cap rate
1.1%
Rent to Value Ratio
Active
$639,000
3
bds
|
2
ba
|
1,872
sqft
|
built
1922
820 N Oak Park Ave, Oak Park, IL 60302
$-1,262
Cash flow
-10.3%
Cash-on-Cash Return
3.3%
Cap rate
0.7%
Rent to Value Ratio
Active
$355,000
3
bds
|
2
ba
|
2,000
sqft
|
built
1919
1633 W Estes Ave, Chicago, IL 60626
$-610
Cash flow
-9.0%
Cash-on-Cash Return
3.6%
Cap rate
0.7%
Rent to Value Ratio
Active
$385,000
3
bds
|
2
ba
|
1,276
sqft
|
built
1888
3708 S Emerald Ave, Chicago, IL 60609
$-142
Cash flow
-1.9%
Cash-on-Cash Return
5.2%
Cap rate
0.8%
Rent to Value Ratio
Active
$330,000
3
bds
|
3
ba
|
0
sqft
|
built
1906
5743 S Michigan Ave, Chicago, IL 60637
$-570
Cash flow
-9.0%
Cash-on-Cash Return
3.6%
Cap rate
0.7%
Rent to Value Ratio
Active
$120,000
2
bds
|
2
ba
|
1,400
sqft
|
built
1918
498 Harrison Ave, Calumet City, IL 60409
$-1
Cash flow
0.0%
Cash-on-Cash Return
5.7%
Cap rate
1.3%
Rent to Value Ratio
Active
$700,000
7
bds
|
6
ba
|
0
sqft
|
built
1912
1526 E 65th Pl, Chicago, IL 60637
$-2,183
Cash flow
-16.3%
Cash-on-Cash Return
1.9%
Cap rate
0.3%
Rent to Value Ratio
Active
$429,000
3
bds
|
2
ba
|
1,560
sqft
|
built
1970
9719 S 81st Ave, Palos Hills, IL 60465
$-604
Cash flow
-7.3%
Cash-on-Cash Return
4.0%
Cap rate
0.7%
Rent to Value Ratio
Active
$710,000
4
bds
|
3
ba
|
3,367
sqft
|
built
1983
8714 W 123rd St, Palos Park, IL 60464
$-957
Cash flow
-7.0%
Cash-on-Cash Return
4.1%
Cap rate
0.7%
Rent to Value Ratio
Active
$729,000
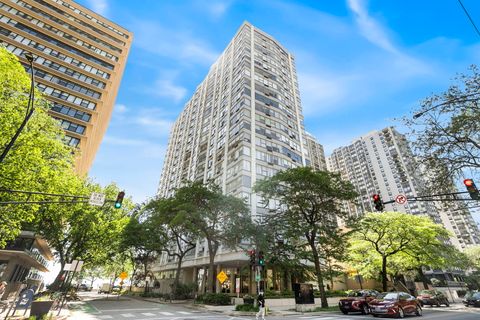
2
bds
|
2
ba
|
1,630
sqft
|
built
2008
65 E Monroe St, Chicago, IL 60603
$-2,719
Cash flow
-19.5%
Cash-on-Cash Return
1.2%
Cap rate
0.7%
Rent to Value Ratio
Active
$230,000
2
bds
|
2
ba
|
0
sqft
|
built
1968
5757 N Sheridan Rd, Chicago, IL 60660
$-1,174
Cash flow
-26.6%
Cash-on-Cash Return
-0.4%
Cap rate
0.9%
Rent to Value Ratio
Active
$475,000
2
bds
|
2
ba
|
1,900
sqft
|
built
2000
3209 N Drake Ave, Chicago, IL 60618
$-692
Cash flow
-7.6%
Cash-on-Cash Return
3.9%
Cap rate
0.7%
Rent to Value Ratio
Active
$310,000
4
bds
|
2
ba
|
1,880
sqft
|
built
1953
568 Riverview Dr, South Holland, IL 60473
$-132
Cash flow
-2.2%
Cash-on-Cash Return
5.2%
Cap rate
0.8%
Rent to Value Ratio
Active
$327,500
5
bds
|
3
ba
|
1,852
sqft
|
built
1865
3710 W 60th Pl, Chicago, IL 60629
$-204
Cash flow
-3.2%
Cash-on-Cash Return
4.9%
Cap rate
0.8%
Rent to Value Ratio
Active
$795,000
5
bds
|
4
ba
|
4,752
sqft
|
built
1959
8021 W Rascher Ave, Chicago, IL 60656
$-1,870
Cash flow
-12.3%
Cash-on-Cash Return
2.9%
Cap rate
0.5%
Rent to Value Ratio
Active
$389,900
2
bds
|
2
ba
|
1,342
sqft
|
built
1909
2545 S Dearborn St, Chicago, IL 60616
$-976
Cash flow
-13.1%
Cash-on-Cash Return
2.7%
Cap rate
0.7%
Rent to Value Ratio
Active
$102,000
3
bds
|
1
ba
|
924
sqft
|
built
1913
1532 Shields Ave, Chicago Heights, IL 60411
$400
Cash flow
20.5%
Cash-on-Cash Return
10.4%
Cap rate
1.6%
Rent to Value Ratio
Active
$635,000
3
bds
|
3
ba
|
0
sqft
|
built
2001
1540 N Claremont Ave, Chicago, IL 60622
$-1,639
Cash flow
-13.5%
Cash-on-Cash Return
2.6%
Cap rate
0.5%
Rent to Value Ratio
Active
$385,000
6
bds
|
3
ba
|
0
sqft
|
built
1920
6632 S Maplewood Ave, Chicago, IL 60629
$-777
Cash flow
-10.5%
Cash-on-Cash Return
3.3%
Cap rate
0.5%
Rent to Value Ratio
Active
$239,700
3
bds
|
2
ba
|
1,699
sqft
|
built
1928
16929 Wood St, Hazel Crest, IL 60429
$203
Cash flow
4.4%
Cash-on-Cash Return
6.7%
Cap rate
1.0%
Rent to Value Ratio
Active
$295,000
3
bds
|
3
ba
|
1,919
sqft
|
built
1983
315 Leverette St, Thornton, IL 60476
$69
Cash flow
1.2%
Cash-on-Cash Return
6.0%
Cap rate
1.1%
Rent to Value Ratio
Active
$180,000
3
bds
|
1
ba
|
1,166
sqft
|
built
1953
3636 172nd St, Lansing, IL 60438
$-265
Cash flow
-7.7%
Cash-on-Cash Return
3.9%
Cap rate
0.9%
Rent to Value Ratio

Active
$215,000
3
bds
|
2
ba
|
2,300
sqft
|
built
1925
6727 S Merrill Ave, Chicago, IL 60649
$-422
Cash flow
-10.2%
Cash-on-Cash Return
3.3%
Cap rate
1.0%
Rent to Value Ratio
Active
$195,000
2
bds
|
1
ba
|
1,000
sqft
|
built
1979
8749 W Summerdale Ave, Chicago, IL 60656
$-151
Cash flow
-4.0%
Cash-on-Cash Return
4.8%
Cap rate
0.9%
Rent to Value Ratio
Active
$100,000
2
bds
|
2
ba
|
1,100
sqft
|
built
1971
100 Park Ave, Calumet City, IL 60409
$479
Cash flow
25.0%
Cash-on-Cash Return
11.4%
Cap rate
1.8%
Rent to Value Ratio
Active
$219,900
4
bds
|
2
ba
|
1,389
sqft
|
built
1960
1401 Stanley Blvd, Calumet City, IL 60409
$-137
Cash flow
-3.3%
Cash-on-Cash Return
4.9%
Cap rate
0.9%
Rent to Value Ratio
Active
$310,000
3
bds
|
2
ba
|
1,624
sqft
|
built
1928
2715 Oak Park Ave, Berwyn, IL 60402
$-339
Cash flow
-5.7%
Cash-on-Cash Return
4.4%
Cap rate
0.9%
Rent to Value Ratio
Active
$499,000
3
bds
|
3
ba
|
2,204
sqft
|
built
2005
7507 Frontage Rd, Skokie, IL 60077
$-850
Cash flow
-8.9%
Cash-on-Cash Return
3.6%
Cap rate
0.7%
Rent to Value Ratio
Active
$524,900
4
bds
|
3
ba
|
2,510
sqft
|
built
1942
5643 S Meade Ave, Chicago, IL 60638
$-1,266
Cash flow
-12.6%
Cash-on-Cash Return
2.8%
Cap rate
0.5%
Rent to Value Ratio
Active
$89,999
6
bds
|
2
ba
|
0
sqft
|
built
1865
347 W 59th Pl, Chicago, IL 60621
$602
Cash flow
34.9%
Cash-on-Cash Return
13.7%
Cap rate
1.8%
Rent to Value Ratio
Active
$315,000
3
bds
|
2
ba
|
1,400
sqft
|
built
1929
7426 S Oakley Ave, Chicago, IL 60636
$-270
Cash flow
-4.5%
Cash-on-Cash Return
4.7%
Cap rate
0.6%
Rent to Value Ratio
Active
$547,000
5
bds
|
3
ba
|
2,550
sqft
|
built
1985
4901 Emerson Ave, Rolling Meadows, IL 60067
$-775
Cash flow
-7.4%
Cash-on-Cash Return
4.0%
Cap rate
0.7%
Rent to Value Ratio
Active
$298,000
5
bds
|
2
ba
|
1,476
sqft
|
built
1925
1635 Linden Rd, Homewood, IL 60430
$-317
Cash flow
-5.6%
Cash-on-Cash Return
4.4%
Cap rate
0.8%
Rent to Value Ratio
Active
$1,474,000
3
bds
|
4
ba
|
2,540
sqft
|
built
2008
600 N Lake Shore Dr, Chicago, IL 60611
$-5,401
Cash flow
-19.1%
Cash-on-Cash Return
1.3%
Cap rate
0.5%
Rent to Value Ratio