Cook County Investment Properties for Sale
Browse homes for sale and investment properties in Cook County. Refine your search by price, property type, or more.
Best cash flowing properties in Cook County
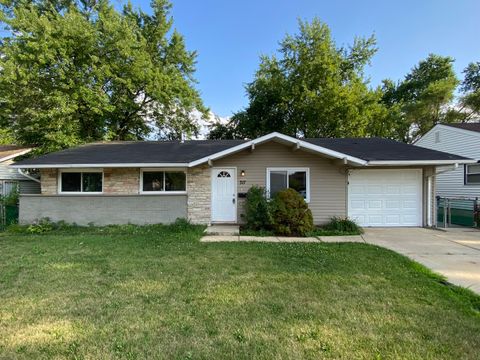
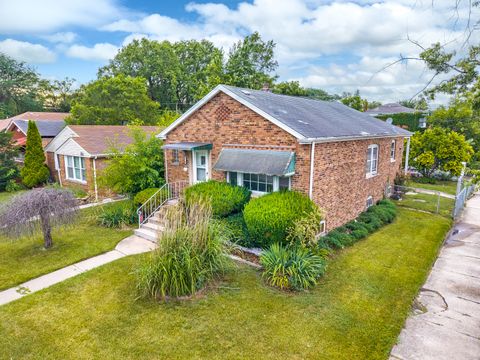
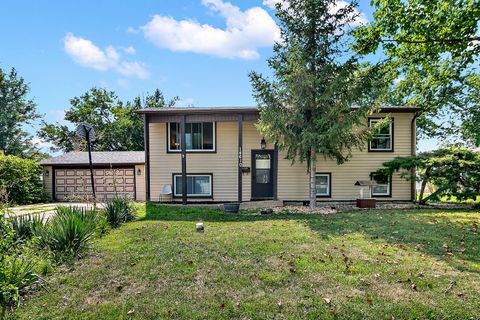
Active
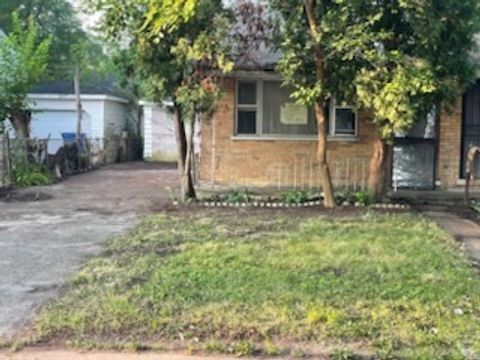
$75,000
3
bds
|
2
ba
|
740
sqft
|
built
1965
941 W 116th Pl, Chicago, IL 60643
$963
Cash flow
67.0%
Cash-on-Cash Return
21.1%
Cap rate
2.7%
Rent to Value Ratio
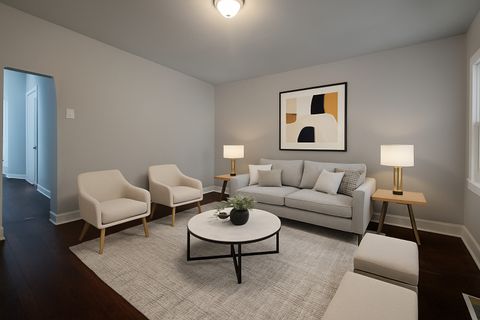
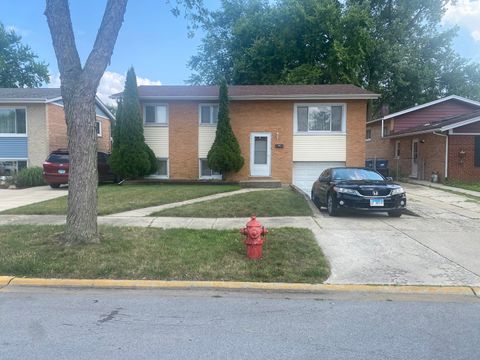
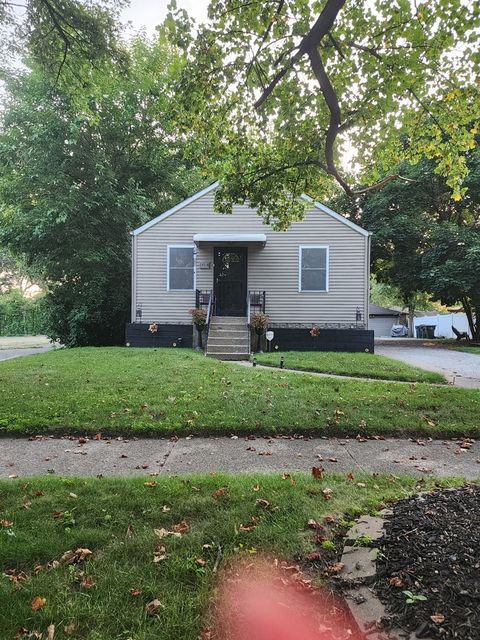
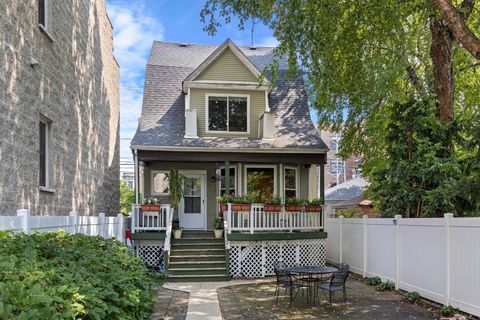
Active
$95,000
4
bds
|
2
ba
|
0
sqft
|
built
1903
8623 S Manistee Ave, Chicago, IL 60617
$715
Cash flow
39.3%
Cash-on-Cash Return
14.7%
Cap rate
1.9%
Rent to Value Ratio
5,242 out of 6,069 properties for sale in Cook County
Limited Results Shown
Create a free account, or log in to reveal all property listings and enjoy the complete experience.
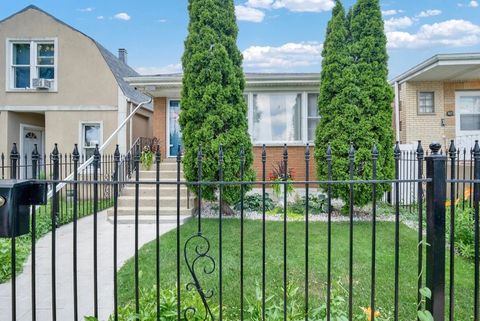
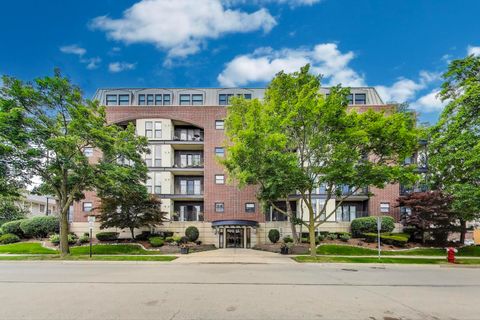
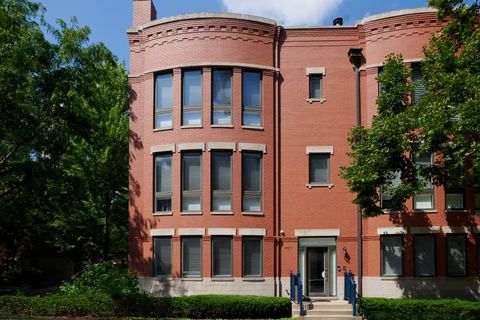
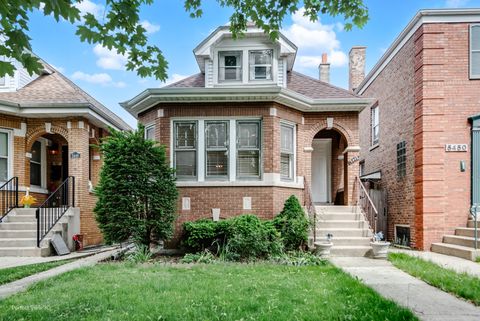
Active
$350,000
3
bds
|
2
ba
|
0
sqft
|
built
1961
3617 W 63rd Pl, Chicago, IL 60629
$-346
Cash flow
-5.2%
Cash-on-Cash Return
4.5%
Cap rate
0.7%
Rent to Value Ratio
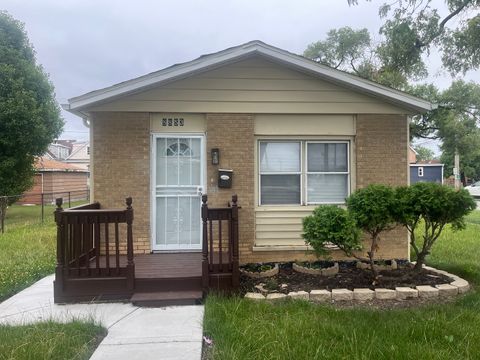
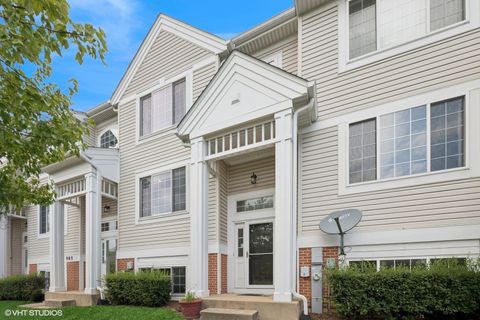
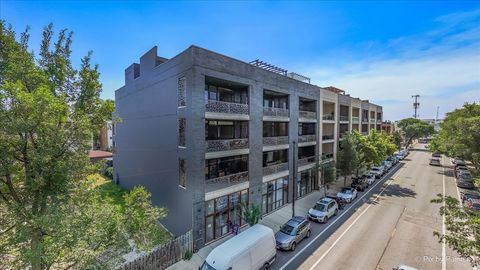
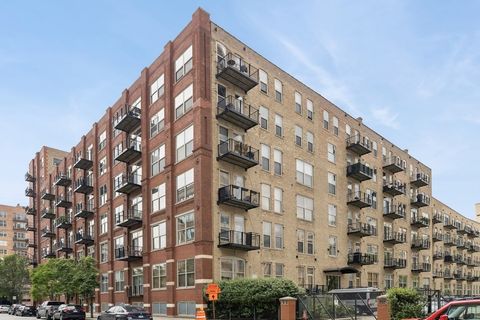
Active
$198,995
3
bds
|
1
ba
|
944
sqft
|
built
1972
8853 S Halsted St, Chicago, IL 60620
$417
Cash flow
10.9%
Cash-on-Cash Return
8.2%
Cap rate
1.1%
Rent to Value Ratio
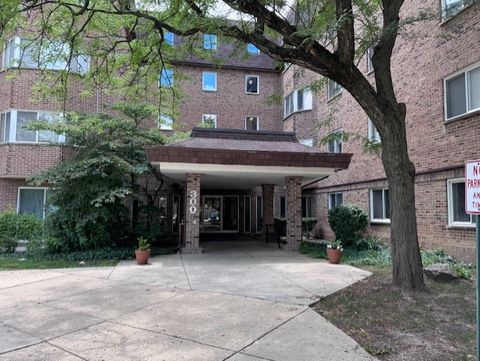
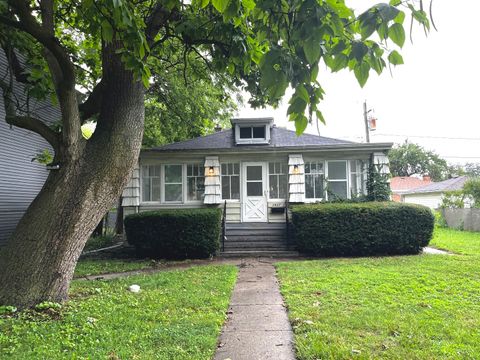
Active
$224,999
2
bds
|
2
ba
|
1,116
sqft
|
built
1970
300 S Roselle Rd, Schaumburg, IL 60193
$-531
Cash flow
-12.3%
Cash-on-Cash Return
2.8%
Cap rate
0.8%
Rent to Value Ratio
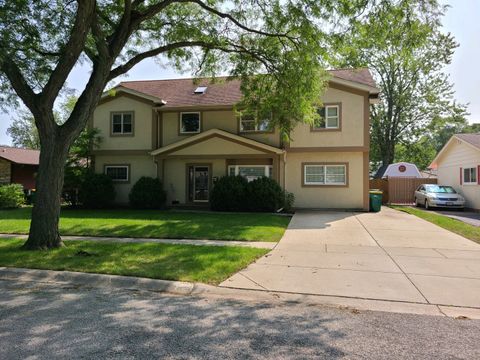
Active
$500,000
4
bds
|
3
ba
|
2,710
sqft
|
built
1964
623 Willow Ln, Elk Grove Village, IL 60007
$-941
Cash flow
-9.8%
Cash-on-Cash Return
3.4%
Cap rate
0.6%
Rent to Value Ratio
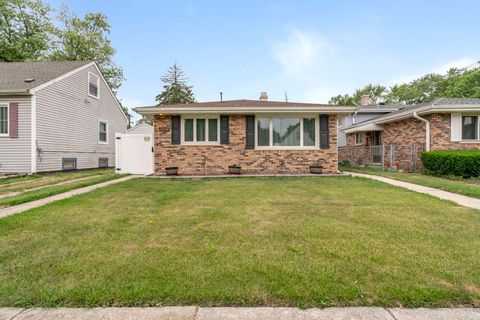
Active
$259,900
3
bds
|
2
ba
|
1,210
sqft
|
built
1970
17608 Community St, Lansing, IL 60438
$-361
Cash flow
-7.2%
Cash-on-Cash Return
4.0%
Cap rate
0.8%
Rent to Value Ratio
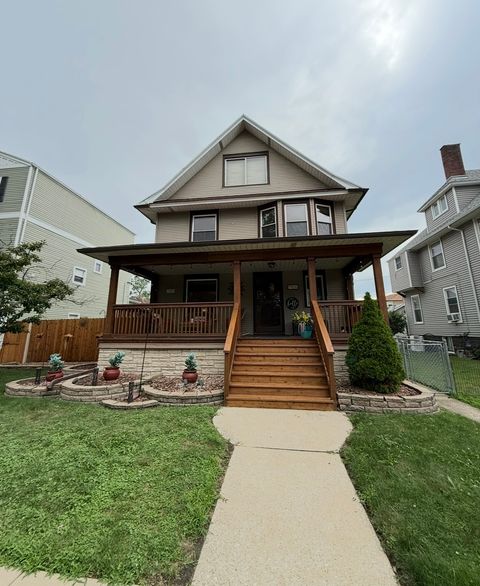
Active
$659,900
4
bds
|
4
ba
|
4,000
sqft
|
built
1914
3416 Euclid Ave, Berwyn, IL 60402
$-1,730
Cash flow
-13.7%
Cash-on-Cash Return
2.5%
Cap rate
0.5%
Rent to Value Ratio
Active
$315,000
4
bds
|
2
ba
|
1,186
sqft
|
built
1966
317 E Schaumburg Rd, Streamwood, IL 60107
$-265
Cash flow
-4.4%
Cash-on-Cash Return
4.7%
Cap rate
0.8%
Rent to Value Ratio
Active
$279,000
2
bds
|
2
ba
|
962
sqft
|
built
1965
3627 W 121st Pl, Alsip, IL 60803
$-436
Cash flow
-8.2%
Cash-on-Cash Return
3.8%
Cap rate
0.7%
Rent to Value Ratio
Active
$399,000
2
bds
|
2
ba
|
1,181
sqft
|
built
1990
110 S Evergreen Ave, Arlington Heights, IL 60005
$-832
Cash flow
-10.9%
Cash-on-Cash Return
3.2%
Cap rate
0.7%
Rent to Value Ratio
Active
$405,000
3
bds
|
3
ba
|
1,600
sqft
|
built
2001
983 Mayfair Ct, Elk Grove Village, IL 60007
$-807
Cash flow
-10.4%
Cash-on-Cash Return
3.3%
Cap rate
0.7%
Rent to Value Ratio
Active
$925,350
5
bds
|
4
ba
|
2,634
sqft
|
built
2006
1712 Woodland Ave, Park Ridge, IL 60068
$-2,431
Cash flow
-13.7%
Cash-on-Cash Return
2.5%
Cap rate
0.5%
Rent to Value Ratio
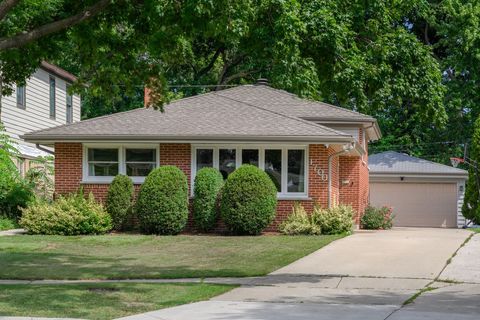
Active
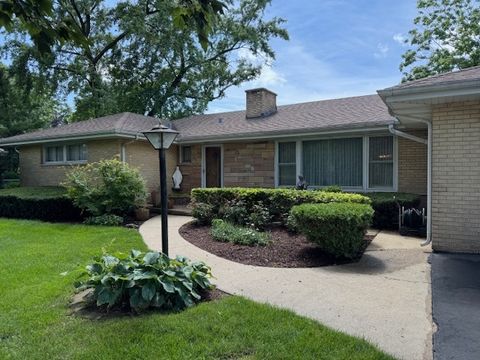
$329,900
4
bds
|
2
ba
|
5,230
sqft
|
built
1956
4221 W 77th Pl, Chicago, IL 60652
$209
Cash flow
3.3%
Cash-on-Cash Return
6.4%
Cap rate
0.8%
Rent to Value Ratio
Active
$180,000
3
bds
|
3
ba
|
1,184
sqft
|
built
1961
456 E 170th St, South Holland, IL 60473
$291
Cash flow
8.4%
Cash-on-Cash Return
7.6%
Cap rate
1.4%
Rent to Value Ratio
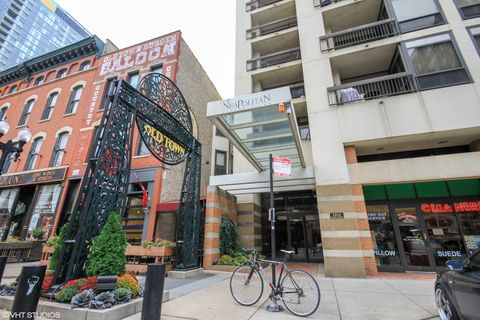
Active
$699,000
3
bds
|
2
ba
|
0
sqft
|
built
2015
1459 W Grand Ave, Chicago, IL 60642
$-1,430
Cash flow
-10.7%
Cash-on-Cash Return
3.2%
Cap rate
0.6%
Rent to Value Ratio
Active
$465,000
2
bds
|
2
ba
|
1,450
sqft
|
built
2001
1212 N Wells St, Chicago, IL 60610
$-966
Cash flow
-10.8%
Cash-on-Cash Return
3.2%
Cap rate
0.9%
Rent to Value Ratio
Active
$115,000
3
bds
|
1
ba
|
1,172
sqft
|
built
1952
119 E 146th St, Riverdale, IL 60827
$320
Cash flow
14.5%
Cash-on-Cash Return
9.0%
Cap rate
1.6%
Rent to Value Ratio
Active
$560,000
3
bds
|
2
ba
|
1,785
sqft
|
built
1961
1700 Marvin Pkwy, Park Ridge, IL 60068
$-1,019
Cash flow
-9.5%
Cash-on-Cash Return
3.5%
Cap rate
0.6%
Rent to Value Ratio
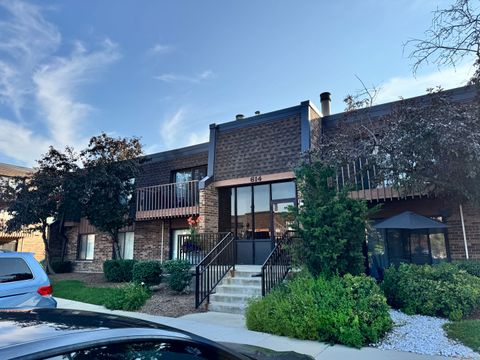
Active
$200,000
2
bds
|
2
ba
|
900
sqft
|
built
1995
614 Tralee Ct, Schaumburg, IL 60193
$-544
Cash flow
-14.2%
Cash-on-Cash Return
2.4%
Cap rate
0.9%
Rent to Value Ratio
Active
$1,350,000
4
bds
|
3
ba
|
0
sqft
|
built
2250 W Ohio St, Chicago, IL 60612
$-4,241
Cash flow
-16.4%
Cash-on-Cash Return
1.9%
Cap rate
0.4%
Rent to Value Ratio
Active
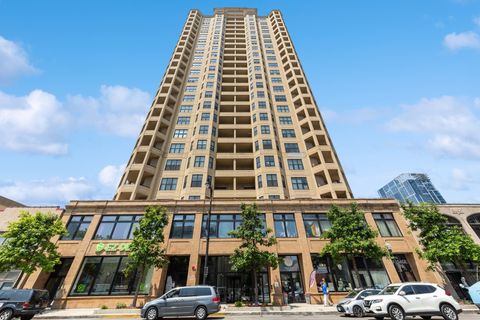
$418,500
2
bds
|
2
ba
|
1,330
sqft
|
built
2008
520 S State St, Chicago, IL 60605
$-1,349
Cash flow
-16.8%
Cash-on-Cash Return
1.8%
Cap rate
0.8%
Rent to Value Ratio
Active
$1,000,000
5
bds
|
5
ba
|
2,859
sqft
|
built
1999
3250 S Normal Ave, Chicago, IL 60616
$-2,694
Cash flow
-14.1%
Cash-on-Cash Return
2.4%
Cap rate
0.4%
Rent to Value Ratio
Active
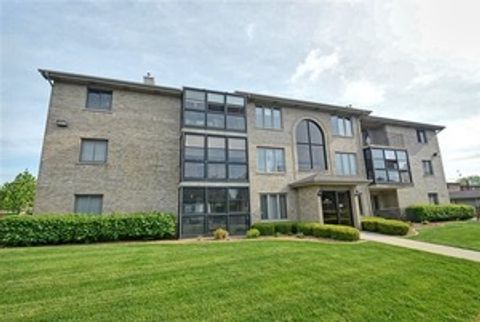
$219,999
2
bds
|
2
ba
|
1,100
sqft
|
built
1979
1785 W Algonquin Rd, Mount Prospect, IL 60056
$-418
Cash flow
-9.9%
Cash-on-Cash Return
3.4%
Cap rate
0.8%
Rent to Value Ratio
Active
$375,000
4
bds
|
2
ba
|
2,028
sqft
|
built
1963
14610 Birch St, Orland Park, IL 60462
$-448
Cash flow
-6.2%
Cash-on-Cash Return
4.2%
Cap rate
0.7%
Rent to Value Ratio
Active
$185,000
3
bds
|
3
ba
|
1,100
sqft
|
built
1939
14714 Beachview Ter, Dolton, IL 60419
$95
Cash flow
2.7%
Cash-on-Cash Return
6.3%
Cap rate
0.9%
Rent to Value Ratio
Active
$1,300,000
2
bds
|
3
ba
|
2,800
sqft
|
built
2000
460 N Canal St, Chicago, IL 60654
$-5,173
Cash flow
-20.8%
Cash-on-Cash Return
0.9%
Cap rate
0.4%
Rent to Value Ratio
Active
$725,000
3
bds
|
2
ba
|
2,000
sqft
|
built
2019
851 N California Ave, Chicago, IL 60622
$-1,434
Cash flow
-10.3%
Cash-on-Cash Return
3.3%
Cap rate
0.6%
Rent to Value Ratio
Active
$875,000
2
bds
|
3
ba
|
1,306
sqft
|
built
1903
4911 N Ashland Ave, Chicago, IL 60640
$-1,550
Cash flow
-9.2%
Cash-on-Cash Return
3.6%
Cap rate
0.6%
Rent to Value Ratio
Active
$595,000
3
bds
|
3
ba
|
0
sqft
|
built
1927
5448 N Lieb Ave, Chicago, IL 60630
$-928
Cash flow
-8.1%
Cash-on-Cash Return
3.8%
Cap rate
0.5%
Rent to Value Ratio
Active
$239,000
1
bds
|
1
ba
|
0
sqft
|
built
1892
420 S Clinton St, Chicago, IL 60607
$-634
Cash flow
-13.8%
Cash-on-Cash Return
2.5%
Cap rate
0.9%
Rent to Value Ratio
Active
$332,000
3
bds
|
1
ba
|
1,028
sqft
|
built
1910
3807 Wesley Ave, Berwyn, IL 60402
$-610
Cash flow
-9.6%
Cash-on-Cash Return
3.5%
Cap rate
0.7%
Rent to Value Ratio
Active
$679,000
6
bds
|
4
ba
|
0
sqft
|
built
1883
2713 S Crowell St, Chicago, IL 60608
$-1,879
Cash flow
-14.4%
Cash-on-Cash Return
2.4%
Cap rate
0.4%
Rent to Value Ratio
Active
$479,900
3
bds
|
2
ba
|
1,850
sqft
|
built
1997
5555 N Cumberland Ave, Chicago, IL 60656
$-1,311
Cash flow
-14.3%
Cash-on-Cash Return
2.4%
Cap rate
0.6%
Rent to Value Ratio
Active
$339,000
3
bds
|
2
ba
|
1,400
sqft
|
built
1944
1068 N Coolidge Ave, Palatine, IL 60067
$-330
Cash flow
-5.1%
Cash-on-Cash Return
4.5%
Cap rate
0.8%
Rent to Value Ratio
Active
$279,900
4
bds
|
1
ba
|
1,056
sqft
|
built
1957
7840 Massasoit Ave, Burbank, IL 60459
$37
Cash flow
0.7%
Cash-on-Cash Return
5.8%
Cap rate
0.9%
Rent to Value Ratio
Active
$479,000
4
bds
|
3
ba
|
1,660
sqft
|
built
1959
1014 N Elmhurst Rd, Prospect Heights, IL 60070
$-336
Cash flow
-3.7%
Cash-on-Cash Return
4.8%
Cap rate
0.7%
Rent to Value Ratio
Active
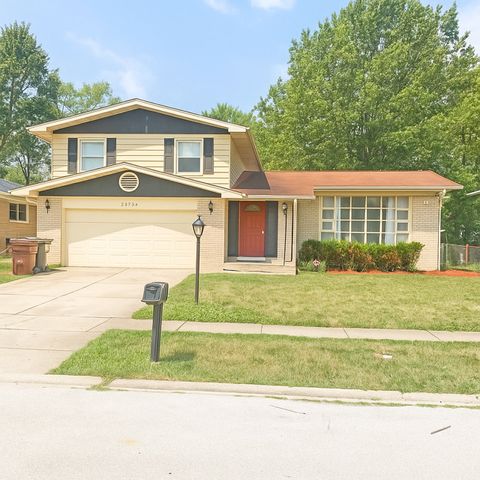
$239,900
3
bds
|
2
ba
|
1,489
sqft
|
built
1972
22904 Valley Dr, Richton Park, IL 60471
$-332
Cash flow
-7.2%
Cash-on-Cash Return
4.0%
Cap rate
1.0%
Rent to Value Ratio
Active
$248,000
1
bds
|
1
ba
|
0
sqft
|
built
2007
1464 S Michigan Ave, Chicago, IL 60605
$-860
Cash flow
-18.1%
Cash-on-Cash Return
1.5%
Cap rate
0.8%
Rent to Value Ratio
Active
$208,900
2
bds
|
2
ba
|
1,200
sqft
|
built
1995
5018 Midlothian Tpke, Crestwood, IL 60418
$-1
Cash flow
0.0%
Cash-on-Cash Return
5.7%
Cap rate
1.0%
Rent to Value Ratio