Cook County Investment Properties for Sale
Browse homes for sale and investment properties in Cook County. Refine your search by price, property type, or more.
Best cash flowing properties in Cook County
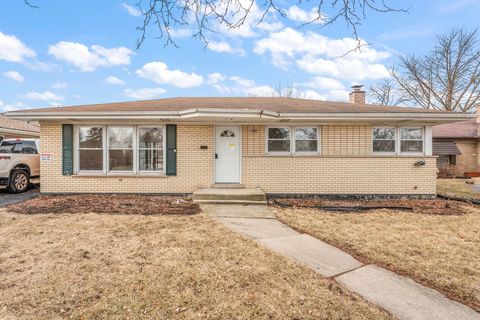
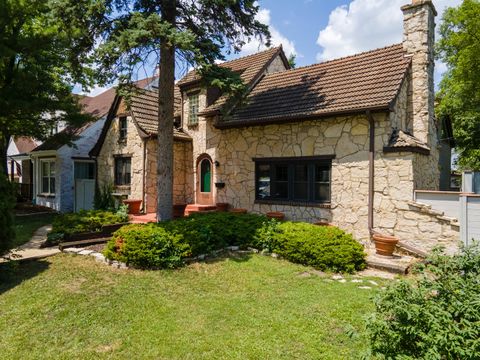
Active
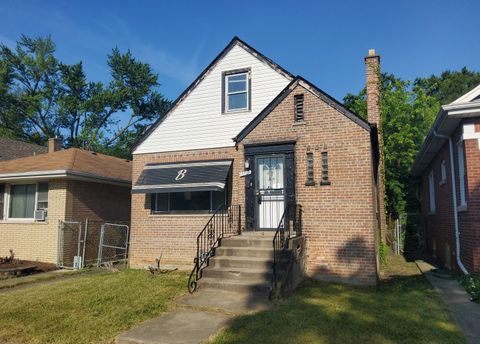
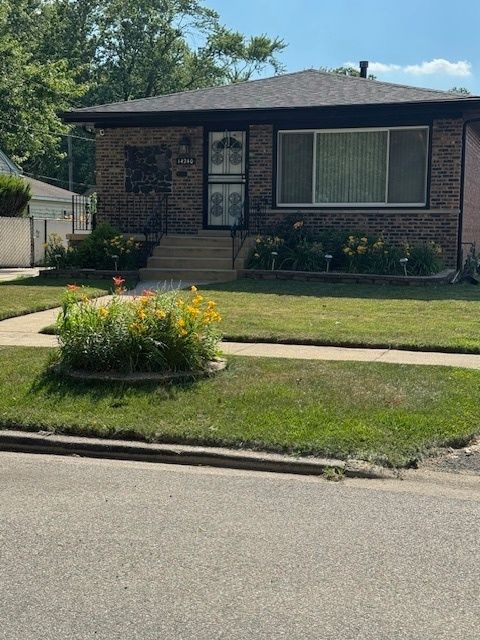
$69,900
3
bds
|
1
ba
|
793
sqft
|
built
1944
15734 Marshfield Ave, Harvey, IL 60426
$841
Cash flow
14.0%
Cash-on-Cash Return
14.4%
Cap rate
2.4%
Rent to Value Ratio
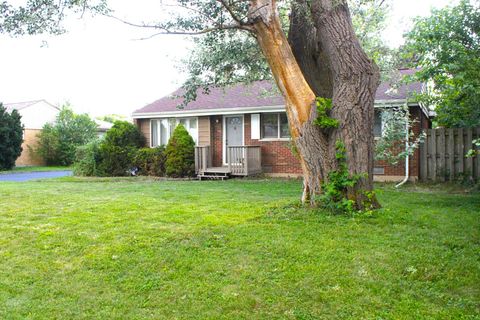
Active
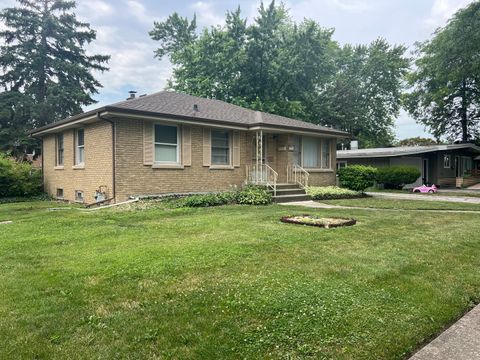
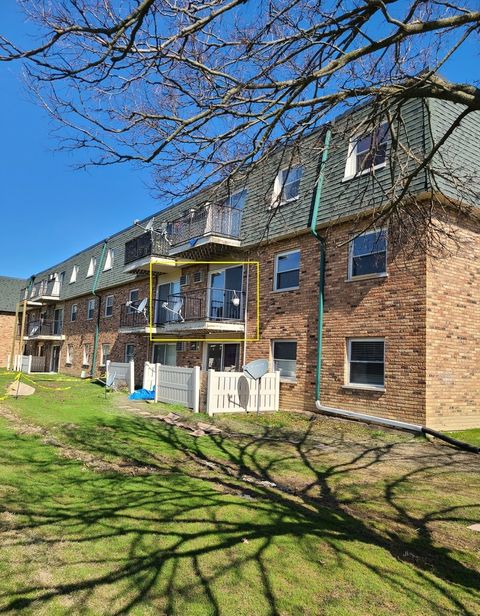
$189,000
3
bds
|
2
ba
|
1,080
sqft
|
built
1957
243 E 170th St, South Holland, IL 60473
$746
Cash flow
20.6%
Cash-on-Cash Return
10.4%
Cap rate
1.3%
Rent to Value Ratio
4,034 out of 4,728 properties for sale in Cook County
Limited Results Shown
Create a free account, or log in to reveal all property listings and enjoy the complete experience.
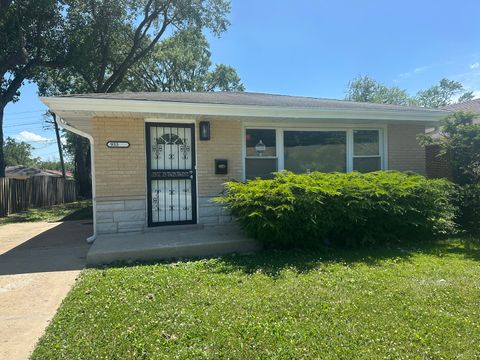
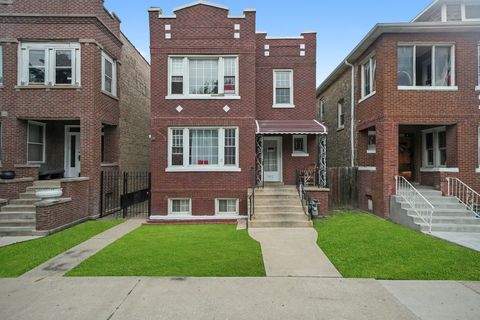
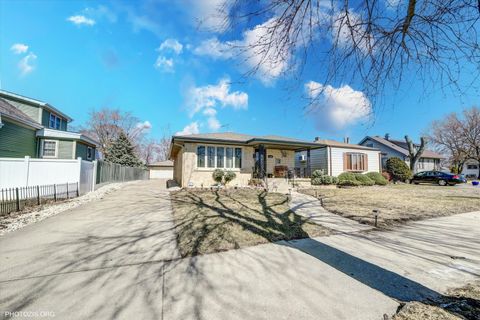
Active
$189,900
3
bds
|
2
ba
|
0
sqft
|
built
1970
933 E 142nd St, Dolton, IL 60419
$150
Cash flow
4.1%
Cash-on-Cash Return
6.6%
Cap rate
1.3%
Rent to Value Ratio
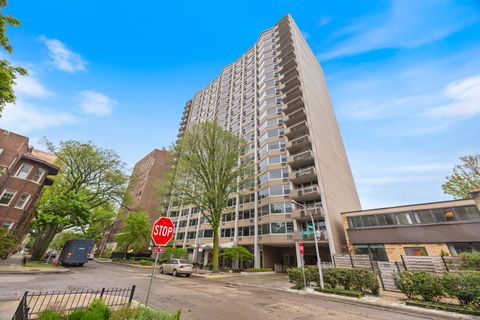
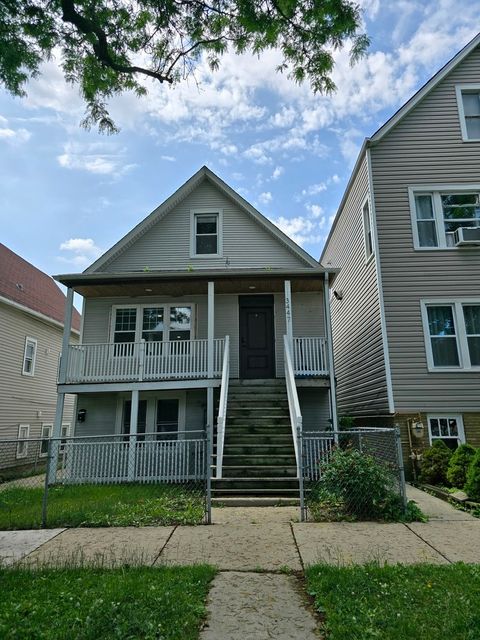
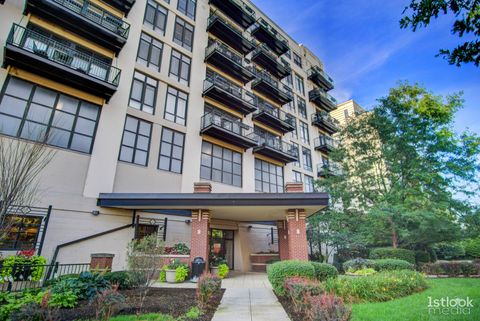
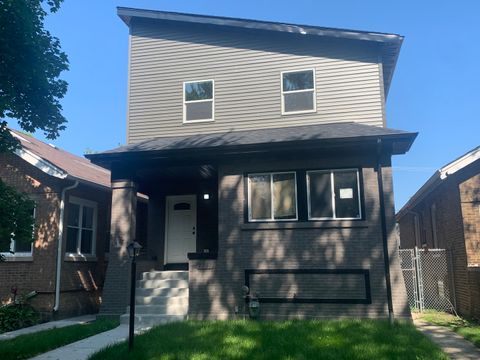
Active
$229,000
1
bds
|
1
ba
|
0
sqft
|
built
1961
555 W Cornelia Ave, Chicago, IL 60657
$-599
Cash flow
-13.6%
Cash-on-Cash Return
2.5%
Cap rate
1.0%
Rent to Value Ratio
Active
$209,900
3
bds
|
2
ba
|
1,091
sqft
|
built
1971
14240 S Manistee Ave, Burnham, IL 60633
$-37
Cash flow
-0.9%
Cash-on-Cash Return
5.5%
Cap rate
1.0%
Rent to Value Ratio
Active
$174,900
2
bds
|
1
ba
|
980
sqft
|
built
1972
9950 S 84th Ter, Palos Hills, IL 60465
$-229
Cash flow
-6.8%
Cash-on-Cash Return
4.1%
Cap rate
1.0%
Rent to Value Ratio

Active
$249,900
2
bds
|
1
ba
|
802
sqft
|
built
1921
4333 N Troy St, Chicago, IL 60618
$-482
Cash flow
-10.1%
Cash-on-Cash Return
3.4%
Cap rate
0.7%
Rent to Value Ratio
Active
$420,000
4
bds
|
3
ba
|
0
sqft
|
built
1922
1802 S 50th Ave, Cicero, IL 60804
$-1,081
Cash flow
-13.4%
Cash-on-Cash Return
2.6%
Cap rate
0.6%
Rent to Value Ratio
Active
$400,000
6
bds
|
2
ba
|
0
sqft
|
built
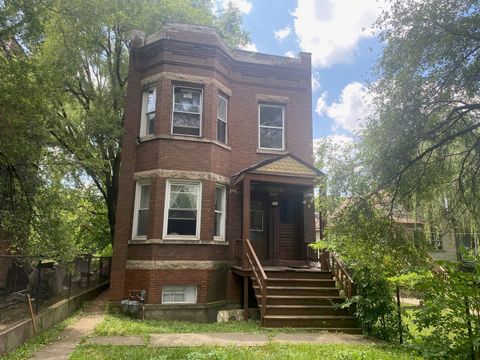
1908
3447 W Melrose St, Chicago, IL 60618
$-1,166
Cash flow
-15.2%
Cash-on-Cash Return
2.2%
Cap rate
0.5%
Rent to Value Ratio
Active
$349,880
4
bds
|
2
ba
|
0
sqft
|
built
1923
7318 W Archer Ave, Summit, IL 60501
$-688
Cash flow
-10.3%
Cash-on-Cash Return
3.3%
Cap rate
0.7%
Rent to Value Ratio
Active
$190,000
4
bds
|
2
ba
|
1,842
sqft
|
built
1898
13823 Lincoln Ave, Dolton, IL 60419
$168
Cash flow
4.6%
Cash-on-Cash Return
6.7%
Cap rate
1.3%
Rent to Value Ratio
Active
$434,914
3
bds
|
3
ba
|
818
sqft
|
built
1910
4160 W Eddy St, Chicago, IL 60641
$-838
Cash flow
-10.1%
Cash-on-Cash Return
3.4%
Cap rate
0.6%
Rent to Value Ratio
Active
$280,000
4
bds
|
3
ba
|
1,900
sqft
|
built
1921
5409 S Richmond St, Chicago, IL 60632
$-37
Cash flow
-0.7%
Cash-on-Cash Return
5.5%
Cap rate
0.8%
Rent to Value Ratio
Active
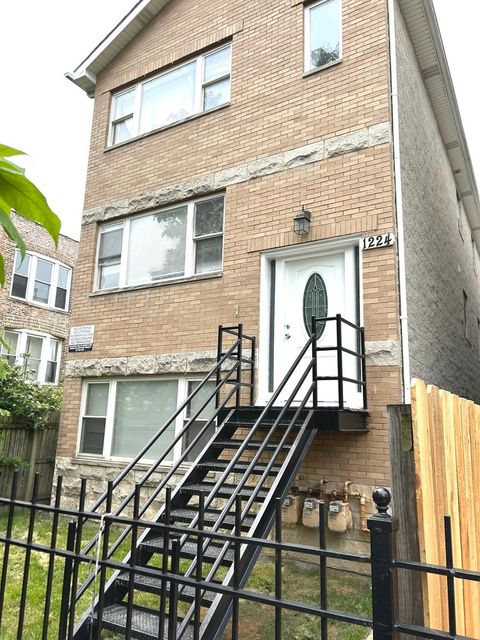
$469,000
9
bds
|
6
ba
|
0
sqft
|
built
2009
1224 S Harding Ave, Chicago, IL 60623
$-1,103
Cash flow
-12.3%
Cash-on-Cash Return
2.9%
Cap rate
0.5%
Rent to Value Ratio
Active
$649,900
4
bds
|
2
ba
|
2,268
sqft
|
built
1965
9249 Kildare Ave, Skokie, IL 60076
$-1,494
Cash flow
-12.0%
Cash-on-Cash Return
2.9%
Cap rate
0.5%
Rent to Value Ratio
Active
$189,900
1
bds
|
1
ba
|
750
sqft
|
built
1984
5320 N Sheridan Rd, Chicago, IL 60640
$-331
Cash flow
-9.1%
Cash-on-Cash Return
3.6%
Cap rate
1.1%
Rent to Value Ratio

Active
$145,000
2
bds
|
1
ba
|
526
sqft
|
built
1923
10007 S Hoxie Ave, Chicago, IL 60617
$140
Cash flow
5.0%
Cash-on-Cash Return
6.8%
Cap rate
0.9%
Rent to Value Ratio
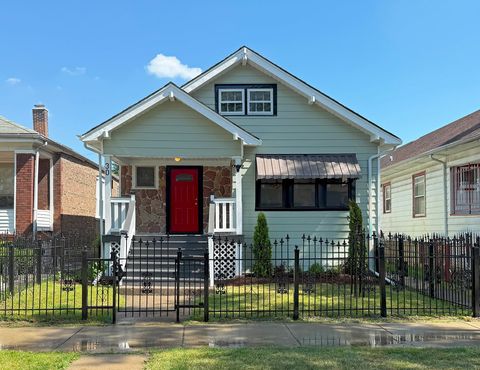
Active
$209,000
3
bds
|
2
ba
|
1,080
sqft
|
built
1921
30 E 102nd St, Chicago, IL 60628
$280
Cash flow
7.0%
Cash-on-Cash Return
7.3%
Cap rate
1.0%
Rent to Value Ratio

Active
$375,000
2
bds
|
2
ba
|
955
sqft
|
built
1913
3120 N Natoma Ave, Chicago, IL 60634
$-262
Cash flow
-3.6%
Cash-on-Cash Return
4.8%
Cap rate
0.7%
Rent to Value Ratio
Active
$270,000
3
bds
|
2
ba
|
2,260
sqft
|
built
1965
16832 School St, South Holland, IL 60473
$605
Cash flow
11.7%
Cash-on-Cash Return
8.4%
Cap rate
1.3%
Rent to Value Ratio
Active
$334,999
2
bds
|
2
ba
|
1,200
sqft
|
built
2003
1525 S Sangamon St, Chicago, IL 60608
$-778
Cash flow
-12.1%
Cash-on-Cash Return
2.9%
Cap rate
0.8%
Rent to Value Ratio
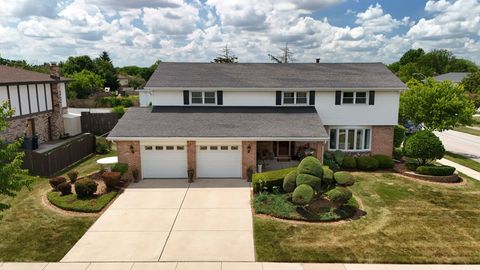
Active
$559,000
4
bds
|
3
ba
|
3,540
sqft
|
built
1978
15624 Sunset Ridge Dr, Orland Park, IL 60462
$-886
Cash flow
-8.3%
Cash-on-Cash Return
3.8%
Cap rate
0.7%
Rent to Value Ratio
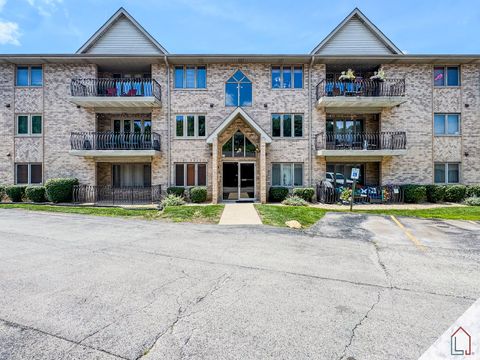
Active
$203,000
2
bds
|
2
ba
|
1,150
sqft
|
built
1996
5140 Shadow Creek Dr, Oak Forest, IL 60452
$-178
Cash flow
-4.6%
Cash-on-Cash Return
4.6%
Cap rate
1.0%
Rent to Value Ratio

Active
$655,000
7
bds
|
5
ba
|
0
sqft
|
built
1903
824 N California Ave, Chicago, IL 60622
$-1,210
Cash flow
-9.6%
Cash-on-Cash Return
3.5%
Cap rate
0.4%
Rent to Value Ratio

Active
$189,900
2
bds
|
1
ba
|
850
sqft
|
built
1966
7952 Madison St, River Forest, IL 60305
$-329
Cash flow
-9.0%
Cash-on-Cash Return
3.6%
Cap rate
1.0%
Rent to Value Ratio
Active
$265,000
2
bds
|
2
ba
|
1,100
sqft
|
built
1967
18 E Old Willow Rd, Prospect Heights, IL 60070
$-580
Cash flow
-11.4%
Cash-on-Cash Return
3.1%
Cap rate
0.8%
Rent to Value Ratio
Active
$319,999
4
bds
|
3
ba
|
2,523
sqft
|
built
1995
18133 Brittany Ln, Lansing, IL 60438
$-178
Cash flow
-2.9%
Cash-on-Cash Return
5.0%
Cap rate
0.8%
Rent to Value Ratio
Active
$850,000
3
bds
|
4
ba
|
2,744
sqft
|
built
1951
4944 Jarvis Ave, Skokie, IL 60077
$-2,645
Cash flow
-16.2%
Cash-on-Cash Return
1.9%
Cap rate
0.3%
Rent to Value Ratio
Active
$188,888
2
bds
|
1
ba
|
950
sqft
|
built
1964
4444 N Central Ave, Chicago, IL 60630
$-219
Cash flow
-6.0%
Cash-on-Cash Return
4.3%
Cap rate
1.0%
Rent to Value Ratio
Active
$689,000
3
bds
|
3
ba
|
3,258
sqft
|
built
1927
1928 Kennicott Ct, Des Plaines, IL 60018
$-1,017
Cash flow
-7.7%
Cash-on-Cash Return
3.9%
Cap rate
0.6%
Rent to Value Ratio
Active
$299,900
4
bds
|
2
ba
|
1,283
sqft
|
built
1958
7926 S 83rd Ct, Justice, IL 60458
$-202
Cash flow
-3.5%
Cash-on-Cash Return
4.9%
Cap rate
0.8%
Rent to Value Ratio
Active
$350,000
3
bds
|
3
ba
|
1,460
sqft
|
built
1963
2606 Ridge Rd, Lansing, IL 60438
$-878
Cash flow
-13.1%
Cash-on-Cash Return
2.7%
Cap rate
0.7%
Rent to Value Ratio
Active
$440,000
3
bds
|
5
ba
|
3,912
sqft
|
built
1920
7711 S Ridgeland Ave, Chicago, IL 60649
$-1,154
Cash flow
-13.7%
Cash-on-Cash Return
2.5%
Cap rate
0.4%
Rent to Value Ratio

Active
$124,900
6
bds
|
2
ba
|
0
sqft
|
built
1900
8035 S Houston Ave, Chicago, IL 60617
$484
Cash flow
20.2%
Cash-on-Cash Return
10.3%
Cap rate
1.4%
Rent to Value Ratio
Active
$200,000
4
bds
|
2
ba
|
0
sqft
|
built
1898
129 E Kensington Ave, Chicago, IL 60628
$456
Cash flow
11.9%
Cash-on-Cash Return
8.4%
Cap rate
1.1%
Rent to Value Ratio
Active
$229,999
4
bds
|
2
ba
|
1,511
sqft
|
built
1966
360 Chappel Ave, Calumet City, IL 60409
$-278
Cash flow
-6.3%
Cash-on-Cash Return
4.2%
Cap rate
1.1%
Rent to Value Ratio
Active
$204,000
3
bds
|
1
ba
|
1,084
sqft
|
built
1963
234 Tahoe Dr, Chicago Heights, IL 60411
$-107
Cash flow
-2.7%
Cash-on-Cash Return
5.0%
Cap rate
1.0%
Rent to Value Ratio

Active
$255,000
3
bds
|
2
ba
|
993
sqft
|
built
1922
7915 S Justine St, Chicago, IL 60620
$-20
Cash flow
-0.4%
Cash-on-Cash Return
5.6%
Cap rate
0.7%
Rent to Value Ratio

Active
$1,287,505
9
bds
|
7
ba
|
0
sqft
|
built
1885
2458 N Clybourn Ave, Chicago, IL 60614
$-5,847
Cash flow
-23.7%
Cash-on-Cash Return
0.2%
Cap rate
0.2%
Rent to Value Ratio

Active
$249,900
6
bds
|
2
ba
|
0
sqft
|
built
1895
7948 S Union Ave, Chicago, IL 60620
$-158
Cash flow
-3.3%
Cash-on-Cash Return
4.9%
Cap rate
0.6%
Rent to Value Ratio