Cook County Investment Properties for Sale
Browse homes for sale and investment properties in Cook County. Refine your search by price, property type, or more.
Best cash flowing properties in Cook County
Active
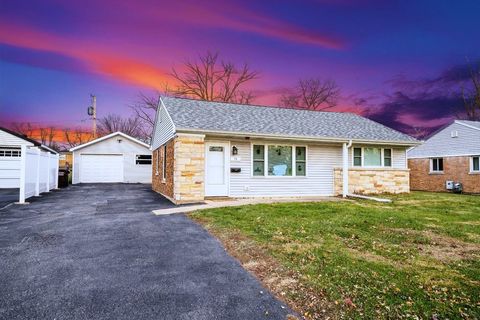
$69,900
1
bds
|
1
ba
|
750
sqft
|
built
1961
17963 Huntleigh Ct, Country Club Hills, IL 60478
$907
Cash flow
15.1%
Cash-on-Cash Return
15.6%
Cap rate
2.6%
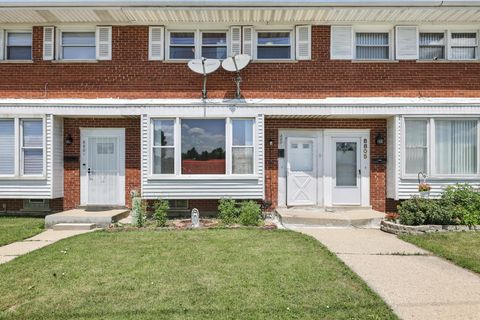
Rent to Value Ratio
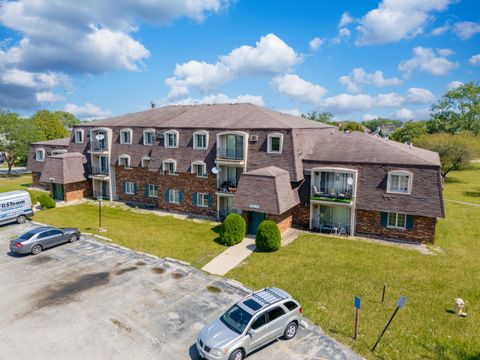
Active
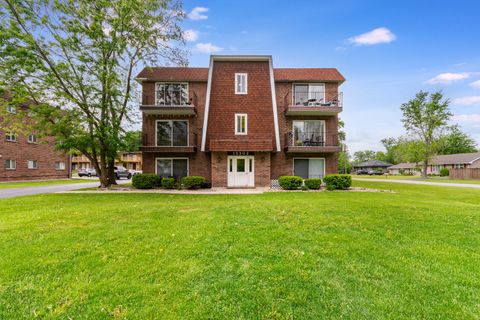
$73,000
2
bds
|
1
ba
|
950
sqft
|
built
1977
3026 Bernice Rd, Lansing, IL 60438
$619
Cash flow
9.9%
Cash-on-Cash Return
10.2%
Cap rate
1.9%
Rent to Value Ratio
4,551 out of 5,298 properties for sale in Cook County
Limited Results Shown
Create a free account, or log in to reveal all property listings and enjoy the complete experience.
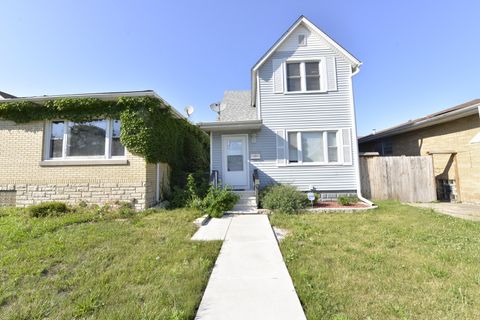
Active
$444,000
3
bds
|
2
ba
|
1,263
sqft
|
built
1962
7632 W Norridge St, Norridge, IL 60706
$-642
Cash flow
-7.5%
Cash-on-Cash Return
3.9%
Cap rate
0.7%
Rent to Value Ratio
Active
$219,000
2
bds
|
2
ba
|
1,000
sqft
|
built
1981
3256 Sanders Rd, Northbrook, IL 60062
$-227
Cash flow
-5.4%
Cash-on-Cash Return
4.4%
Cap rate
0.9%
Rent to Value Ratio
Active
$169,900
2
bds
|
1
ba
|
1,249
sqft
|
built
1951
74 Marquette St, Park Forest, IL 60466
$-278
Cash flow
-8.5%
Cash-on-Cash Return
3.7%
Cap rate
1.3%
Rent to Value Ratio
Active
$94,900
1
bds
|
1
ba
|
0
sqft
|
built
1972
15302 Kenton Ave, Oak Forest, IL 60452
$-19
Cash flow
-1.0%
Cash-on-Cash Return
5.4%
Cap rate
1.4%
Rent to Value Ratio
Active
$184,900
4
bds
|
3
ba
|
1,803
sqft
|
built
1878
422 Sibley Blvd, Calumet City, IL 60409
$146
Cash flow
4.1%
Cash-on-Cash Return
6.6%
Cap rate
1.1%
Rent to Value Ratio
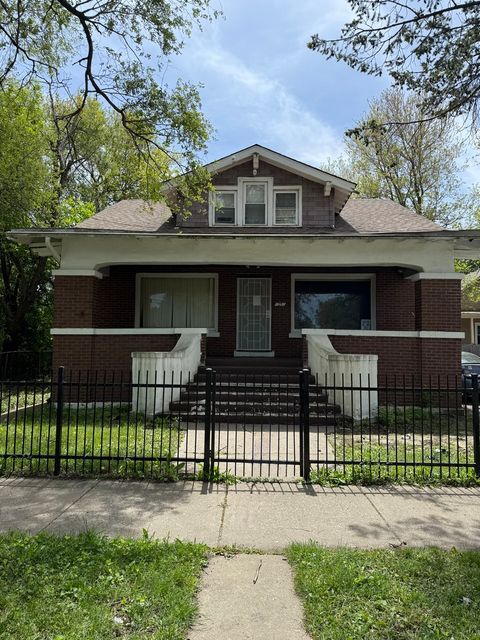
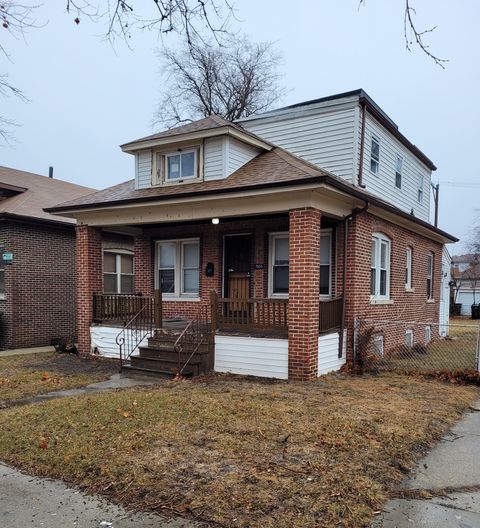
Active
$223,000
4
bds
|
3
ba
|
828
sqft
|
built
1893
25 W 110th St, Chicago, IL 60628
$497
Cash flow
11.6%
Cash-on-Cash Return
8.4%
Cap rate
1.0%
Rent to Value Ratio
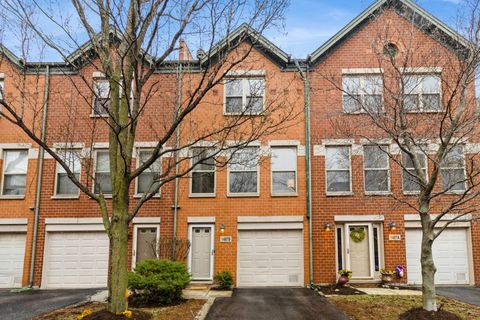
Active
$690,900
3
bds
|
3
ba
|
1,422
sqft
|
built
2001
1487 N Clybourn Ave, Chicago, IL 60610
$-1,462
Cash flow
-11.0%
Cash-on-Cash Return
3.1%
Cap rate
0.6%
Rent to Value Ratio
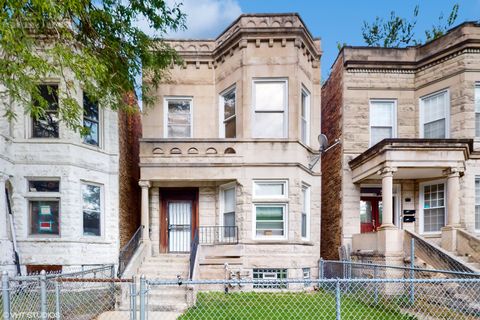
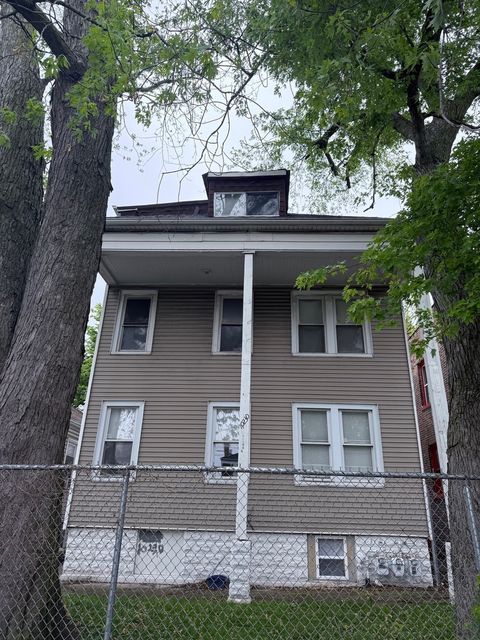
Active
$320,000
7
bds
|
2
ba
|
0
sqft
|
built
1903
6411 S Peoria St, Chicago, IL 60621
$-146
Cash flow
-2.4%
Cash-on-Cash Return
5.1%
Cap rate
0.6%
Rent to Value Ratio
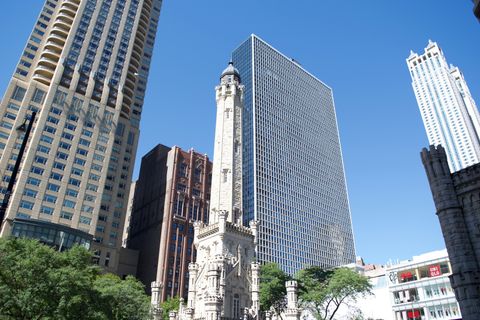
Active
$415,000
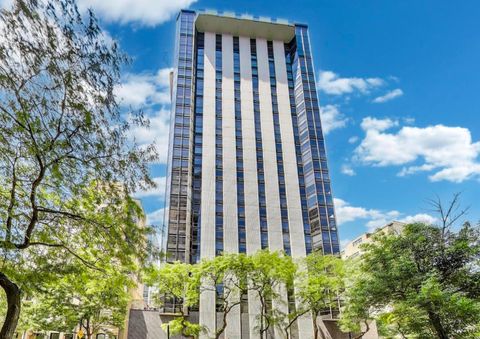
1
bds
|
1
ba
|
1,000
sqft
|
built
1972
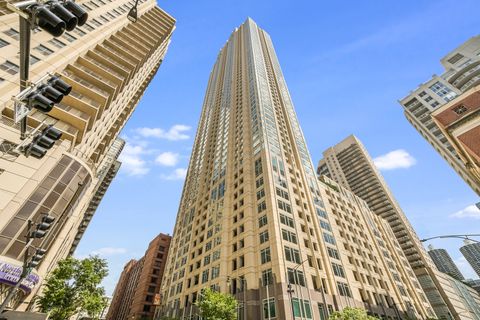
111 E Chestnut St, Chicago, IL 60611
$-1,242
Cash flow
-15.6%
Cash-on-Cash Return
2.1%
Cap rate
0.7%
Rent to Value Ratio
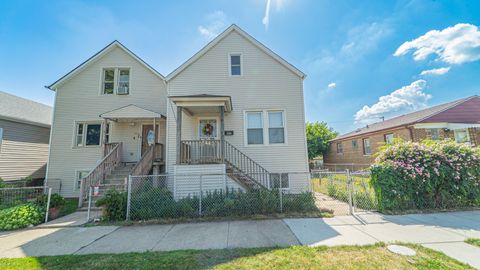
Active
$229,900
2
bds
|
1
ba
|
1,300
sqft
|
built
1890
10439 S Avenue M, Chicago, IL 60617
$80
Cash flow
1.8%
Cash-on-Cash Return
6.1%
Cap rate
0.8%
Rent to Value Ratio
Active
$250,000
2
bds
|
1
ba
|
1,000
sqft
|
built
1925
3135 W Leland Ave, Chicago, IL 60625
$-782
Cash flow
-16.3%
Cash-on-Cash Return
1.9%
Cap rate
0.6%
Rent to Value Ratio
Active
$515,000
2
bds
|
2
ba
|
1,100
sqft
|
built
2005
130 N Garland Ct, Chicago, IL 60602
$-1,760
Cash flow
-17.8%
Cash-on-Cash Return
1.6%
Cap rate
0.6%
Rent to Value Ratio
Active
$415,000
2
bds
|
2
ba
|
1,070
sqft
|
built
2007
1901 S Calumet Ave, Chicago, IL 60616
$-1,328
Cash flow
-16.7%
Cash-on-Cash Return
1.8%
Cap rate
0.8%
Rent to Value Ratio
Active
$290,000
4
bds
|
2
ba
|
0
sqft
|
built
1888
14040 Lincoln Ave, Dolton, IL 60419
$-716
Cash flow
-12.9%
Cash-on-Cash Return
2.7%
Cap rate
0.6%
Rent to Value Ratio
Active
$599,000
4
bds
|
3
ba
|
0
sqft
|
built
1928
5121 W Henderson St, Chicago, IL 60641
$-1,666
Cash flow
-14.5%
Cash-on-Cash Return
2.3%
Cap rate
0.4%
Rent to Value Ratio
Active
$215,000
5
bds
|
3
ba
|
0
sqft
|
built
1883
4838 S Bishop St, Chicago, IL 60609
$342
Cash flow
8.3%
Cash-on-Cash Return
7.6%
Cap rate
1.0%
Rent to Value Ratio
Active
$164,000
1
bds
|
1
ba
|
0
sqft
|
built
1913
510 Madison St, Oak Park, IL 60302
$-165
Cash flow
-5.2%
Cash-on-Cash Return
4.5%
Cap rate
1.0%
Rent to Value Ratio
Active
$175,000
2
bds
|
1
ba
|
0
sqft
|
built
1966
3848 25th Ave, Schiller Park, IL 60176
$-372
Cash flow
-11.1%
Cash-on-Cash Return
3.1%
Cap rate
0.9%
Rent to Value Ratio
Active
$650,000
2
bds
|
2
ba
|
1,384
sqft
|
built
1963
1310 N Ritchie Ct, Chicago, IL 60610
$-2,407
Cash flow
-19.3%
Cash-on-Cash Return
1.2%
Cap rate
0.6%
Rent to Value Ratio
Active
$140,000
4
bds
|
2
ba
|
1,140
sqft
|
built
1918
7655 S Clyde Ave, Chicago, IL 60649
$347
Cash flow
12.9%
Cash-on-Cash Return
8.7%
Cap rate
1.2%
Rent to Value Ratio
Active
$339,000
3
bds
|
2
ba
|
1,280
sqft
|
built
1963
8803 N Grand St, Niles, IL 60714
$-334
Cash flow
-5.1%
Cash-on-Cash Return
4.5%
Cap rate
0.7%
Rent to Value Ratio
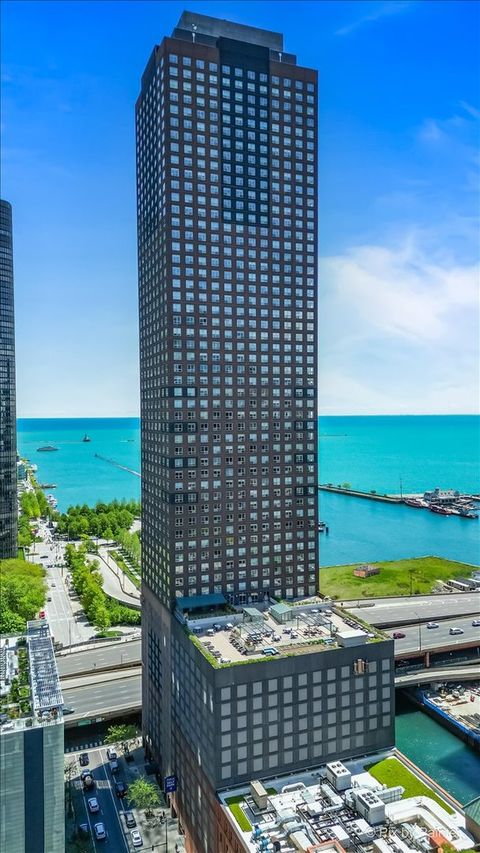
Active
$280,000
1
bds
|
1
ba
|
0
sqft
|
built
1991
474 N Lake Shore Dr, Chicago, IL 60611
$-769
Cash flow
-14.3%
Cash-on-Cash Return
2.4%
Cap rate
0.9%
Rent to Value Ratio
Active
$1,299,770
5
bds
|
4
ba
|
3,318
sqft
|
built
1949
2900 W Birchwood Ave, Chicago, IL 60645
$-3,634
Cash flow
-14.6%
Cash-on-Cash Return
2.3%
Cap rate
0.4%
Rent to Value Ratio
Active
$318,900
3
bds
|
1
ba
|
1,433
sqft
|
built
1953
7814 S Trumbull Ave, Chicago, IL 60652
$-85
Cash flow
-1.4%
Cash-on-Cash Return
5.4%
Cap rate
0.8%
Rent to Value Ratio
Active
$360,000
4
bds
|
2
ba
|
1,728
sqft
|
built
1955
7306 W 115th St, Worth, IL 60482
$-468
Cash flow
-6.8%
Cash-on-Cash Return
4.1%
Cap rate
0.7%
Rent to Value Ratio

Active
$325,000
2
bds
|
2
ba
|
1,165
sqft
|
built
1925
6326 W Berenice Ave, Chicago, IL 60634
$57
Cash flow
0.9%
Cash-on-Cash Return
5.9%
Cap rate
0.9%
Rent to Value Ratio
Active
$138,500
1
bds
|
1
ba
|
600
sqft
|
built
1970
1227 S Harlem Ave, Berwyn, IL 60402
$-210
Cash flow
-7.9%
Cash-on-Cash Return
3.9%
Cap rate
0.9%
Rent to Value Ratio
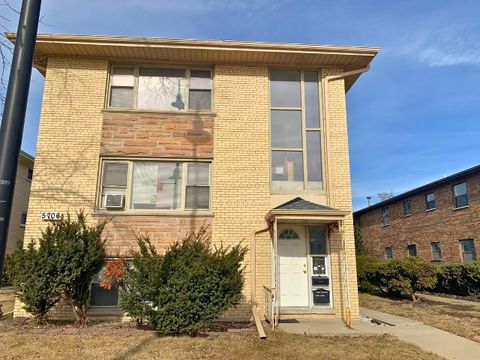
Active
$499,999
7
bds
|
3
ba
|
0
sqft
|
built
1962
5706 Saint Charles Rd, Berkeley, IL 60163
$-2,237
Cash flow
-23.3%
Cash-on-Cash Return
0.3%
Cap rate
0.4%
Rent to Value Ratio
Active
$580,000
4
bds
|
3
ba
|
2,500
sqft
|
built
1992
4721 S Woodlawn Ave, Chicago, IL 60615
$-1,184
Cash flow
-10.7%
Cash-on-Cash Return
3.2%
Cap rate
0.6%
Rent to Value Ratio
Active
$359,000
3
bds
|
2
ba
|
1,395
sqft
|
built
1922
3255 N Kenneth Ave, Chicago, IL 60641
$-677
Cash flow
-9.8%
Cash-on-Cash Return
3.4%
Cap rate
0.6%
Rent to Value Ratio
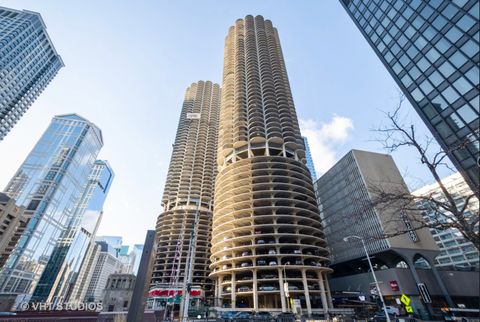
Active
$340,000
1
bds
|
1
ba
|
0
sqft
|
built
1962
300 N State St, Chicago, IL 60654
$-1,109
Cash flow
-17.0%
Cash-on-Cash Return
1.8%
Cap rate
0.7%
Rent to Value Ratio
Active
$315,000
3
bds
|
2
ba
|
1,160
sqft
|
built
1928
1451 N Latrobe Ave, Chicago, IL 60651
$-133
Cash flow
-2.2%
Cash-on-Cash Return
5.2%
Cap rate
0.7%
Rent to Value Ratio
Active
$279,900
2
bds
|
2
ba
|
1,280
sqft
|
built
1968
4838 Howard St, Skokie, IL 60077
$-303
Cash flow
-5.6%
Cash-on-Cash Return
4.4%
Cap rate
0.7%
Rent to Value Ratio
Active
$134,900
2
bds
|
2
ba
|
1,000
sqft
|
built
1974
900 W Sunset Dr, Glenwood, IL 60425
$267
Cash flow
10.3%
Cash-on-Cash Return
8.1%
Cap rate
1.5%
Rent to Value Ratio
Active
$175,000
2
bds
|
2
ba
|
1,000
sqft
|
built
1978
9960 Franchesca Ct, Orland Park, IL 60462
$-204
Cash flow
-6.1%
Cash-on-Cash Return
4.3%
Cap rate
1.0%
Rent to Value Ratio
Active
$1,299,000
4
bds
|
5
ba
|
4,460
sqft
|
built
2007
33 W Ontario St, Chicago, IL 60654
$-6,966
Cash flow
-28.0%
Cash-on-Cash Return
-0.8%
Cap rate
0.7%
Rent to Value Ratio
Active
$193,900
9
bds
|
4
ba
|
0
sqft
|
built
1925
10230 S Yates Blvd, Chicago, IL 60617
$-335
Cash flow
-9.0%
Cash-on-Cash Return
3.6%
Cap rate
0.6%
Rent to Value Ratio
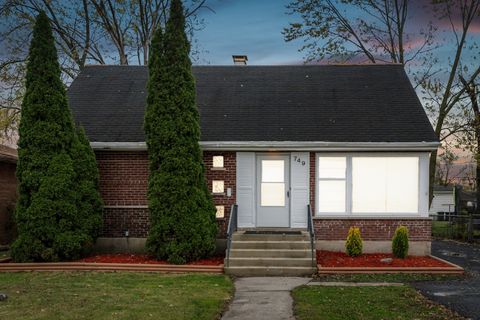
Active
$239,900
4
bds
|
2
ba
|
1,142
sqft
|
built
1950
749 E 154th St, South Holland, IL 60473
$489
Cash flow
10.6%
Cash-on-Cash Return
8.1%
Cap rate
1.3%
Rent to Value Ratio