Cook County Investment Properties for Sale
Browse homes for sale and investment properties in Cook County. Refine your search by price, property type, or more.
Best cash flowing properties in Cook County
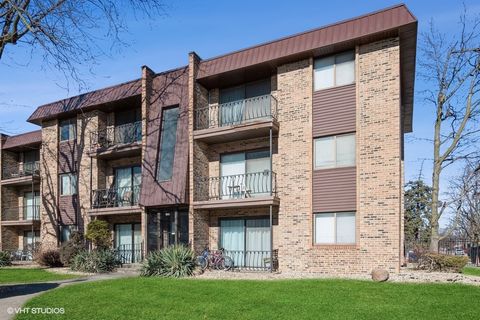
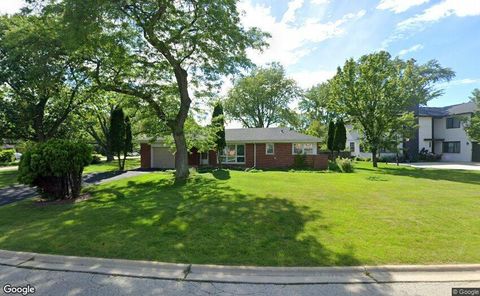
Active
$69,900
1
bds
|
1
ba
|
750
sqft
|
built
1961
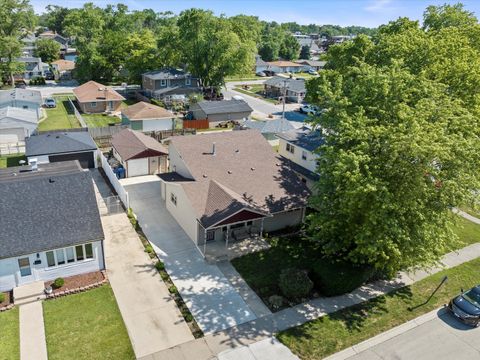
17963 Huntleigh Ct, Country Club Hills, IL 60478
$907
Cash flow
15.1%
Cash-on-Cash Return
15.6%
Cap rate
2.6%
Rent to Value Ratio
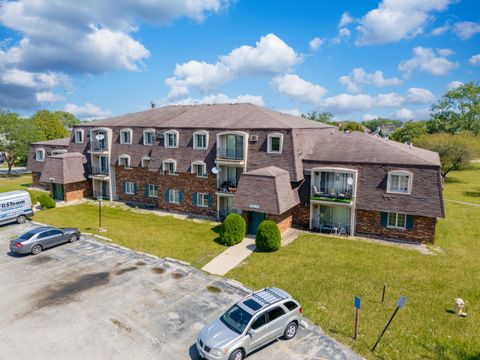
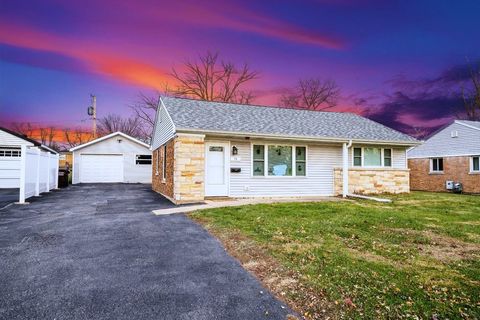
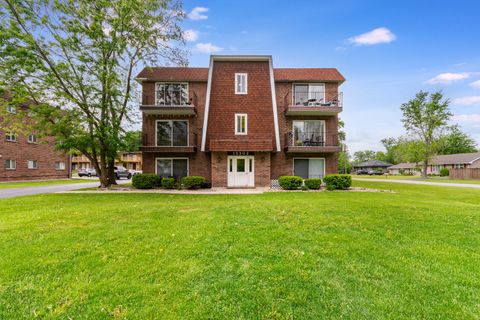
Active
$73,000
2
bds
|
1
ba
|
950
sqft
|
built
1977
3026 Bernice Rd, Lansing, IL 60438
$619
Cash flow
9.9%
Cash-on-Cash Return
10.2%
Cap rate
1.9%
Rent to Value Ratio
5,191 out of 6,012 properties for sale in Cook County
Limited Results Shown
Create a free account, or log in to reveal all property listings and enjoy the complete experience.
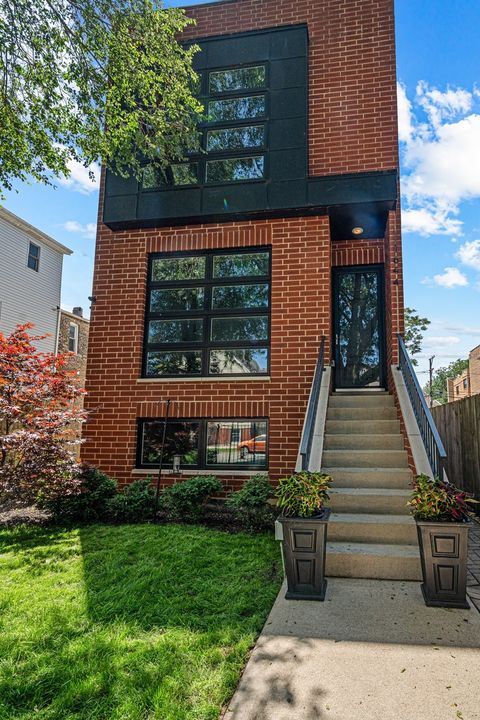
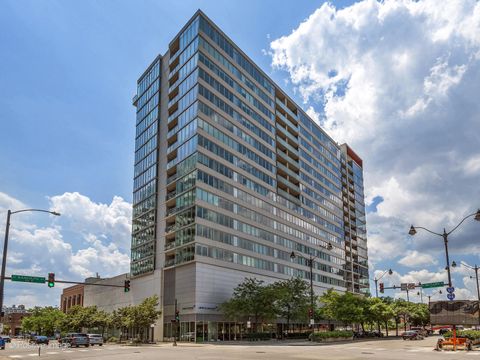
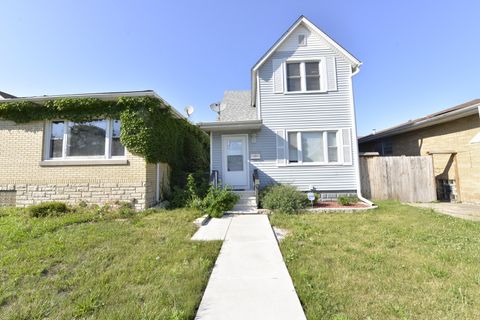
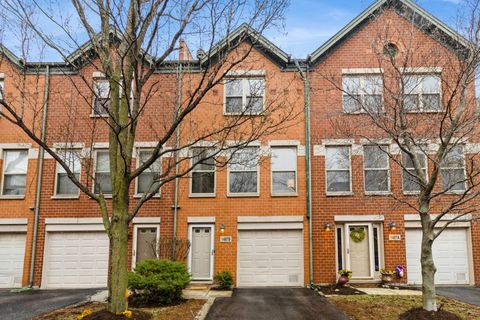
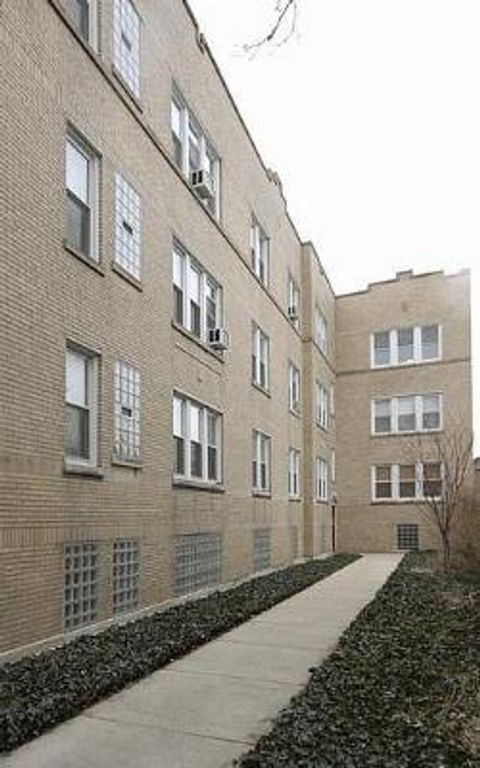
Active
$1,100,000
4
bds
|
4
ba
|
3,200
sqft
|
built
2013
1644 N Washtenaw Ave, Chicago, IL 60647
$-2,267
Cash flow
-10.8%
Cash-on-Cash Return
3.2%
Cap rate
0.5%
Rent to Value Ratio
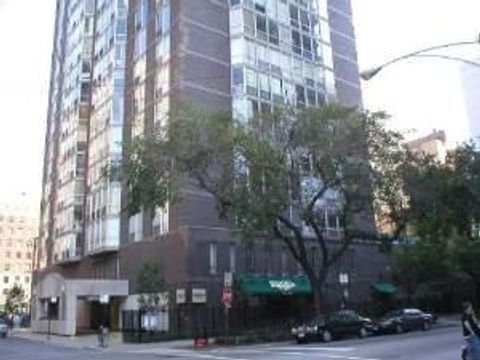
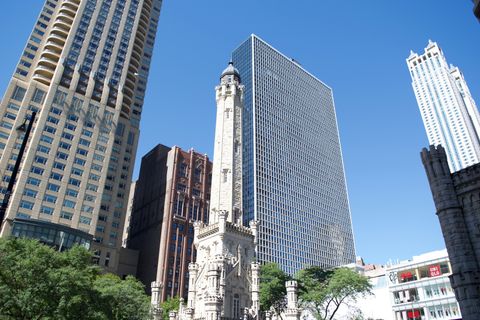
Active
$154,495
bds
|
1
ba
|
0
sqft
|
built
1960
21 W Goethe St, Chicago, IL 60610
$-483
Cash flow
-16.3%
Cash-on-Cash Return
1.9%
Cap rate
1.2%
Rent to Value Ratio
Active
$647,000
2
bds
|
3
ba
|
1,284
sqft
|
built
1956
1430 Evergreen Ter, Glenview, IL 60025
$-1,301
Cash flow
-10.5%
Cash-on-Cash Return
3.3%
Cap rate
0.6%
Rent to Value Ratio
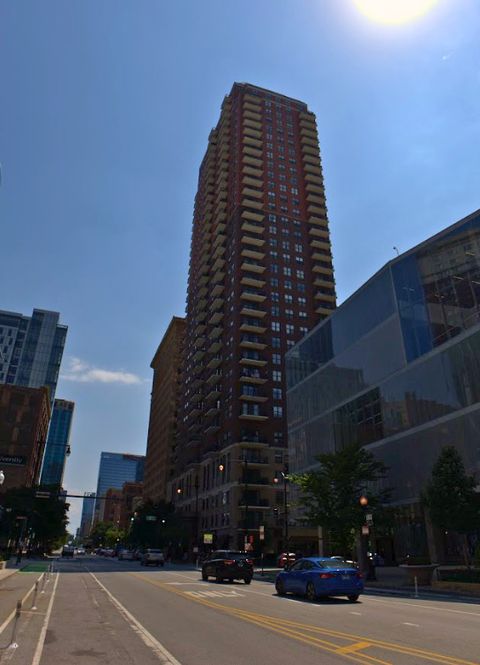
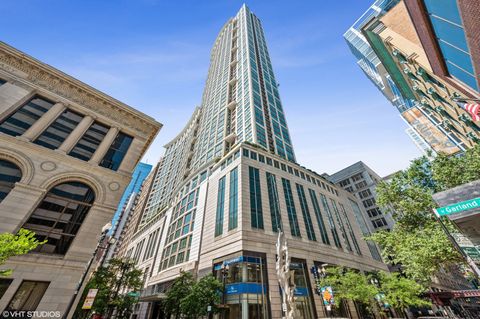
Active
$675,000
3
bds
|
3
ba
|
0
sqft
|
built
2008
659 W Randolph St, Chicago, IL 60661
$-1,694
Cash flow
-13.1%
Cash-on-Cash Return
2.7%
Cap rate
0.8%
Rent to Value Ratio
Active
$169,900
2
bds
|
1
ba
|
1,249
sqft
|
built
1951
74 Marquette St, Park Forest, IL 60466
$-278
Cash flow
-8.5%
Cash-on-Cash Return
3.7%
Cap rate
1.3%
Rent to Value Ratio
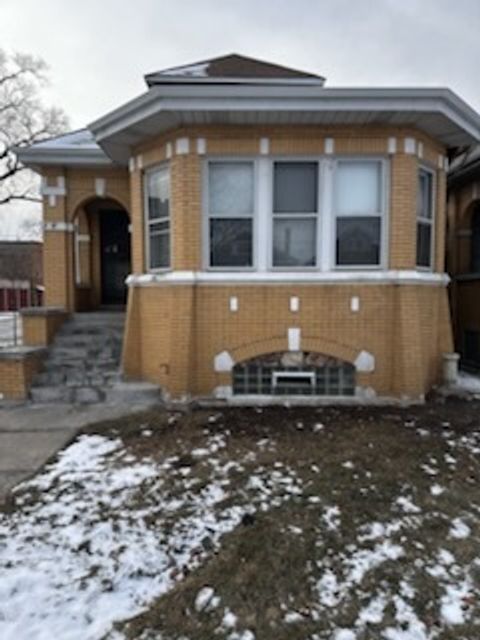
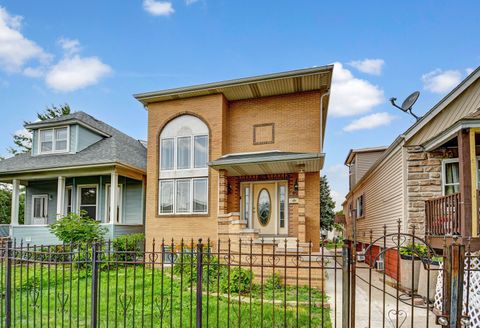
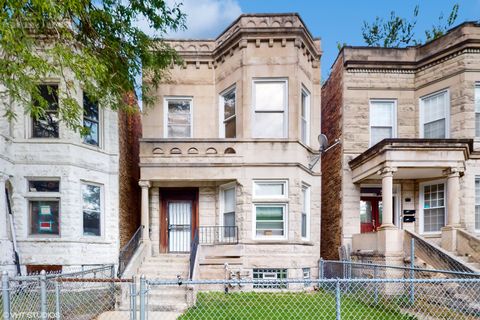
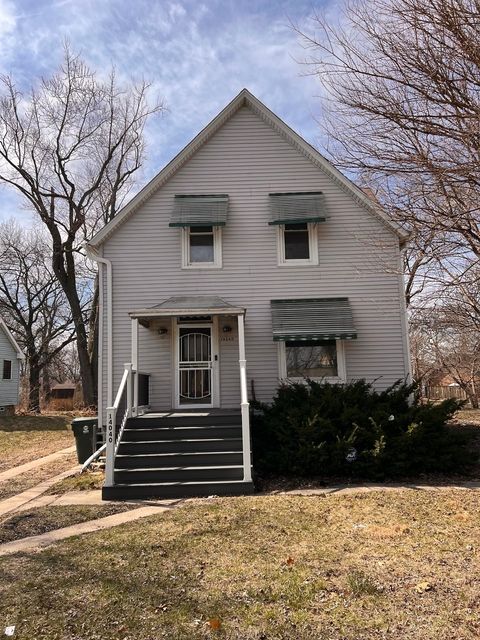
Active
$180,987
4
bds
|
2
ba
|
1,998
sqft
|
built
1932
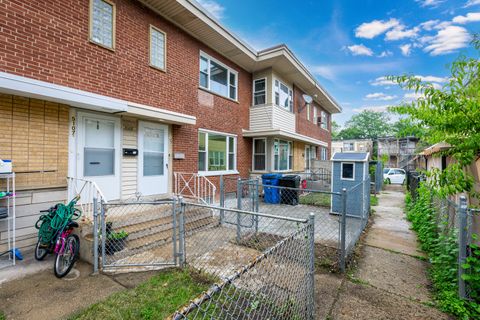
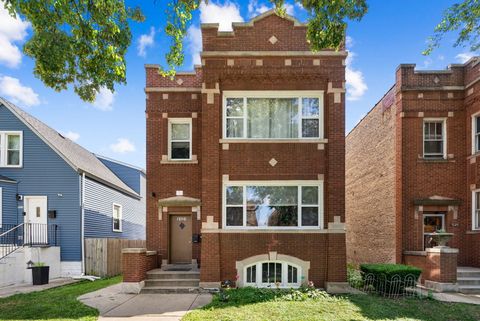
7156 S Artesian Ave, Chicago, IL 60629
$374
Cash flow
10.8%
Cash-on-Cash Return
8.2%
Cap rate
1.1%
Rent to Value Ratio
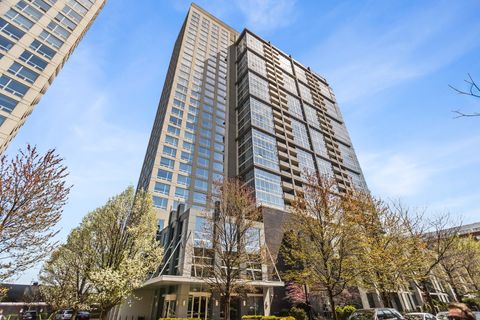
Active
$439,900
2
bds
|
2
ba
|
1,206
sqft
|
built
2003
41 E 8th St, Chicago, IL 60605
$-2,457
Cash flow
-29.1%
Cash-on-Cash Return
-1.0%
Cap rate
0.4%
Rent to Value Ratio
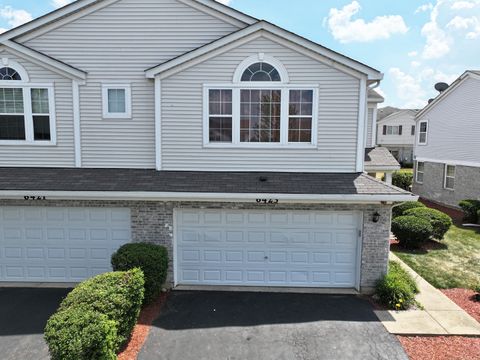
Active
$264,990
3
bds
|
3
ba
|
1,900
sqft
|
built
2007
6423 Gray Hawk Dr, Matteson, IL 60443
$-331
Cash flow
-6.5%
Cash-on-Cash Return
4.2%
Cap rate
0.9%
Rent to Value Ratio
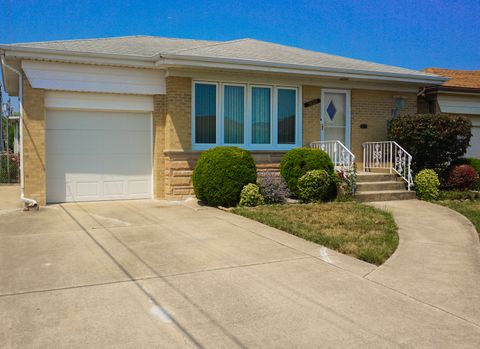
Active
$444,000
3
bds
|
2
ba
|
1,263
sqft
|
built
1962
7632 W Norridge St, Norridge, IL 60706
$-642
Cash flow
-7.5%
Cash-on-Cash Return
3.9%
Cap rate
0.7%
Rent to Value Ratio
Active
$219,000
2
bds
|
2
ba
|
1,000
sqft
|
built
1981
3256 Sanders Rd, Northbrook, IL 60062
$-227
Cash flow
-5.4%
Cash-on-Cash Return
4.4%
Cap rate
0.9%
Rent to Value Ratio
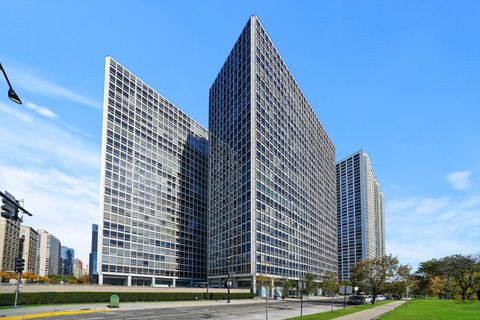
Active
$835,000
2
bds
|
2
ba
|
1,425
sqft
|
built
1974
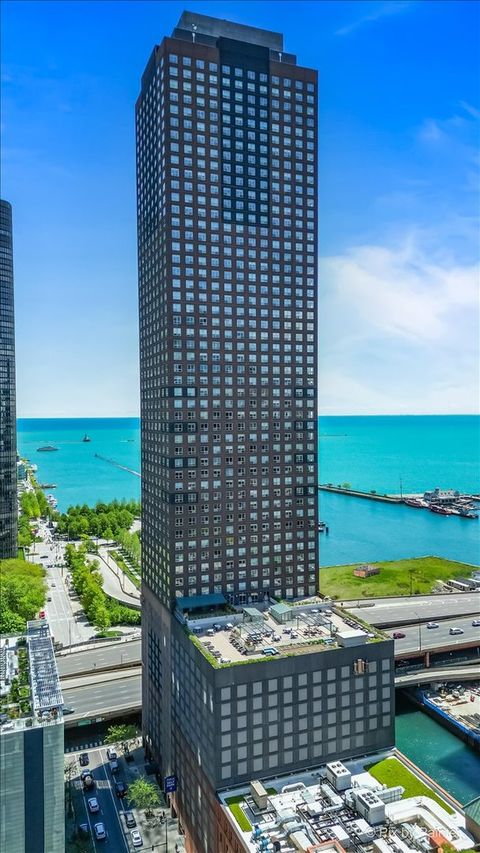
1300 N Lake Shore Dr, Chicago, IL 60610
$-2,741
Cash flow
-17.1%
Cash-on-Cash Return
1.7%
Cap rate
0.8%
Rent to Value Ratio
Active
$349,873
3
bds
|
3
ba
|
2,686
sqft
|
built
2004
6238 S Kolmar Ave, Chicago, IL 60629
$-880
Cash flow
-13.1%
Cash-on-Cash Return
2.7%
Cap rate
0.5%
Rent to Value Ratio
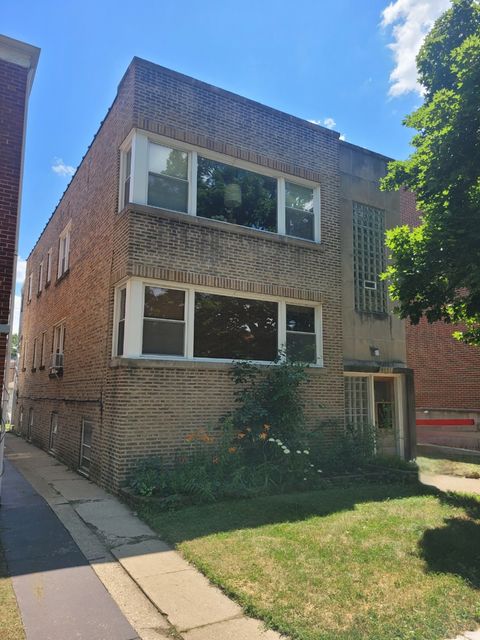
Active
$619,000
4
bds
|
5
ba
|
0
sqft
|
built
1953
2521 W Farragut Ave, Chicago, IL 60625
$-2,032
Cash flow
-17.1%
Cash-on-Cash Return
1.7%
Cap rate
0.4%
Rent to Value Ratio
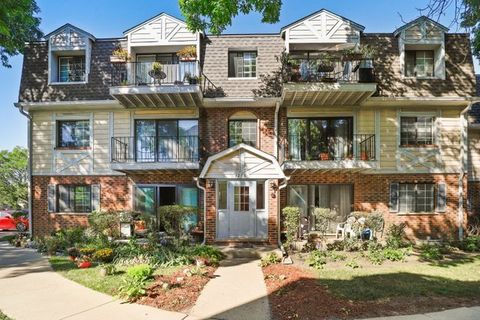
Active
$429,900
2
bds
|
2
ba
|
1,157
sqft
|
built
1957
330 W Diversey Pkwy, Chicago, IL 60657
$-1,007
Cash flow
-12.2%
Cash-on-Cash Return
2.9%
Cap rate
0.9%
Rent to Value Ratio
Active
$349,900
2
bds
|
2
ba
|
1,500
sqft
|
built
1958
5107 N Springfield Ave, Chicago, IL 60625
$-399
Cash flow
-5.9%
Cash-on-Cash Return
4.3%
Cap rate
0.7%
Rent to Value Ratio
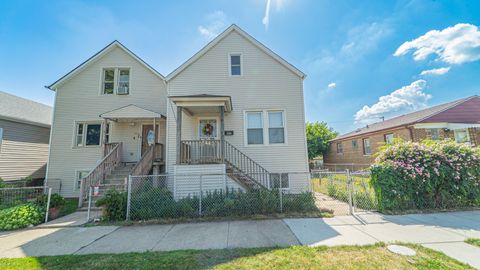
Active
$279,900
4
bds
|
2
ba
|
0
sqft
|
built
1884
3654 E 97th St, Chicago, IL 60617
$-137
Cash flow
-2.6%
Cash-on-Cash Return
5.1%
Cap rate
0.7%
Rent to Value Ratio
Active
$589,000
3
bds
|
2
ba
|
1,632
sqft
|
built
1998
2514 W Washington Blvd, Chicago, IL 60612
$-790
Cash flow
-7.0%
Cash-on-Cash Return
4.1%
Cap rate
0.6%
Rent to Value Ratio
Active
$279,000
4
bds
|
3
ba
|
2,300
sqft
|
built
1929
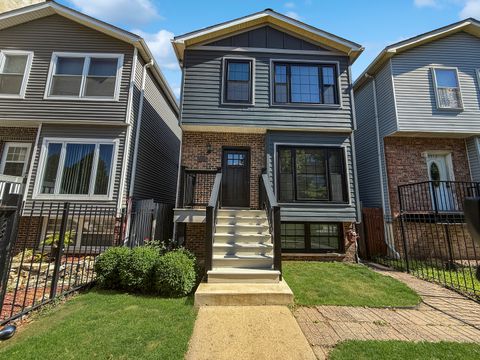
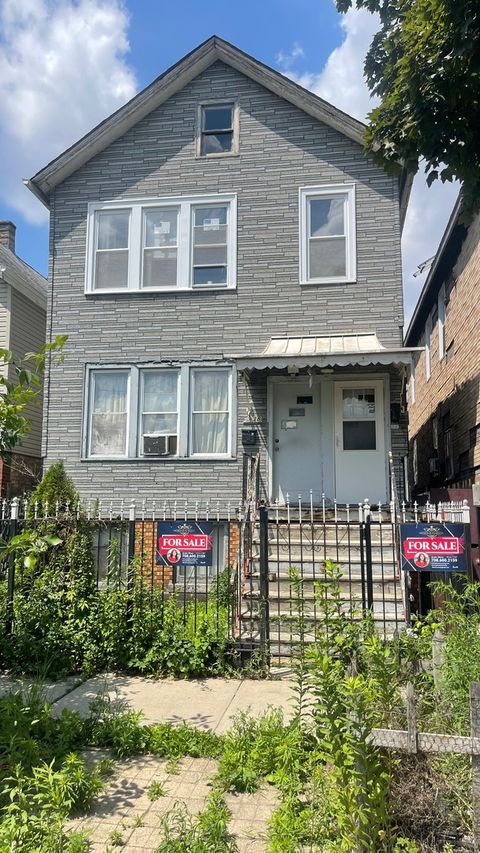
1235 W 96th St, Chicago, IL 60643
$535
Cash flow
10.0%
Cash-on-Cash Return
8.0%
Cap rate
1.1%
Rent to Value Ratio
Active
$94,900
1
bds
|
1
ba
|
0
sqft
|
built
1972
15302 Kenton Ave, Oak Forest, IL 60452
$-19
Cash flow
-1.0%
Cash-on-Cash Return
5.4%
Cap rate
1.4%
Rent to Value Ratio
Active
$184,900
4
bds
|
3
ba
|
1,803
sqft
|
built
1878
422 Sibley Blvd, Calumet City, IL 60409
$146
Cash flow
4.1%
Cash-on-Cash Return
6.6%
Cap rate
1.1%
Rent to Value Ratio
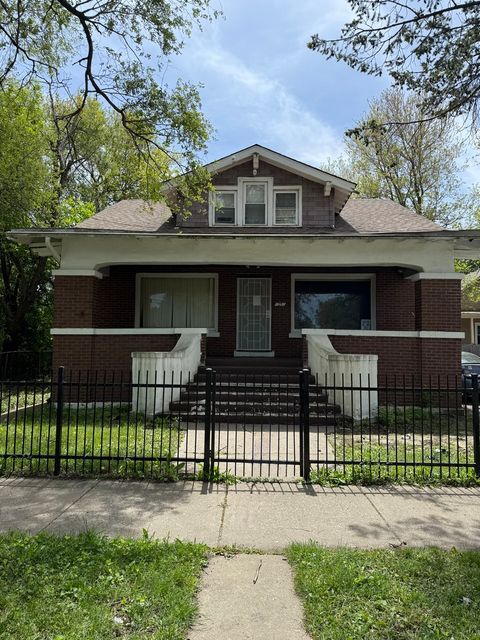
Active
$223,000
4
bds
|
3
ba
|
828
sqft
|
built
1893
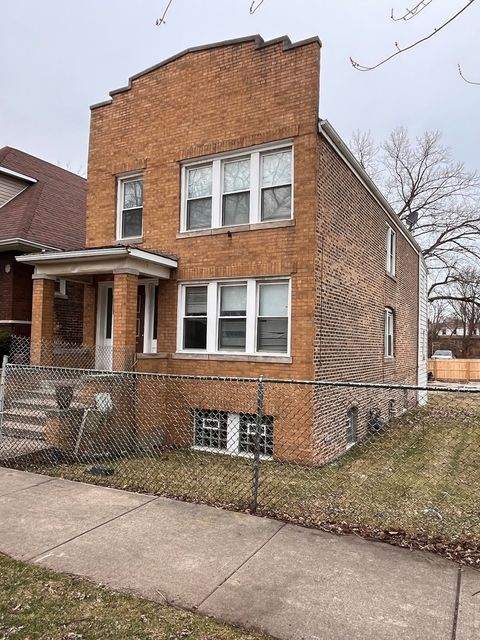
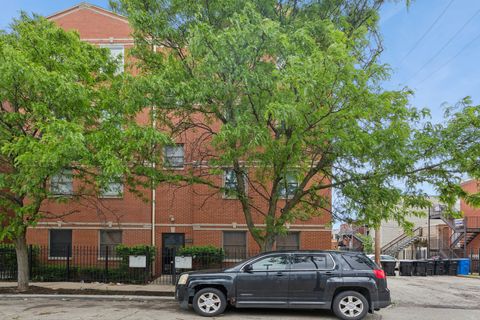
25 W 110th St, Chicago, IL 60628
$497
Cash flow
11.6%
Cash-on-Cash Return
8.4%
Cap rate
1.0%
Rent to Value Ratio
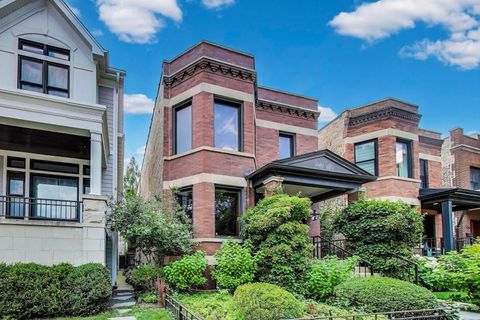
Active
$1,799,000
2
bds
|
4
ba
|
3,330
sqft
|
built
1915
3822 N Claremont Ave, Chicago, IL 60618
$-6,064
Cash flow
-17.6%
Cash-on-Cash Return
1.6%
Cap rate
0.3%
Rent to Value Ratio
Active
$690,900
3
bds
|
3
ba
|
1,422
sqft
|
built
2001
1487 N Clybourn Ave, Chicago, IL 60610
$-1,462
Cash flow
-11.0%
Cash-on-Cash Return
3.1%
Cap rate
0.6%
Rent to Value Ratio
Active
$320,000
7
bds
|
2
ba
|
0
sqft
|
built
1903
6411 S Peoria St, Chicago, IL 60621
$-146
Cash flow
-2.4%
Cash-on-Cash Return
5.1%
Cap rate
0.6%
Rent to Value Ratio
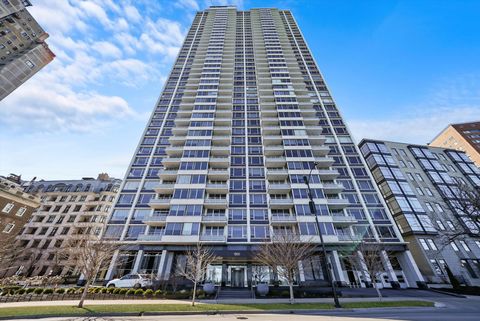
Active
$415,000
1
bds
|
1
ba
|
1,000
sqft
|
built
1972
111 E Chestnut St, Chicago, IL 60611
$-1,242
Cash flow
-15.6%
Cash-on-Cash Return
2.1%
Cap rate
0.7%
Rent to Value Ratio
Active
$229,900
2
bds
|
1
ba
|
1,300
sqft
|
built
1890
10439 S Avenue M, Chicago, IL 60617
$80
Cash flow
1.8%
Cash-on-Cash Return
6.1%
Cap rate
0.8%
Rent to Value Ratio
Active
$250,000
2
bds
|
1
ba
|
1,000
sqft
|
built
1925
3135 W Leland Ave, Chicago, IL 60625
$-782
Cash flow
-16.3%
Cash-on-Cash Return
1.9%
Cap rate
0.6%
Rent to Value Ratio
Active
$515,000
2
bds
|
2
ba
|
1,100
sqft
|
built
2005
130 N Garland Ct, Chicago, IL 60602
$-1,760
Cash flow
-17.8%
Cash-on-Cash Return
1.6%
Cap rate
0.6%
Rent to Value Ratio
Active
$415,000
2
bds
|
2
ba
|
1,070
sqft
|
built
2007
1901 S Calumet Ave, Chicago, IL 60616
$-1,328
Cash flow
-16.7%
Cash-on-Cash Return
1.8%
Cap rate
0.8%
Rent to Value Ratio
Active
$290,000
4
bds
|
2
ba
|
0
sqft
|
built
1888
14040 Lincoln Ave, Dolton, IL 60419
$-716
Cash flow
-12.9%
Cash-on-Cash Return
2.7%
Cap rate
0.6%
Rent to Value Ratio
Active
$599,000
4
bds
|
3
ba
|
0
sqft
|
built
1928
5121 W Henderson St, Chicago, IL 60641
$-1,666
Cash flow
-14.5%
Cash-on-Cash Return
2.3%
Cap rate
0.4%
Rent to Value Ratio
Active
$215,000
5
bds
|
3
ba
|
0
sqft
|
built
1883
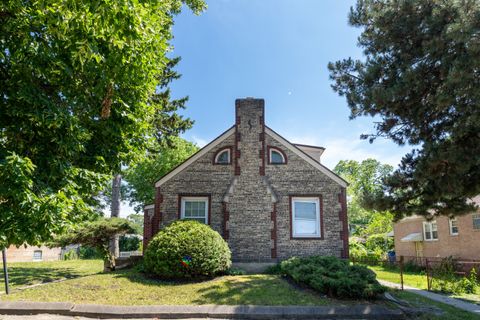
4838 S Bishop St, Chicago, IL 60609
$342
Cash flow
8.3%
Cash-on-Cash Return
7.6%
Cap rate
1.0%
Rent to Value Ratio
Active
$175,000
3
bds
|
1
ba
|
1,035
sqft
|
built
1955
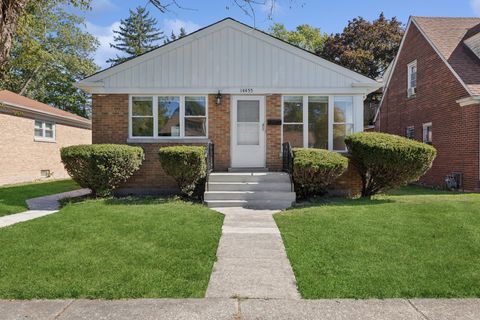
14455 Des Plaines St, Harvey, IL 60426
$62
Cash flow
1.8%
Cash-on-Cash Return
6.1%
Cap rate
1.1%
Rent to Value Ratio
Active
$272,000
3
bds
|
2
ba
|
0
sqft
|
built
2002
519 S Maplewood Ave, Chicago, IL 60612
$-258
Cash flow
-4.9%
Cash-on-Cash Return
4.5%
Cap rate
0.8%
Rent to Value Ratio
Active
$280,000
1
bds
|
1
ba
|
0
sqft
|
built
1991
474 N Lake Shore Dr, Chicago, IL 60611
$-769
Cash flow
-14.3%
Cash-on-Cash Return
2.4%
Cap rate
0.9%
Rent to Value Ratio
Active
$138,500
1
bds
|
1
ba
|
600
sqft
|
built
1970
1227 S Harlem Ave, Berwyn, IL 60402
$-210
Cash flow
-7.9%
Cash-on-Cash Return
3.9%
Cap rate
0.9%
Rent to Value Ratio
Active
$360,000
4
bds
|
2
ba
|
1,728
sqft
|
built
1955
7306 W 115th St, Worth, IL 60482
$-468
Cash flow
-6.8%
Cash-on-Cash Return
4.1%
Cap rate
0.7%
Rent to Value Ratio

Active
$325,000
2
bds
|
2
ba
|
1,165
sqft
|
built
1925
6326 W Berenice Ave, Chicago, IL 60634
$57
Cash flow
0.9%
Cash-on-Cash Return
5.9%
Cap rate
0.9%
Rent to Value Ratio