Cook County Investment Properties for Sale
Browse homes for sale and investment properties in Cook County. Refine your search by price, property type, or more.
Best cash flowing properties in Cook County
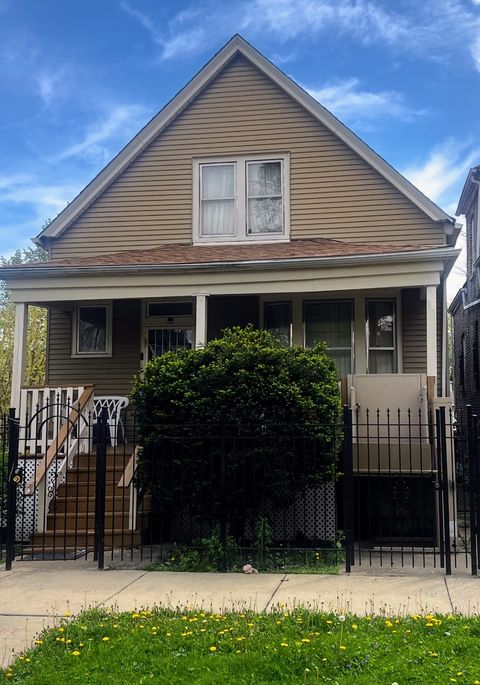
Active
$109,900
3
bds
|
2
ba
|
3,321
sqft
|
built
1908
6427 S Winchester Ave, Chicago, IL 60636
$722
Cash flow
34.3%
Cash-on-Cash Return
13.6%
Cap rate
1.6%
Rent to Value Ratio
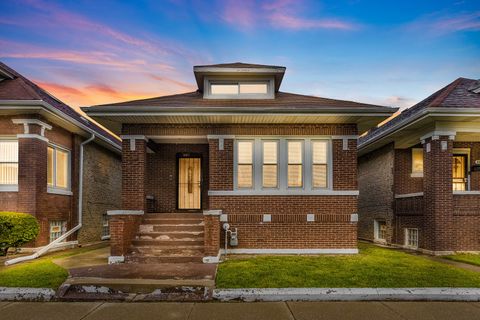
Active
$185,000
4
bds
|
1
ba
|
1,250
sqft
|
built
1920
8011 S Ada St, Chicago, IL 60620
$586
Cash flow
16.5%
Cash-on-Cash Return
9.5%
Cap rate
1.4%
Rent to Value Ratio
4,404 out of 5,134 properties for sale in Cook County
Limited Results Shown
Create a free account, or log in to reveal all property listings and enjoy the complete experience.
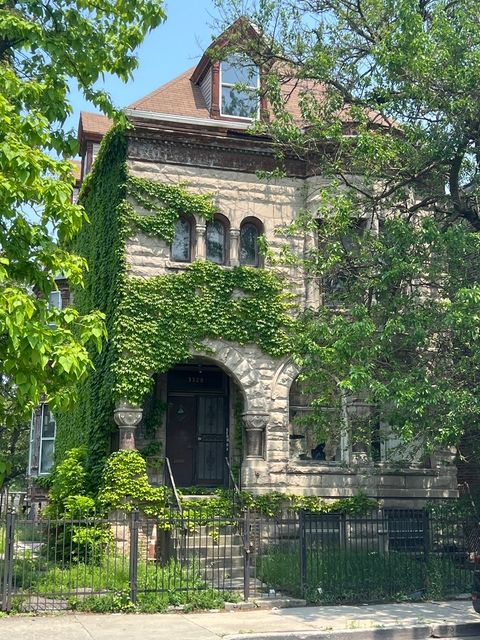
Active
$550,000
5
bds
|
2
ba
|
3,248
sqft
|
built
1888
3328 W Warren Blvd, Chicago, IL 60624
$-801
Cash flow
-7.6%
Cash-on-Cash Return
3.9%
Cap rate
0.6%
Rent to Value Ratio
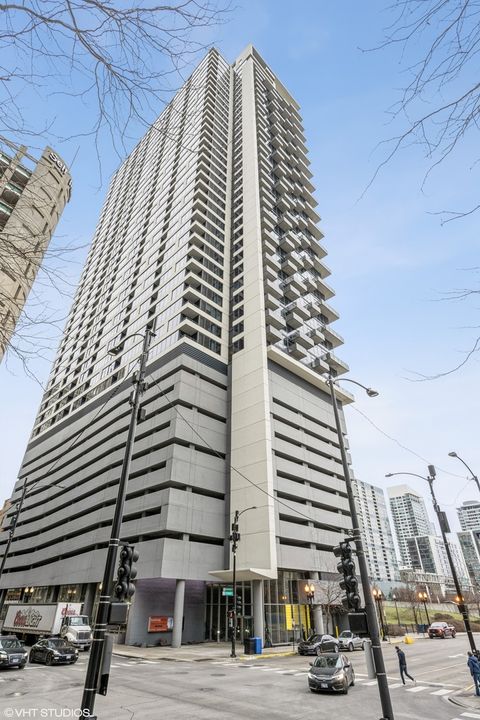
Active
$360,000
2
bds
|
2
ba
|
1,083
sqft
|
built
2009
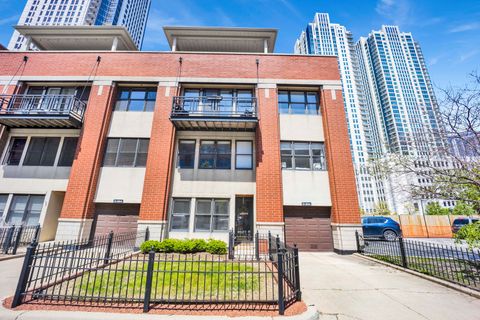
235 W Van Buren St, Chicago, IL 60607
$-1,039
Cash flow
-15.1%
Cash-on-Cash Return
2.2%
Cap rate
0.7%
Rent to Value Ratio

Active
$219,900
3
bds
|
1
ba
|
1,256
sqft
|
built
1949
9019 S Justine St, Chicago, IL 60620
$92
Cash flow
2.2%
Cash-on-Cash Return
6.2%
Cap rate
0.9%
Rent to Value Ratio
Active
$221,000
3
bds
|
2
ba
|
1,252
sqft
|
built
1967
605 Hoxie Ave, Calumet City, IL 60409
$-84
Cash flow
-2.0%
Cash-on-Cash Return
5.2%
Cap rate
1.0%
Rent to Value Ratio
Active
$2,995,000
4
bds
|
5
ba
|
5,200
sqft
|
built
2000
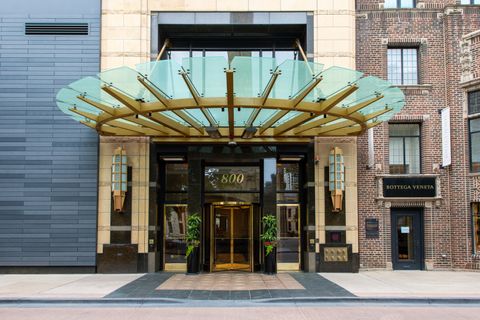
800 N Michigan Ave, Chicago, IL 60611
$-19,017
Cash flow
-33.1%
Cash-on-Cash Return
-1.9%
Cap rate
0.3%
Rent to Value Ratio
Active
$360,000
3
bds
|
2
ba
|
1,466
sqft
|
built
1962
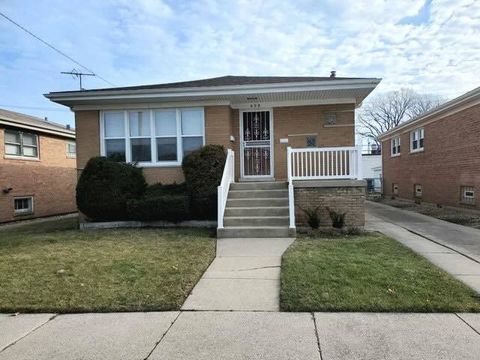
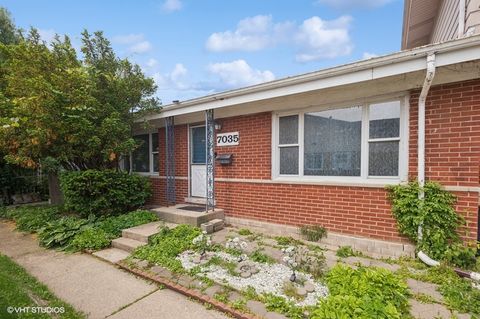
7035 W Greenleaf St, Niles, IL 60714
$-386
Cash flow
-5.6%
Cash-on-Cash Return
4.4%
Cap rate
0.7%
Rent to Value Ratio
Active
$420,000
4
bds
|
3
ba
|
3,000
sqft
|
built
1920
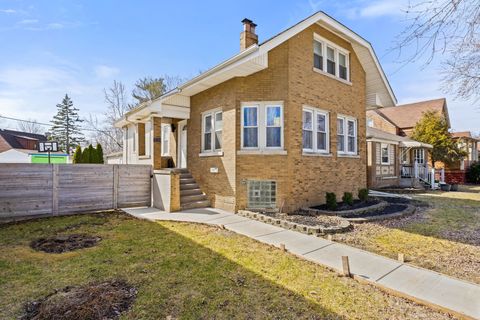
7427 S Bennett Ave, Chicago, IL 60649
$125
Cash flow
1.6%
Cash-on-Cash Return
6.0%
Cap rate
0.9%
Rent to Value Ratio
Active
$575,000
4
bds
|
3
ba
|
2,934
sqft
|
built
1973
1288 N Ashland Ave, Palatine, IL 60074
$-1,385
Cash flow
-12.6%
Cash-on-Cash Return
2.8%
Cap rate
0.5%
Rent to Value Ratio
Active
$2,495,000
6
bds
|
10
ba
|
0
sqft
|
built
1997
1877 Banbury Rd, Inverness, IL 60067
$-8,185
Cash flow
-17.1%
Cash-on-Cash Return
1.7%
Cap rate
0.3%
Rent to Value Ratio
Active
$125,000
2
bds
|
1
ba
|
840
sqft
|
built
1922
14807 Paulina St, Harvey, IL 60426
$475
Cash flow
19.8%
Cash-on-Cash Return
10.2%
Cap rate
1.6%
Rent to Value Ratio
Active
$2,500,000
3
bds
|
7
ba
|
7,956
sqft
|
built
2001
11315 77th St, Burr Ridge, IL 60527
$-6,894
Cash flow
-14.4%
Cash-on-Cash Return
2.4%
Cap rate
0.4%
Rent to Value Ratio
Active
$573,000
5
bds
|
3
ba
|
2,486
sqft
|
built
1927
3336 Grand Blvd, Brookfield, IL 60513
$-1,239
Cash flow
-11.3%
Cash-on-Cash Return
3.1%
Cap rate
0.6%
Rent to Value Ratio
Active
$449,900
2
bds
|
1
ba
|
0
sqft
|
built
1970
1560 N Sandburg Ter, Chicago, IL 60610
$-812
Cash flow
-9.4%
Cash-on-Cash Return
3.5%
Cap rate
0.8%
Rent to Value Ratio
Active
$3,500,000
5
bds
|
7
ba
|
6,500
sqft
|
built
1885
34 E Bellevue Pl, Chicago, IL 60611
$-16,481
Cash flow
-24.6%
Cash-on-Cash Return
0.0%
Cap rate
0.3%
Rent to Value Ratio
Active
$669,000
2
bds
|
3
ba
|
1,512
sqft
|
built
2004
737 W Washington Blvd, Chicago, IL 60661
$-2,468
Cash flow
-19.2%
Cash-on-Cash Return
1.3%
Cap rate
0.7%
Rent to Value Ratio
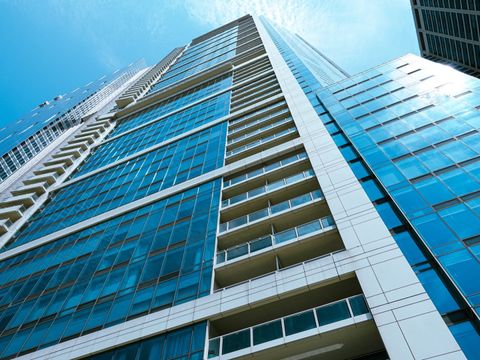
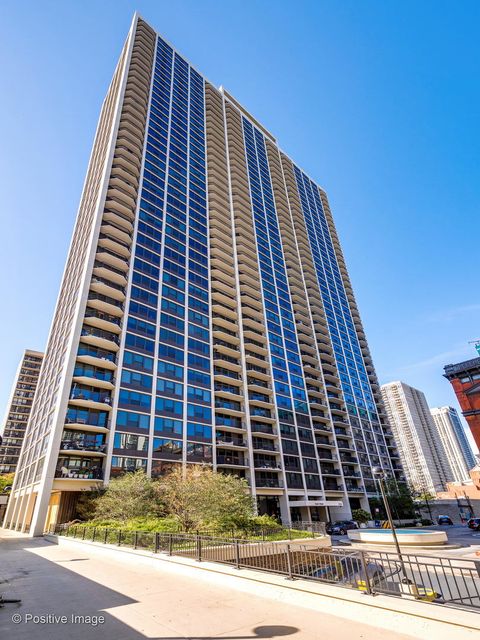
Active
$565,000
1
bds
|
2
ba
|
1,244
sqft
|
built
2007
340 E Randolph St, Chicago, IL 60601
$-1,808
Cash flow
-16.7%
Cash-on-Cash Return
1.8%
Cap rate
0.7%
Rent to Value Ratio
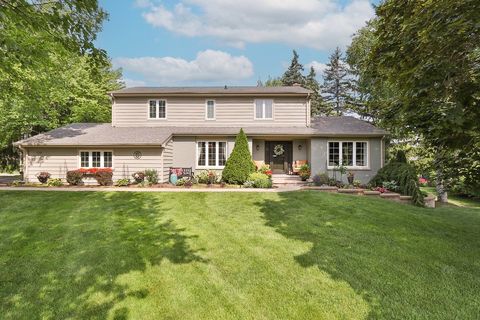
Active
$675,000
4
bds
|
3
ba
|
2,537
sqft
|
built
1978
110 Tudor Dr, Barrington, IL 60010
$-1,431
Cash flow
-11.1%
Cash-on-Cash Return
3.1%
Cap rate
0.5%
Rent to Value Ratio
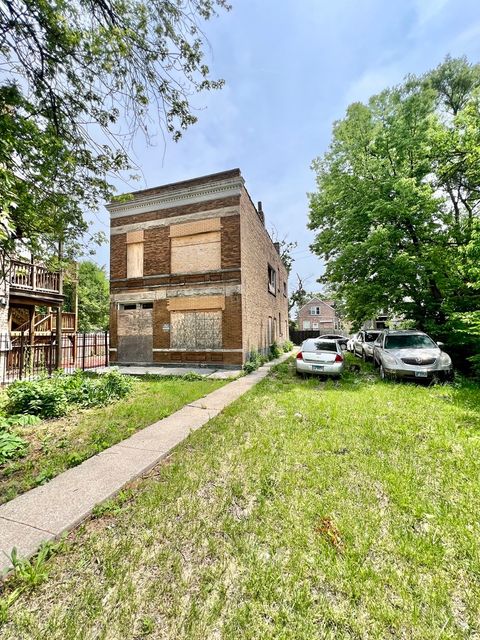
Active
$84,900
4
bds
|
2
ba
|
0
sqft
|
built
1902
1539 S Harding Ave, Chicago, IL 60623
$353
Cash flow
21.7%
Cash-on-Cash Return
10.7%
Cap rate
1.6%
Rent to Value Ratio
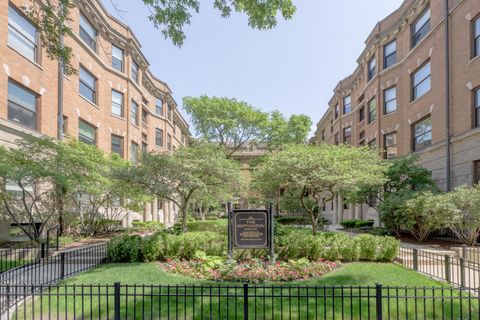
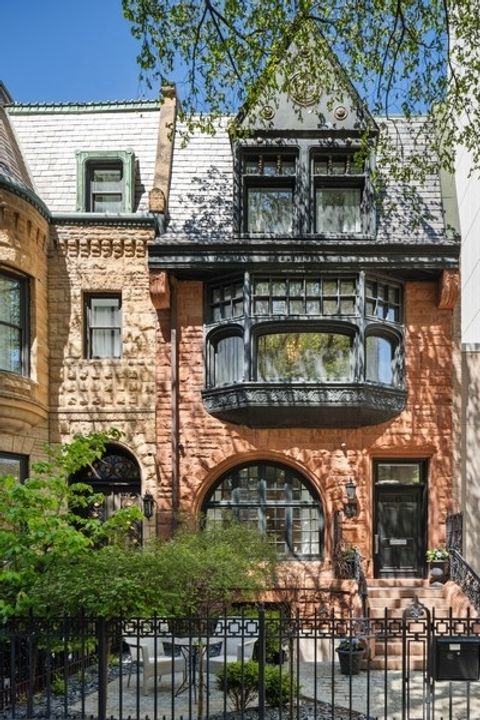
Active
$430,000
4
bds
|
3
ba
|
2,400
sqft
|
built
1904
668 W Irving Park Rd, Chicago, IL 60613
$-2,231
Cash flow
-27.1%
Cash-on-Cash Return
-0.5%
Cap rate
0.7%
Rent to Value Ratio
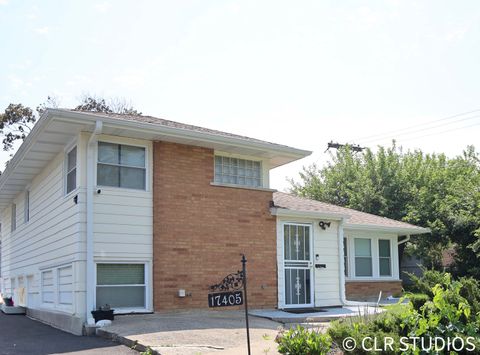
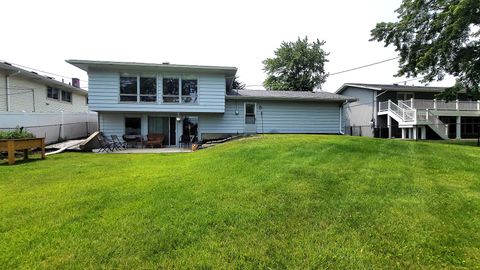
Active
$206,000
2
bds
|
2
ba
|
1,468
sqft
|
built
1956
17405 Longfellow Ave, Hazel Crest, IL 60429
$80
Cash flow
2.0%
Cash-on-Cash Return
6.1%
Cap rate
1.2%
Rent to Value Ratio
Active
$510,000
4
bds
|
3
ba
|
2,200
sqft
|
built
1966
1360 Devonshire Ln, Hoffman Estates, IL 60169
$-1,179
Cash flow
-12.1%
Cash-on-Cash Return
2.9%
Cap rate
0.6%
Rent to Value Ratio
Active
$135,000
2
bds
|
2
ba
|
1,123
sqft
|
built
1968
9740 S Pulaski Rd, Oak Lawn, IL 60453
$48
Cash flow
1.9%
Cash-on-Cash Return
6.1%
Cap rate
1.3%
Rent to Value Ratio
Active
$524,900
2
bds
|
2
ba
|
1,460
sqft
|
built
2008
8 E Randolph St, Chicago, IL 60601
$-1,962
Cash flow
-19.5%
Cash-on-Cash Return
1.2%
Cap rate
0.7%
Rent to Value Ratio
Active
$279,900
4
bds
|
2
ba
|
2,404
sqft
|
built
1947
9303 W 119th St, Palos Park, IL 60464
$194
Cash flow
3.6%
Cash-on-Cash Return
6.5%
Cap rate
1.1%
Rent to Value Ratio
Active
$209,990
bds
|
1
ba
|
642
sqft
|
built
1991
474 N Lake Shore Dr, Chicago, IL 60611
$-628
Cash flow
-15.6%
Cash-on-Cash Return
2.1%
Cap rate
0.9%
Rent to Value Ratio
Active
$200,000
3
bds
|
2
ba
|
1,267
sqft
|
built
1978
14327 Lincoln Ave, Dolton, IL 60419
$84
Cash flow
2.2%
Cash-on-Cash Return
6.2%
Cap rate
1.3%
Rent to Value Ratio
Active
$649,900
3
bds
|
3
ba
|
2,800
sqft
|
built
1977
903 Jarvis Ave, Des Plaines, IL 60018
$-1,800
Cash flow
-14.5%
Cash-on-Cash Return
2.4%
Cap rate
0.4%
Rent to Value Ratio
Active
$829,900
4
bds
|
3
ba
|
0
sqft
|
built
1952
8318 Kilbourn Ave, Skokie, IL 60076
$-2,675
Cash flow
-16.8%
Cash-on-Cash Return
1.8%
Cap rate
0.4%
Rent to Value Ratio
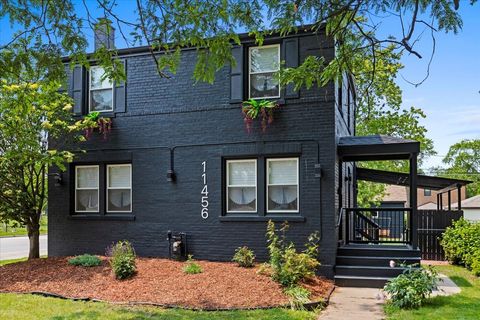
Active
$425,000
4
bds
|
2
ba
|
1,727
sqft
|
built
1942
11456 S Talman Ave, Chicago, IL 60655
$-363
Cash flow
-4.5%
Cash-on-Cash Return
4.7%
Cap rate
0.7%
Rent to Value Ratio
Active
$84,999
2
bds
|
2
ba
|
0
sqft
|
built
1923
18340 Glen Oak Ave, Lansing, IL 60438
$157
Cash flow
9.6%
Cash-on-Cash Return
7.9%
Cap rate
1.6%
Rent to Value Ratio
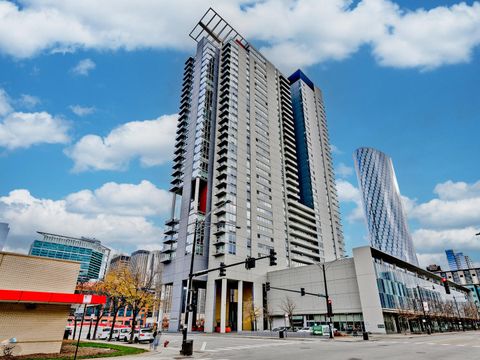
Active
$554,900
3
bds
|
5
ba
|
2,600
sqft
|
built
2012
4355 S Lake Park Ave, Chicago, IL 60653
$-827
Cash flow
-7.8%
Cash-on-Cash Return
3.9%
Cap rate
0.7%
Rent to Value Ratio
Active
$559,900
2
bds
|
3
ba
|
2,244
sqft
|
built
2001
26 Laughry Ln, Palos Park, IL 60464
$-1,545
Cash flow
-14.4%
Cash-on-Cash Return
2.4%
Cap rate
0.6%
Rent to Value Ratio
Active
$355,500
2
bds
|
4
ba
|
1,801
sqft
|
built
1996
18324 Pond View Ct, Tinley Park, IL 60477
$-367
Cash flow
-5.4%
Cash-on-Cash Return
4.4%
Cap rate
0.9%
Rent to Value Ratio
Active
$185,000
2
bds
|
2
ba
|
1,000
sqft
|
built
1977
10210 Washington Ave, Oak Lawn, IL 60453
$34
Cash flow
1.0%
Cash-on-Cash Return
5.9%
Cap rate
1.2%
Rent to Value Ratio
Active
$238,000
1
bds
|
1
ba
|
765
sqft
|
built
1983
10 E Ontario St, Chicago, IL 60611
$-602
Cash flow
-13.2%
Cash-on-Cash Return
2.6%
Cap rate
0.8%
Rent to Value Ratio
Active
$850,000
3
bds
|
3
ba
|
2,600
sqft
|
built
2004
334 N Jefferson St, Chicago, IL 60661
$-1,538
Cash flow
-9.4%
Cash-on-Cash Return
3.5%
Cap rate
0.8%
Rent to Value Ratio
Active
$124,900
3
bds
|
1
ba
|
1,000
sqft
|
built
1952
142 Marquette St, Park Forest, IL 60466
$57
Cash flow
2.4%
Cash-on-Cash Return
6.2%
Cap rate
1.6%
Rent to Value Ratio
Active
$750,000
3
bds
|
2
ba
|
1,345
sqft
|
built
1908
1531 Wilmette Ave, Wilmette, IL 60091
$-1,064
Cash flow
-7.4%
Cash-on-Cash Return
4.0%
Cap rate
0.6%
Rent to Value Ratio