Cook County Investment Properties for Sale
Browse homes for sale and investment properties in Cook County. Refine your search by price, property type, or more.
Best cash flowing properties in Cook County
Active
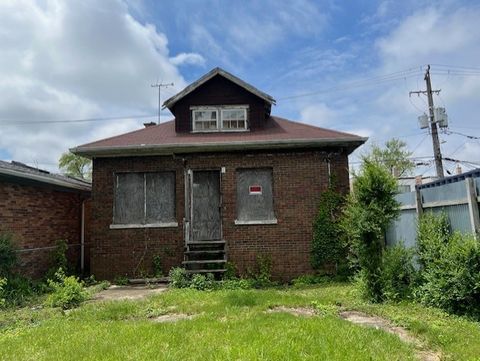
$55,000
3
bds
|
2
ba
|
700
sqft
|
built
1926
8032 S King Dr, Chicago, IL 60619
$963
Cash flow
20.4%
Cash-on-Cash Return
21.0%
Cap rate
2.9%
Rent to Value Ratio
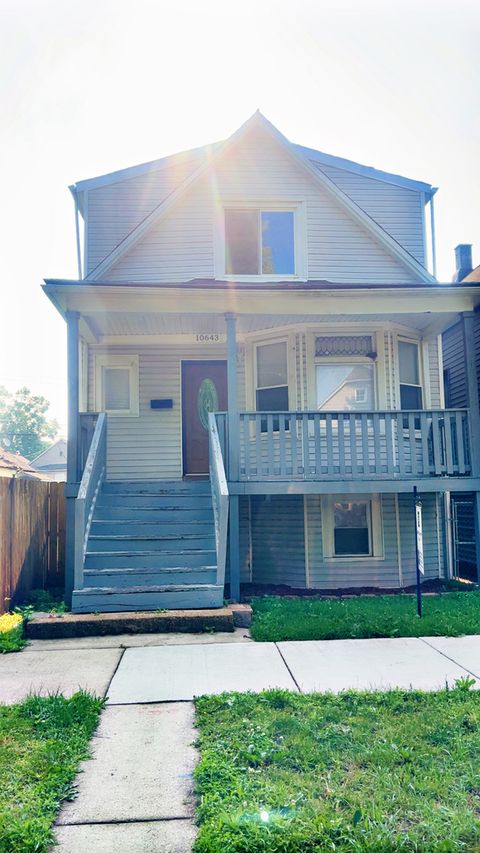
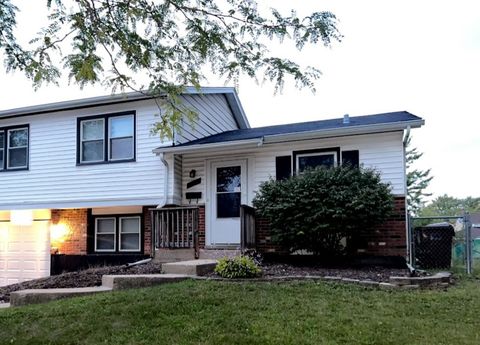
Active
$205,000
6
bds
|
2
ba
|
2,100
sqft
|
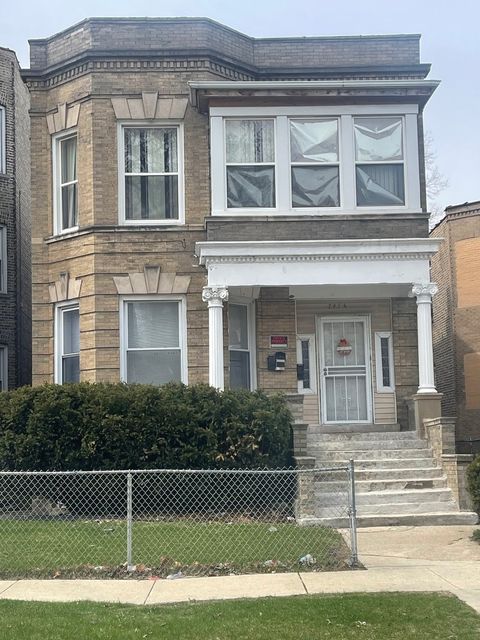
built
1908
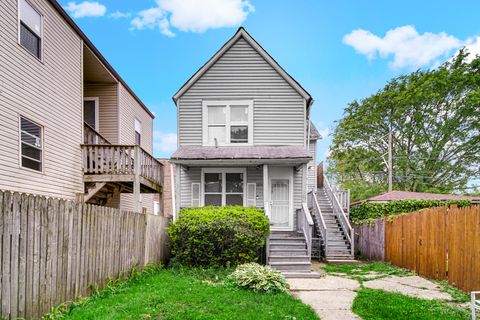
10643 S Calhoun Ave, Chicago, IL 60617
$900
Cash flow
22.9%
Cash-on-Cash Return
10.9%
Cap rate
1.4%
Rent to Value Ratio
4,901 out of 5,689 properties for sale in Cook County
Limited Results Shown
Create a free account, or log in to reveal all property listings and enjoy the complete experience.
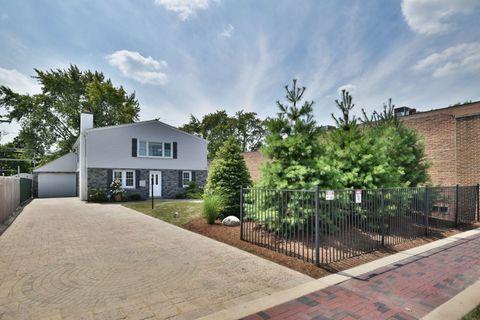
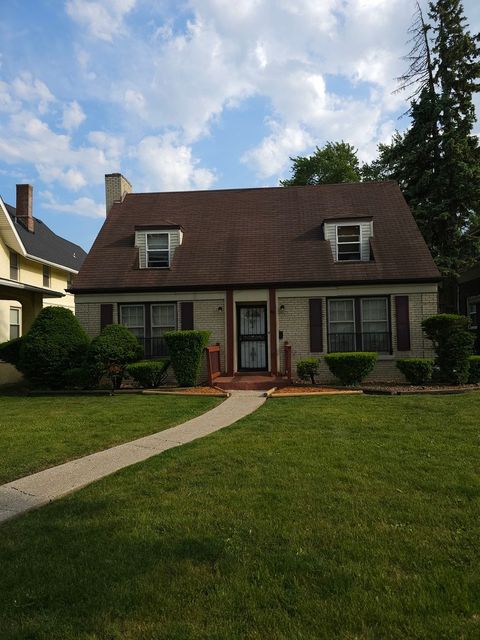
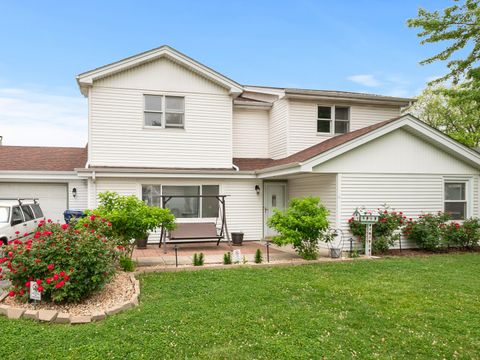
Active
$897,900
6
bds
|
4
ba
|
0
sqft
|
built
1948
8211 Grand Ave, River Grove, IL 60171
$-2,340
Cash flow
-13.6%
Cash-on-Cash Return
2.6%
Cap rate
0.4%
Rent to Value Ratio
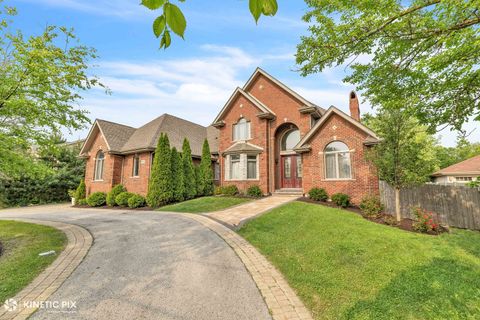
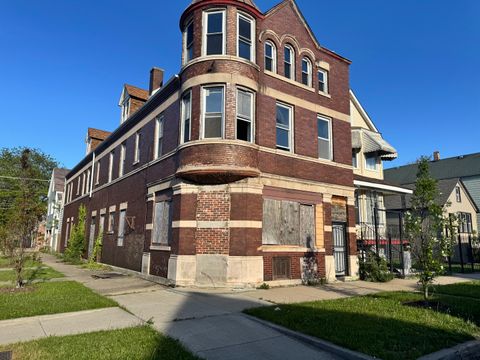
Active
$949,000
5
bds
|
5
ba
|
3,400
sqft
|
built
2008
9937 S 88th Ave, Palos Hills, IL 60465
$-2,772
Cash flow
-15.2%
Cash-on-Cash Return
2.2%
Cap rate
0.5%
Rent to Value Ratio
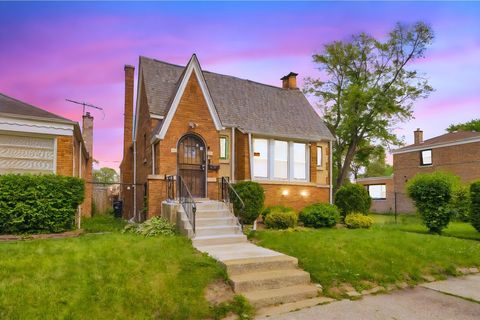
Active
$263,000
4
bds
|
2
ba
|
2,400
sqft
|
built
1973
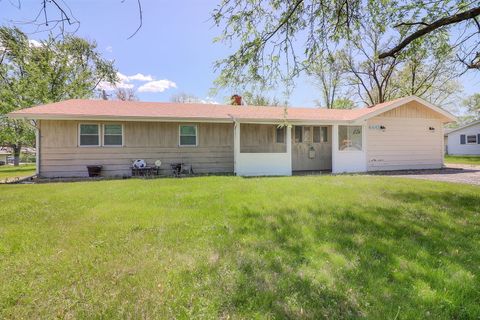
3740 Highland Pl, Country Club Hills, IL 60478
$-177
Cash flow
-3.5%
Cash-on-Cash Return
4.9%
Cap rate
1.0%
Rent to Value Ratio
Active
$144,900
3
bds
|
2
ba
|
1,600
sqft
|
built
1942
46 E 155th St, Harvey, IL 60426
$606
Cash flow
21.8%
Cash-on-Cash Return
10.7%
Cap rate
1.4%
Rent to Value Ratio
Active
$229,000
10
bds
|
5
ba
|
0
sqft
|
built
1912
8401 S Brandon Ave, Chicago, IL 60617
$-536
Cash flow
-12.2%
Cash-on-Cash Return
2.9%
Cap rate
0.5%
Rent to Value Ratio
Active
$240,000
3
bds
|
2
ba
|
1,600
sqft
|
built
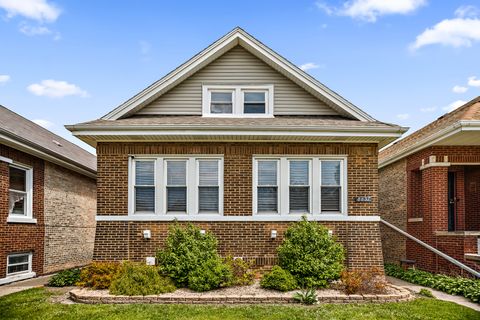
1930
14115 S Wabash Ave, Riverdale, IL 60827
$-40
Cash flow
-0.9%
Cash-on-Cash Return
5.5%
Cap rate
1.0%
Rent to Value Ratio
Active
$299,500
2
bds
|
3
ba
|
1,690
sqft
|
built
2016
192 Owen St, Matteson, IL 60443
$-365
Cash flow
-6.4%
Cash-on-Cash Return
4.2%
Cap rate
0.9%
Rent to Value Ratio
Active
$225,000
3
bds
|
2
ba
|
1,500
sqft
|
built
1957
480 E 163rd St, South Holland, IL 60473
$50
Cash flow
1.2%
Cash-on-Cash Return
5.9%
Cap rate
1.2%
Rent to Value Ratio
Active
$374,900
2
bds
|
2
ba
|
1,086
sqft
|
built
1923
1645 W Ogden Ave, Chicago, IL 60612
$-917
Cash flow
-12.8%
Cash-on-Cash Return
2.7%
Cap rate
0.7%
Rent to Value Ratio
Active
$1,574,000
4
bds
|
3
ba
|
2,977
sqft
|
built
1954
1133 Mayfair Ln, Glencoe, IL 60022
$-4,283
Cash flow
-14.2%
Cash-on-Cash Return
2.4%
Cap rate
0.5%
Rent to Value Ratio
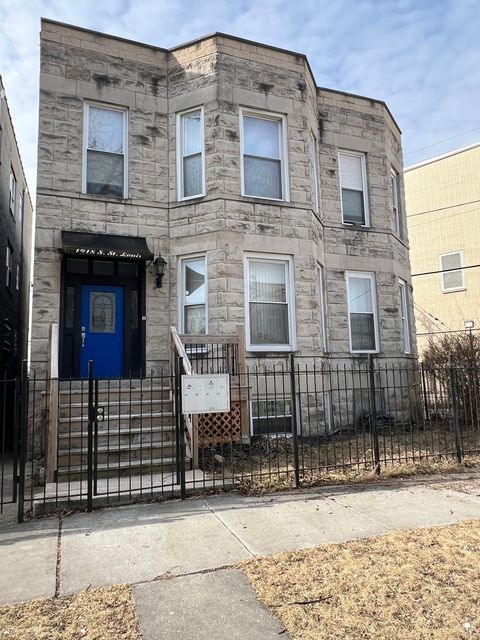
Active
$369,000
5
bds
|
2
ba
|
0
sqft
|
built
1898
1918 S Saint Louis Ave, Chicago, IL 60623
$-611
Cash flow
-8.6%
Cash-on-Cash Return
3.7%
Cap rate
0.5%
Rent to Value Ratio
Active
$2,675,000
2
bds
|
2
ba
|
2,200
sqft
|
built
2016
4 E Elm St, Chicago, IL 60611
$-11,212
Cash flow
-21.9%
Cash-on-Cash Return
0.6%
Cap rate
0.4%
Rent to Value Ratio
Active
$370,000
5
bds
|
3
ba
|
0
sqft
|
built
1928
6636 S Rhodes Ave, Chicago, IL 60637
$-652
Cash flow
-9.2%
Cash-on-Cash Return
3.6%
Cap rate
0.5%
Rent to Value Ratio
Active
$305,000
2
bds
|
2
ba
|
1,648
sqft
|
built
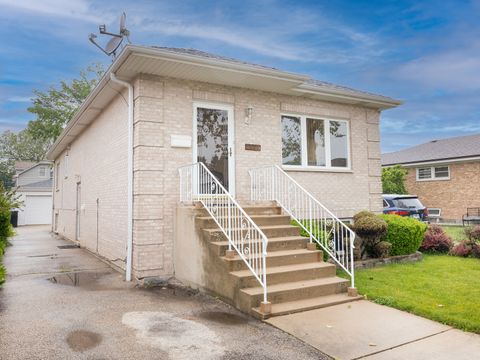
1950
2817 Lee St, Melrose Park, IL 60164
$-21
Cash flow
-0.4%
Cash-on-Cash Return
5.6%
Cap rate
0.9%
Rent to Value Ratio
Active
$225,000
4
bds
|
2
ba
|
1,520
sqft
|
built
1958
4441 185th St, Country Club Hills, IL 60478
$105
Cash flow
2.4%
Cash-on-Cash Return
6.2%
Cap rate
1.2%
Rent to Value Ratio
Active
$89,900
3
bds
|
2
ba
|
0
sqft
|
built
1889
6752 S Peoria St, Chicago, IL 60621
$610
Cash flow
35.4%
Cash-on-Cash Return
13.8%
Cap rate
1.7%
Rent to Value Ratio
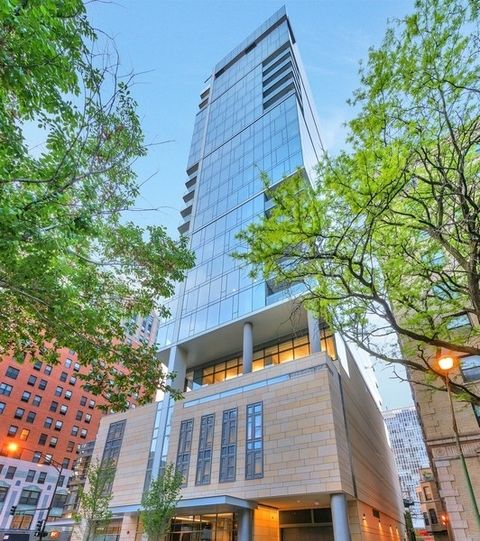
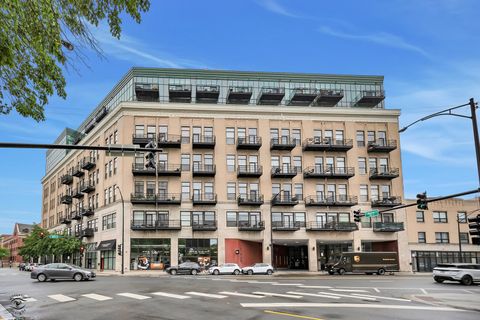
Active
$350,000
2
bds
|
1
ba
|
1,090
sqft
|
built
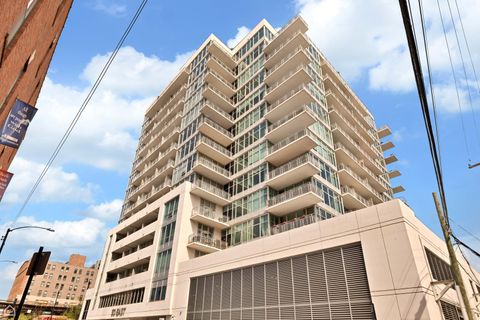
2007
50 E 16th St, Chicago, IL 60616
$-935
Cash flow
-13.9%
Cash-on-Cash Return
2.5%
Cap rate
0.9%
Rent to Value Ratio
Active
$499,900
3
bds
|
3
ba
|
1,254
sqft
|
built
1998
3308 N Octavia Ave, Chicago, IL 60634
$-632
Cash flow
-6.6%
Cash-on-Cash Return
4.2%
Cap rate
0.6%
Rent to Value Ratio
Active
$325,000
3
bds
|
3
ba
|
2,200
sqft
|
built
1924
8837 S Throop St, Chicago, IL 60620
$-42
Cash flow
-0.7%
Cash-on-Cash Return
5.5%
Cap rate
0.8%
Rent to Value Ratio
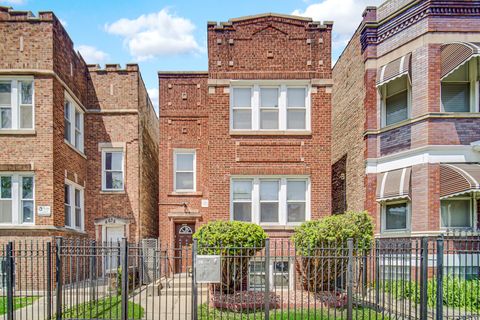
Active
$260,000
5
bds
|
2
ba
|
2,087
sqft
|
built
1928
1942 E 74th St, Chicago, IL 60649
$-46
Cash flow
-0.9%
Cash-on-Cash Return
5.5%
Cap rate
0.9%
Rent to Value Ratio
Active
$315,000
2
bds
|
2
ba
|
1,260
sqft
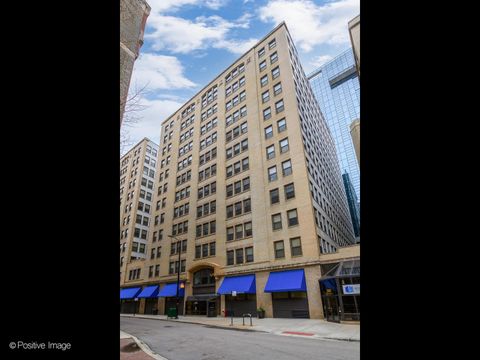
|
built
1913
740 S Federal St, Chicago, IL 60605
$-874
Cash flow
-14.5%
Cash-on-Cash Return
2.4%
Cap rate
0.9%
Rent to Value Ratio
Active
$210,000
6
bds
|
2
ba
|
0
sqft
|
built
1906
7414 S Princeton Ave, Chicago, IL 60621
$219
Cash flow
5.4%
Cash-on-Cash Return
6.9%
Cap rate
1.0%
Rent to Value Ratio
Active
$415,000
5
bds
|
3
ba
|
2,622
sqft
|
built
1955
11554 S Neenah Ave, Worth, IL 60482
$-306
Cash flow
-3.8%
Cash-on-Cash Return
4.8%
Cap rate
0.9%
Rent to Value Ratio

Active
$1,995,000
5
bds
|
6
ba
|
5,035
sqft
|
built
2006
724 Becker Rd, Glenview, IL 60025
$-7,526
Cash flow
-19.7%
Cash-on-Cash Return
1.2%
Cap rate
0.4%
Rent to Value Ratio
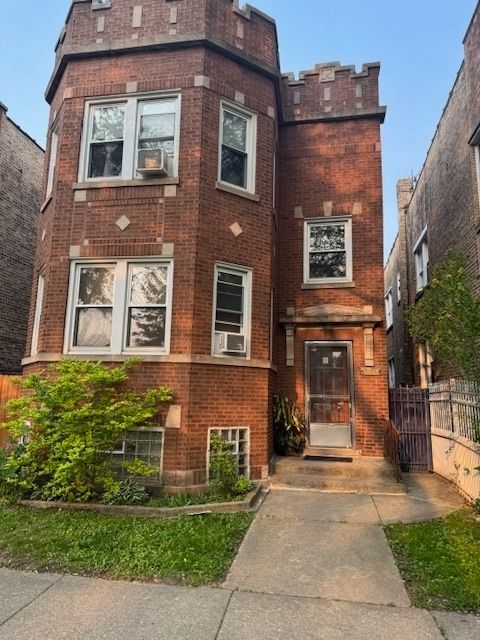
Active
$389,999
2
bds
|
2
ba
|
1,320
sqft
|
built
2006
1645 W Ogden Ave, Chicago, IL 60612
$-1,044
Cash flow
-14.0%
Cash-on-Cash Return
2.5%
Cap rate
0.8%
Rent to Value Ratio
Active
$719,900
8
bds
|
3
ba
|
0
sqft
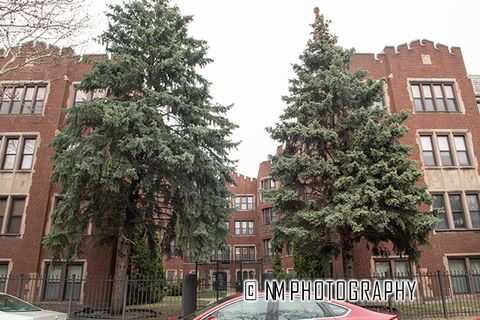
|
built
1920
5829 N Washtenaw Ave, Chicago, IL 60659
$-2,161
Cash flow
-15.7%
Cash-on-Cash Return
2.1%
Cap rate
0.4%
Rent to Value Ratio
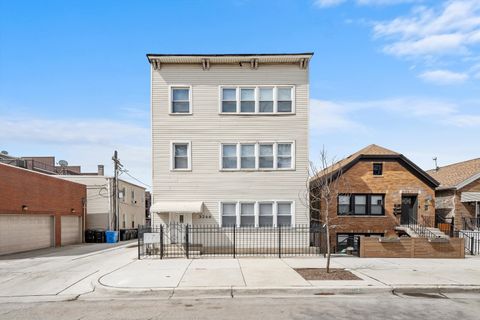
Active
$1,049,000
8
bds
|
4
ba
|
0
sqft
|
built
1887
3246 S Normal Ave, Chicago, IL 60616
$-4,389
Cash flow
-21.8%
Cash-on-Cash Return
0.7%
Cap rate
0.2%
Rent to Value Ratio
Active
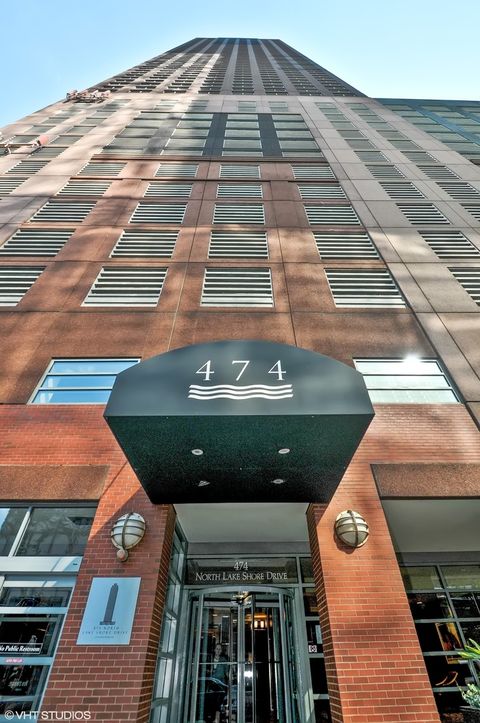
$250,000
1
bds
|
1
ba
|
741
sqft
|
built
1991
474 N Lake Shore Dr, Chicago, IL 60611
$-489
Cash flow
-10.2%
Cash-on-Cash Return
3.3%
Cap rate
1.0%
Rent to Value Ratio
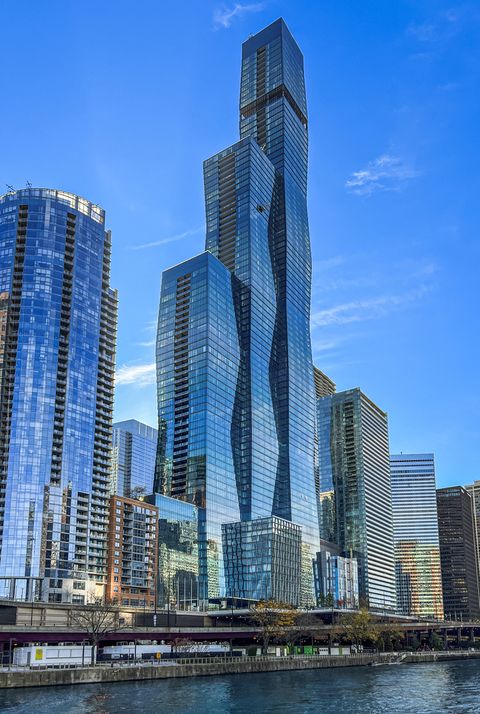
Active
$6,995,000
4
bds
|
6
ba
|
4,850
sqft
|
built
2023
363 E Wacker Dr, Chicago, IL 60601
$-44,420
Cash flow
-33.1%
Cash-on-Cash Return
-1.9%
Cap rate
0.0%
Rent to Value Ratio
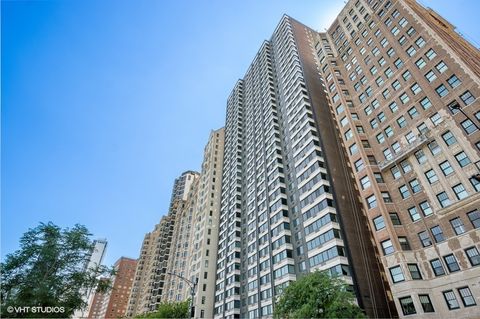
Active
$995,000
3
bds
|
3
ba
|
2,500
sqft
|
built
1965
1440 N Lake Shore Dr, Chicago, IL 60610
$-5,050
Cash flow
-26.5%
Cash-on-Cash Return
-0.4%
Cap rate
0.6%
Rent to Value Ratio
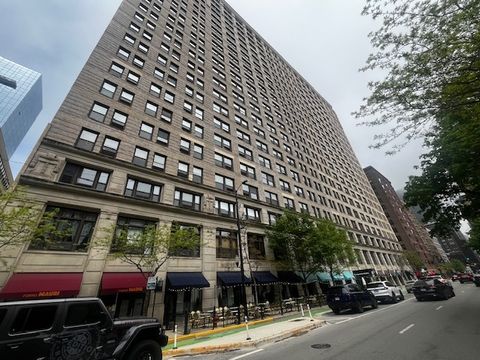
Active
$219,900
1
bds
|
1
ba
|
883
sqft
|
built
1911
600 S Dearborn St, Chicago, IL 60605
$-334
Cash flow
-7.9%
Cash-on-Cash Return
3.9%
Cap rate
0.9%
Rent to Value Ratio
Active
$179,900
2
bds
|
1
ba
|
850
sqft
|
built
1955
3950 N Lake Shore Dr, Chicago, IL 60613
$-63
Cash flow
-1.8%
Cash-on-Cash Return
5.3%
Cap rate
1.4%
Rent to Value Ratio
Active
$340,000
4
bds
|
4
ba
|
0
sqft
|
built
1912
7601 S Morgan St, Chicago, IL 60620
$-581
Cash flow
-8.9%
Cash-on-Cash Return
3.6%
Cap rate
0.6%
Rent to Value Ratio
Active
$3,295,000
5
bds
|
6
ba
|
5,118
sqft
|
built
2000
530 Essex Rd, Kenilworth, IL 60043
$-14,969
Cash flow
-23.7%
Cash-on-Cash Return
0.2%
Cap rate
0.3%
Rent to Value Ratio
Active
$175,000
1
bds
|
2
ba
|
825
sqft
|
built
1971
4720 Laurel Dr, Richton Park, IL 60471
$161
Cash flow
4.8%
Cash-on-Cash Return
6.8%
Cap rate
1.1%
Rent to Value Ratio
Active
$219,000
4
bds
|
2
ba
|
1,664
sqft
|
built
1954
106 Blackhawk Dr, Park Forest, IL 60466
$-63
Cash flow
-1.5%
Cash-on-Cash Return
5.3%
Cap rate
1.1%
Rent to Value Ratio
Active
$395,000
9
bds
|
4
ba
|
0
sqft
|
built
1889
2227 W 21st St, Chicago, IL 60608
$-1,170
Cash flow
-15.5%
Cash-on-Cash Return
2.1%
Cap rate
0.6%
Rent to Value Ratio
Active
$1,799,000
3
bds
|
3
ba
|
3,334
sqft
|
built
2002
1155 N Dearborn St, Chicago, IL 60610
$-7,728
Cash flow
-22.4%
Cash-on-Cash Return
0.5%
Cap rate
0.5%
Rent to Value Ratio