Cook County Investment Properties for Sale
Browse homes for sale and investment properties in Cook County. Refine your search by price, property type, or more.
Best cash flowing properties in Cook County

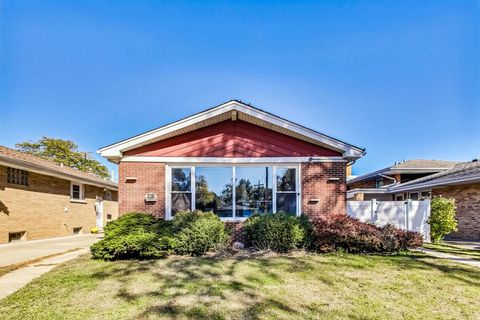
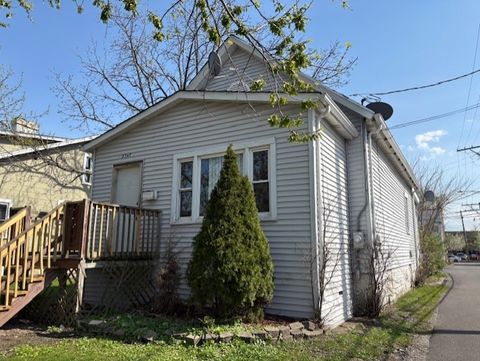
Active
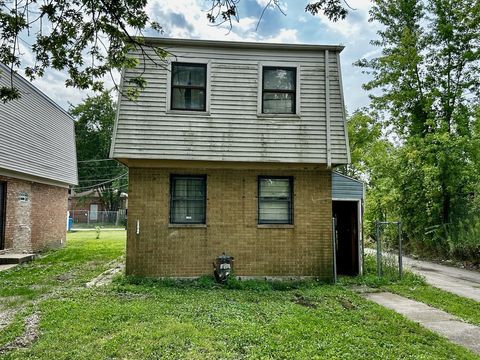
$240,000
3
bds
|
2
ba
|
2,200
sqft
|
built
1921
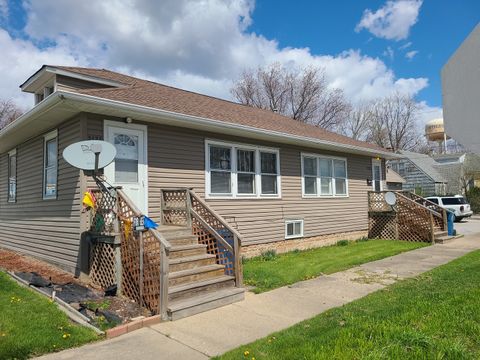
10240 S State St, Chicago, IL 60628
$700
Cash flow
15.2%
Cash-on-Cash Return
9.2%
Cap rate
1.1%
Rent to Value Ratio
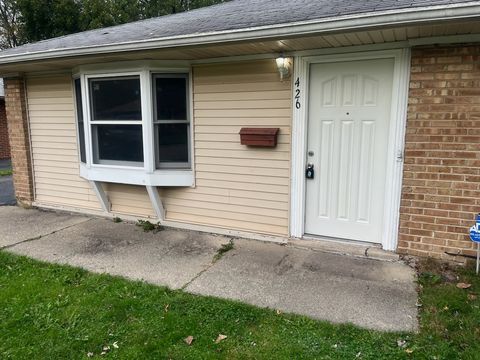
Active
$80,500
2
bds
|
1
ba
|
1,088
sqft
|
built
1971
355 W 105th Pl, Chicago, IL 60628
$594
Cash flow
38.5%
Cash-on-Cash Return
14.5%
Cap rate
2.0%
Rent to Value Ratio
6,273 out of 8,479 properties for sale in Cook County
Limited Results Shown
Create a free account, or log in to reveal all property listings and enjoy the complete experience.
Active
$146,900
2
bds
|
1
ba
|
900
sqft
|
built
1977
11801 S Karlov Ave, Alsip, IL 60803
$193
Cash flow
6.9%
Cash-on-Cash Return
7.3%
Cap rate
1.4%
Rent to Value Ratio

Active
$445,000
4
bds
|
2
ba
|
1,800
sqft
|
built
1924
1702 S 4th Ave, Maywood, IL 60153
$-503
Cash flow
-5.9%
Cash-on-Cash Return
4.3%
Cap rate
0.7%
Rent to Value Ratio

Active
$225,000
3
bds
|
3
ba
|
1,789
sqft
|
built
1900
6209 S Dorchester Ave, Chicago, IL 60637
$-559
Cash flow
-13.0%
Cash-on-Cash Return
2.7%
Cap rate
0.8%
Rent to Value Ratio
Active
$489,500
4
bds
|
2
ba
|
2,632
sqft
|
built
1891
248 N Rohlwing Rd, Palatine, IL 60074
$-340
Cash flow
-3.6%
Cash-on-Cash Return
4.8%
Cap rate
0.8%
Rent to Value Ratio

Active
$359,000
1
bds
|
1
ba
|
0
sqft
|
built
1969
512 W Barry Ave, Chicago, IL 60657
$-1,027
Cash flow
-14.9%
Cash-on-Cash Return
2.2%
Cap rate
0.6%
Rent to Value Ratio

Active
$259,000
6
bds
|
2
ba
|
0
sqft
|
built
1888
4823 S Prairie Ave, Chicago, IL 60615
$-177
Cash flow
-3.6%
Cash-on-Cash Return
4.9%
Cap rate
0.8%
Rent to Value Ratio
Active
$550,000
2
bds
|
2
ba
|
1,300
sqft
|
built
1982
360 E Randolph St, Chicago, IL 60601
$-1,810
Cash flow
-17.2%
Cash-on-Cash Return
1.7%
Cap rate
0.7%
Rent to Value Ratio

Active
$950,000
8
bds
|
3
ba
|
0
sqft
|
built
1891
929 N Fairfield Ave, Chicago, IL 60622
$-2,914
Cash flow
-16.0%
Cash-on-Cash Return
2.0%
Cap rate
0.4%
Rent to Value Ratio

Active
$175,000
3
bds
|
3
ba
|
2,005
sqft
|
built
1970
494 Oglesby Ave, Calumet City, IL 60409
$-178
Cash flow
-5.3%
Cash-on-Cash Return
4.5%
Cap rate
1.3%
Rent to Value Ratio

Active
$359,900
4
bds
|
3
ba
|
0
sqft
|
built
1913
1222 Circle Ave, Forest Park, IL 60130
$-778
Cash flow
-11.3%
Cash-on-Cash Return
3.1%
Cap rate
0.7%
Rent to Value Ratio

Active
$390,000
4
bds
|
3
ba
|
2,449
sqft
|
built
1999
8547 S Drake Ave, Chicago, IL 60652
$-94
Cash flow
-1.3%
Cash-on-Cash Return
5.4%
Cap rate
0.8%
Rent to Value Ratio
Active
$585,000
3
bds
|
2
ba
|
1,225
sqft
|
built
1960
5148 Coyle Ave, Skokie, IL 60077
$-846
Cash flow
-7.5%
Cash-on-Cash Return
3.9%
Cap rate
0.7%
Rent to Value Ratio
Active
$139,900
4
bds
|
2
ba
|
0
sqft
|
built
1952
426 Suwanee St, Park Forest, IL 60466
$-196
Cash flow
-7.3%
Cash-on-Cash Return
4.0%
Cap rate
1.6%
Rent to Value Ratio
Active
$2,900,000
3
bds
|
3
ba
|
3,225
sqft
|
built
2000
800 N Michigan Ave, Chicago, IL 60611
$-15,372
Cash flow
-27.7%
Cash-on-Cash Return
-0.7%
Cap rate
0.3%
Rent to Value Ratio
Active
$899,000
4
bds
|
3
ba
|
2,500
sqft
|
built
1963
2400 N Lakeview Ave, Chicago, IL 60614
$-2,589
Cash flow
-15.0%
Cash-on-Cash Return
2.2%
Cap rate
0.9%
Rent to Value Ratio
Active
$240,000
3
bds
|
2
ba
|
2,200
sqft
|
built
1921
10240 S State St, Chicago, IL 60628
$700
Cash flow
15.2%
Cash-on-Cash Return
9.2%
Cap rate
1.1%
Rent to Value Ratio
Active
$95,000
2
bds
|
2
ba
|
854
sqft
|
built
1888
2347 121st Pl, Blue Island, IL 60406
$444
Cash flow
24.4%
Cash-on-Cash Return
11.3%
Cap rate
1.7%
Rent to Value Ratio

Active
$2,950,000
4
bds
|
6
ba
|
4,800
sqft
|
built
2025
1342 W Wellington Ave, Chicago, IL 60657
$-7,658
Cash flow
-13.5%
Cash-on-Cash Return
2.6%
Cap rate
0.4%
Rent to Value Ratio
Active
$239,000
6
bds
|
3
ba
|
2,600
sqft
|
built
1903
6916 S Lowe Ave, Chicago, IL 60621
$179
Cash flow
3.9%
Cash-on-Cash Return
6.6%
Cap rate
0.8%
Rent to Value Ratio
Active
$134,999
3
bds
|
2
ba
|
1,690
sqft
|
built
1958
355 Osage St, Park Forest, IL 60466
$4
Cash flow
0.2%
Cash-on-Cash Return
5.7%
Cap rate
1.6%
Rent to Value Ratio

Active
$90,500
2
bds
|
1
ba
|
1,106
sqft
|
built
1952
8338 S Ingleside Ave, Chicago, IL 60619
$582
Cash flow
33.6%
Cash-on-Cash Return
13.4%
Cap rate
1.8%
Rent to Value Ratio
Active
$80,500
2
bds
|
1
ba
|
1,088
sqft
|
built
1971
355 W 105th Pl, Chicago, IL 60628
$594
Cash flow
38.5%
Cash-on-Cash Return
14.5%
Cap rate
2.0%
Rent to Value Ratio

Active
$100,000
2
bds
|
1
ba
|
980
sqft
|
built
1951
2258 E 96th St, Chicago, IL 60617
$575
Cash flow
30.0%
Cash-on-Cash Return
12.6%
Cap rate
1.6%
Rent to Value Ratio
Active
$90,500
4
bds
|
2
ba
|
0
sqft
|
built
1898
11854 S Lafayette Ave, Chicago, IL 60628
$452
Cash flow
26.1%
Cash-on-Cash Return
11.7%
Cap rate
1.5%
Rent to Value Ratio

Active
$90,500
3
bds
|
1
ba
|
1,092
sqft
|
built
1968
11641 S Sangamon St, Chicago, IL 60643
$564
Cash flow
32.5%
Cash-on-Cash Return
13.2%
Cap rate
1.8%
Rent to Value Ratio

Active
$159,000
2
bds
|
2
ba
|
1,650
sqft
|
built
1930
10440 S Sangamon St, Chicago, IL 60643
$491
Cash flow
16.1%
Cash-on-Cash Return
9.4%
Cap rate
1.4%
Rent to Value Ratio
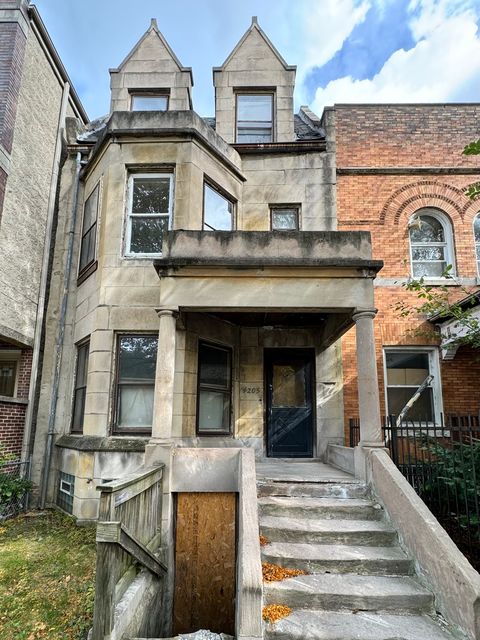
Active
$500,000
6
bds
|
3
ba
|
2,392
sqft
|
built
1896
4205 S Prairie Ave, Chicago, IL 60653
$-655
Cash flow
-6.8%
Cash-on-Cash Return
4.1%
Cap rate
0.6%
Rent to Value Ratio
Active
$565,000
2
bds
|
2
ba
|
1,367
sqft
|
built
2004
1717 S Prairie Ave, Chicago, IL 60616
$-1,715
Cash flow
-15.8%
Cash-on-Cash Return
2.0%
Cap rate
0.6%
Rent to Value Ratio
Active
$435,000
4
bds
|
3
ba
|
2,734
sqft
|
built
1993
18140 Crystal Ln, Lansing, IL 60438
$-579
Cash flow
-6.9%
Cash-on-Cash Return
4.1%
Cap rate
0.8%
Rent to Value Ratio
Active
$750,000
3
bds
|
4
ba
|
3,000
sqft
|
built
2015
3407 S Calumet Ave, Chicago, IL 60616
$-417
Cash flow
-2.9%
Cash-on-Cash Return
5.0%
Cap rate
0.7%
Rent to Value Ratio

Active
$299,900
4
bds
|
3
ba
|
2,200
sqft
|
built
1959
1409 E 90th St, Chicago, IL 60619
$307
Cash flow
5.3%
Cash-on-Cash Return
6.9%
Cap rate
0.9%
Rent to Value Ratio
Active
$238,500
bds
|
1
ba
|
700
sqft
|
built
1990
401 E Ontario St, Chicago, IL 60611
$-805
Cash flow
-17.6%
Cash-on-Cash Return
1.6%
Cap rate
0.8%
Rent to Value Ratio
Active
$235,000
4
bds
|
2
ba
|
1,492
sqft
|
built
1971
2942 193rd Pl, Lansing, IL 60438
$-260
Cash flow
-5.8%
Cash-on-Cash Return
4.4%
Cap rate
1.0%
Rent to Value Ratio

Active
$299,000
3
bds
|
2
ba
|
0
sqft
|
built
1883
3228 S Paulina St, Chicago, IL 60608
$-160
Cash flow
-2.8%
Cash-on-Cash Return
5.0%
Cap rate
0.7%
Rent to Value Ratio

Active
$599,000
3
bds
|
2
ba
|
1,770
sqft
|
built
1965
1440 N Lake Shore Dr, Chicago, IL 60610
$-2,257
Cash flow
-19.7%
Cash-on-Cash Return
1.2%
Cap rate
0.8%
Rent to Value Ratio
Active
$267,900
3
bds
|
2
ba
|
1,970
sqft
|
built
2009
20545 Burnham Ave, Lynwood, IL 60411
$-217
Cash flow
-4.2%
Cash-on-Cash Return
4.7%
Cap rate
0.9%
Rent to Value Ratio

Active
$164,981
3
bds
|
1
ba
|
1,300
sqft
|
built
1954
16154 Wood St, Markham, IL 60428
$182
Cash flow
5.8%
Cash-on-Cash Return
7.0%
Cap rate
1.5%
Rent to Value Ratio

Active
$488,000
3
bds
|
2
ba
|
1,777
sqft
|
built
1964
526 Laramie Ave, Wilmette, IL 60091
$-437
Cash flow
-4.7%
Cash-on-Cash Return
4.6%
Cap rate
0.7%
Rent to Value Ratio
Active
$284,900
3
bds
|
1
ba
|
1,185
sqft
|
built
1923
1329 S 12th Ave, Maywood, IL 60153
$-15
Cash flow
-0.3%
Cash-on-Cash Return
5.6%
Cap rate
1.0%
Rent to Value Ratio
Active
$194,900
2
bds
|
2
ba
|
0
sqft
|
built
1916
3121 Chicago Rd, Steger, IL 60475
$10
Cash flow
0.3%
Cash-on-Cash Return
5.7%
Cap rate
0.9%
Rent to Value Ratio