Cook County Investment Properties for Sale
Browse homes for sale and investment properties in Cook County. Refine your search by price, property type, or more.
Best cash flowing properties in Cook County
Active
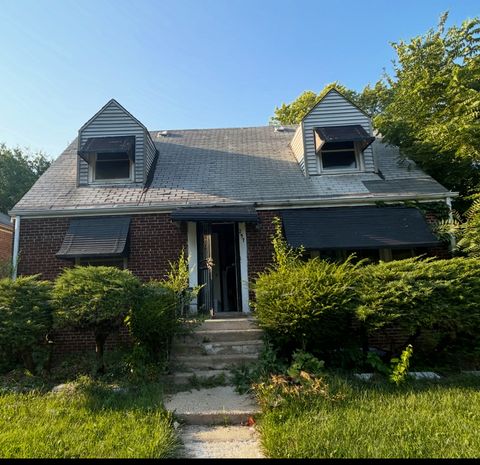
$60,000
3
bds
|
2
ba
|
1,210
sqft
|
built
1947
257 W 146th St, Riverdale, IL 60827
$1,337
Cash flow
26.0%
Cash-on-Cash Return
26.7%
Cap rate
3.3%
Rent to Value Ratio
Active
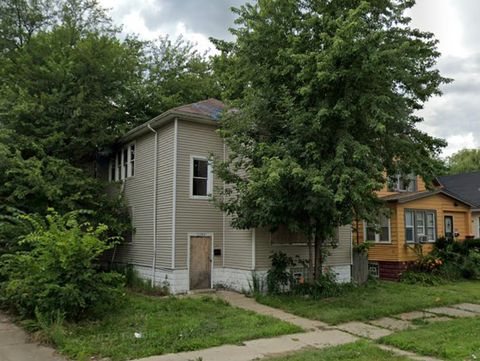
$50,000
4
bds
|
2
ba
|
0
sqft
|
built
1924
11742 S Harvard Ave, Chicago, IL 60628
$1,301
Cash flow
30.3%
Cash-on-Cash Return
31.2%
Cap rate
4.0%
Rent to Value Ratio
4,642 out of 5,403 properties for sale in Cook County
Limited Results Shown
Create a free account, or log in to reveal all property listings and enjoy the complete experience.
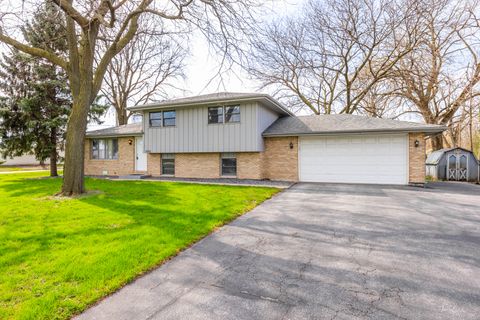
Active
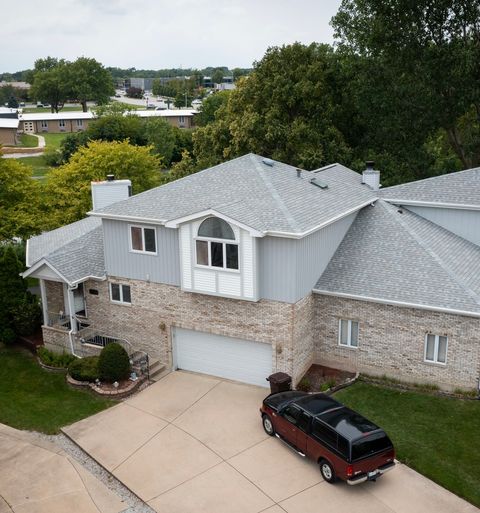
$349,000
3
bds
|
4
ba
|
2,462
sqft
|
built
1993
6954 Kingston Ct, Tinley Park, IL 60477
$-618
Cash flow
-9.2%
Cash-on-Cash Return
3.6%
Cap rate
0.9%
Rent to Value Ratio
Active
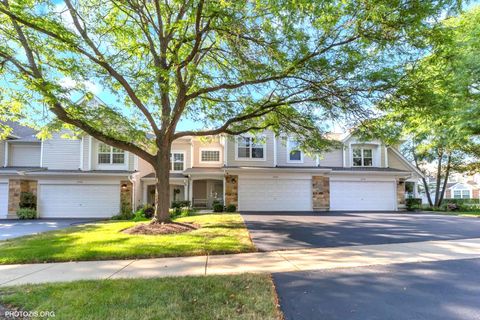
$479,900
3
bds
|
3
ba
|
1,550
sqft
|
built
1993
2902 Belle Ln, Schaumburg, IL 60193
$-1,258
Cash flow
-13.7%
Cash-on-Cash Return
2.5%
Cap rate
0.6%
Rent to Value Ratio
Active
$175,000
1
bds
|
1
ba
|
1,000
sqft
|
built
1969
9001 Golf Rd, Des Plaines, IL 60016
$-175
Cash flow
-5.2%
Cash-on-Cash Return
4.5%
Cap rate
1.0%
Rent to Value Ratio
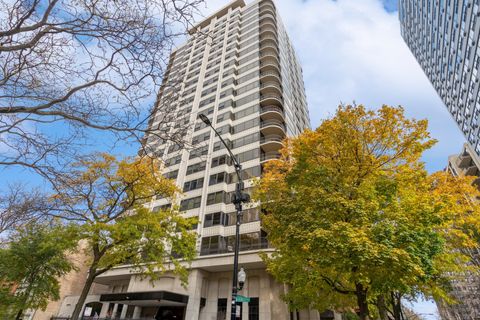
Active
$299,900
1
bds
|
1
ba
|
750
sqft
|
built
1987
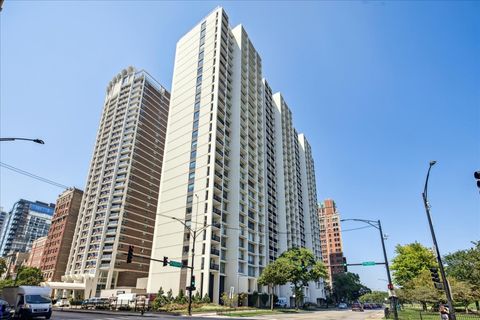
3660 N Lake Shore Dr, Chicago, IL 60613
$-827
Cash flow
-14.4%
Cash-on-Cash Return
2.4%
Cap rate
0.7%
Rent to Value Ratio
Active
$155,000
3
bds
|
1
ba
|
1,092
sqft
|
built
1957
146 Well St, Park Forest, IL 60466
$157
Cash flow
5.3%
Cash-on-Cash Return
6.9%
Cap rate
1.3%
Rent to Value Ratio
Active
$365,000
6
bds
|
3
ba
|
0
sqft
|
built
1916
5119 S Washtenaw Ave, Chicago, IL 60632
$-671
Cash flow
-9.6%
Cash-on-Cash Return
3.5%
Cap rate
0.5%
Rent to Value Ratio
Active
$385,000
2
bds
|
2
ba
|
1,810
sqft
|
built
1913
1626 W Highland Ave, Chicago, IL 60660
$-621
Cash flow
-8.4%
Cash-on-Cash Return
3.7%
Cap rate
0.7%
Rent to Value Ratio
Active
$315,000
1
bds
|
1
ba
|
728
sqft
|
built
2009
303 W Ohio St, Chicago, IL 60654
$-526
Cash flow
-8.7%
Cash-on-Cash Return
3.7%
Cap rate
1.0%
Rent to Value Ratio
Active
$270,000
1
bds
|
1
ba
|
0
sqft
|
built
1980
30 E Huron St, Chicago, IL 60611
$-691
Cash flow
-13.4%
Cash-on-Cash Return
2.6%
Cap rate
0.9%
Rent to Value Ratio
Active
$250,000
2
bds
|
2
ba
|
1,400
sqft
|
built
1974
1255 W Prospect Ave, Mount Prospect, IL 60056
$-219
Cash flow
-4.6%
Cash-on-Cash Return
4.6%
Cap rate
1.0%
Rent to Value Ratio
Active
$468,500
6
bds
|
3
ba
|
0
sqft
|
built
1963
7524 W 63rd Pl, Summit, IL 60501
$-1,280
Cash flow
-14.3%
Cash-on-Cash Return
2.4%
Cap rate
0.5%
Rent to Value Ratio
Active
$299,900
4
bds
|
3
ba
|
2,654
sqft
|
built
1890
8211 S Cornell Ave, Chicago, IL 60617
$284
Cash flow
4.9%
Cash-on-Cash Return
6.8%
Cap rate
0.9%
Rent to Value Ratio
Active
$485,000
2
bds
|
3
ba
|
1,210
sqft
|
built
2009
1313 W Carmen Ave, Chicago, IL 60640
$-637
Cash flow
-6.9%
Cash-on-Cash Return
4.1%
Cap rate
0.7%
Rent to Value Ratio
Active
$395,000
4
bds
|
1
ba
|
2,953
sqft
|
built
1924
5525 W Berenice Ave, Chicago, IL 60641
$-377
Cash flow
-5.0%
Cash-on-Cash Return
4.5%
Cap rate
0.7%
Rent to Value Ratio
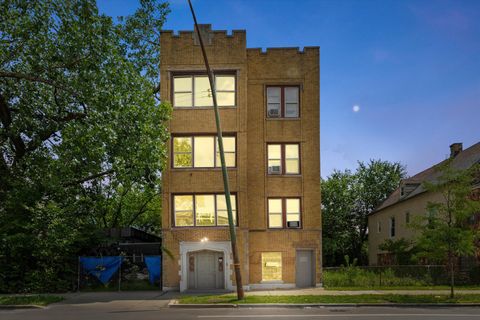
Active
$499,999
13
bds
|
4
ba
|
0
sqft
|
built
1926
1309 S Kostner Ave, Chicago, IL 60623
$-973
Cash flow
-10.2%
Cash-on-Cash Return
3.3%
Cap rate
0.5%
Rent to Value Ratio
Active
$257,500
3
bds
|
2
ba
|
1,800
sqft
|
built
1989
1001 172nd St, East Hazel Crest, IL 60429
$-10
Cash flow
-0.2%
Cash-on-Cash Return
5.6%
Cap rate
1.1%
Rent to Value Ratio
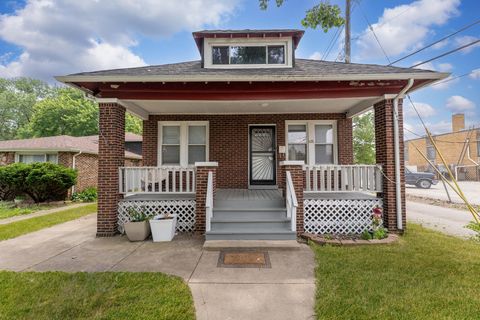
Active
$234,900
3
bds
|
2
ba
|
1,175
sqft
|
built
1922
121 E 123rd St, Chicago, IL 60628
$385
Cash flow
8.6%
Cash-on-Cash Return
7.6%
Cap rate
1.0%
Rent to Value Ratio
Active
$1,395,000
3
bds
|
3
ba
|
2,800
sqft
|
built
1975
1501 N State Pkwy, Chicago, IL 60610
$-7,810
Cash flow
-29.2%
Cash-on-Cash Return
-1.0%
Cap rate
0.4%
Rent to Value Ratio
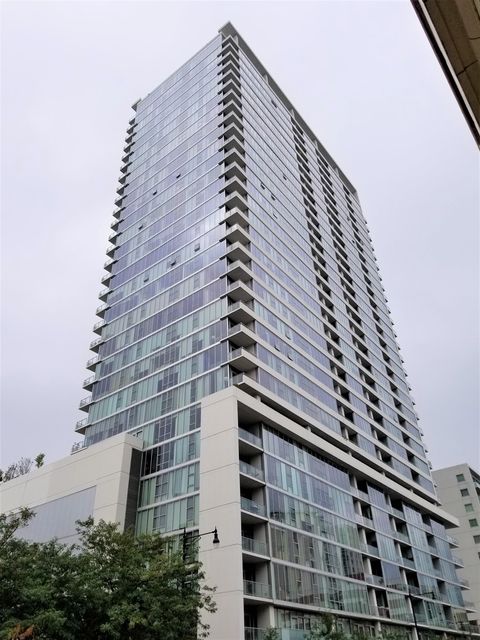
Active
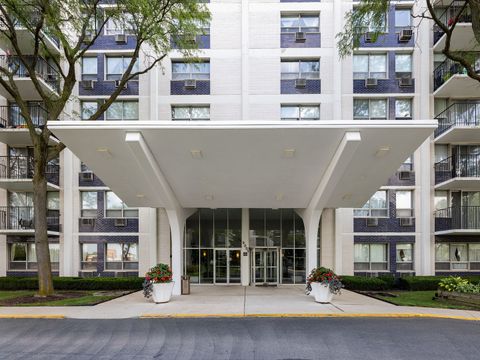
$325,000
1
bds
|
1
ba
|
760
sqft
|
built
2003
1000 N Kingsbury St, Chicago, IL 60610
$-484
Cash flow
-7.8%
Cash-on-Cash Return
3.9%
Cap rate
0.8%
Rent to Value Ratio
Active
$399,000
3
bds
|
2
ba
|
1,975
sqft
|
built
1970
6145 N Sheridan Rd, Chicago, IL 60660
$-1,328
Cash flow
-17.4%
Cash-on-Cash Return
1.7%
Cap rate
0.8%
Rent to Value Ratio
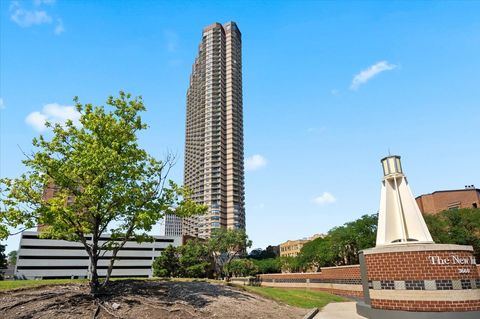
Active
$289,000
1
bds
|
1
ba
|
0
sqft
|
built
2008
8 E Randolph St, Chicago, IL 60601
$-554
Cash flow
-10.0%
Cash-on-Cash Return
3.4%
Cap rate
1.0%
Rent to Value Ratio
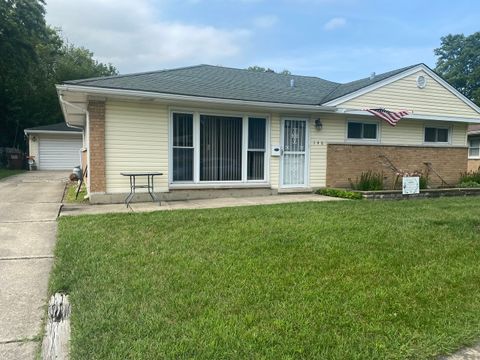
Active
$121,000
3
bds
|
1
ba
|
1,261
sqft
|
built
1985
4317 182nd Pl, Country Club Hills, IL 60478
$446
Cash flow
19.2%
Cash-on-Cash Return
10.1%
Cap rate
2.1%
Rent to Value Ratio
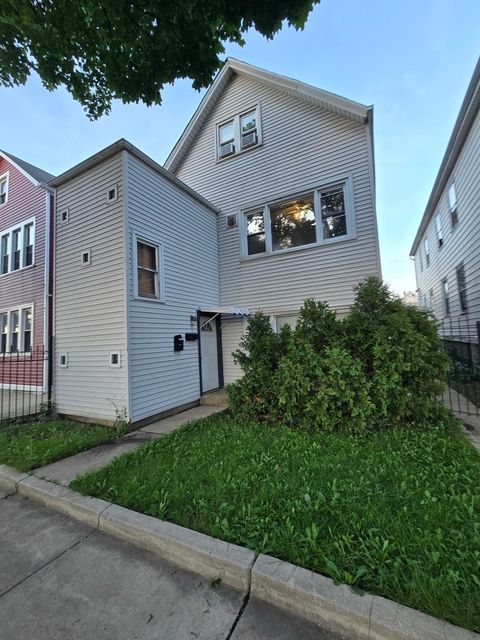
Active
$570,000
2
bds
|
2
ba
|
1,500
sqft
|
built
1917
4647 N Wolcott Ave, Chicago, IL 60640
$-1,307
Cash flow
-12.0%
Cash-on-Cash Return
2.9%
Cap rate
0.6%
Rent to Value Ratio
Active
$549,900
8
bds
|
3
ba
|
0
sqft
|
built
1958
2705 N Sayre Ave, Chicago, IL 60707
$-1,000
Cash flow
-9.5%
Cash-on-Cash Return
3.5%
Cap rate
0.5%
Rent to Value Ratio
Active
$249,900
2
bds
|
1
ba
|
1,300
sqft
|
built
1979
5501 N California Ave, Chicago, IL 60625
$-145
Cash flow
-3.0%
Cash-on-Cash Return
5.0%
Cap rate
0.9%
Rent to Value Ratio
Active
$449,995
2
bds
|
2
ba
|
0
sqft
|
built
1970
1560 N Sandburg Ter, Chicago, IL 60610
$-1,814
Cash flow
-21.0%
Cash-on-Cash Return
0.8%
Cap rate
0.7%
Rent to Value Ratio
Active
$239,999
1
bds
|
1
ba
|
705
sqft
|
built
2005
1720 S Michigan Ave, Chicago, IL 60616
$-726
Cash flow
-15.8%
Cash-on-Cash Return
2.1%
Cap rate
0.8%
Rent to Value Ratio
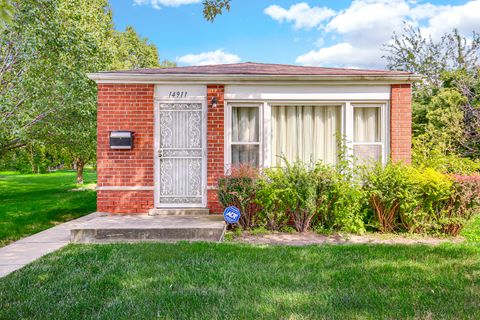
Active
$175,000
4
bds
|
2
ba
|
923
sqft
|
built
1970
14911 Page Ave, Harvey, IL 60426
$-66
Cash flow
-2.0%
Cash-on-Cash Return
5.2%
Cap rate
1.0%
Rent to Value Ratio
Active
$700,000
2
bds
|
1
ba
|
650
sqft
|
built
1942
580 N Quentin Rd, Palatine, IL 60067
$-2,086
Cash flow
-15.5%
Cash-on-Cash Return
2.1%
Cap rate
0.3%
Rent to Value Ratio
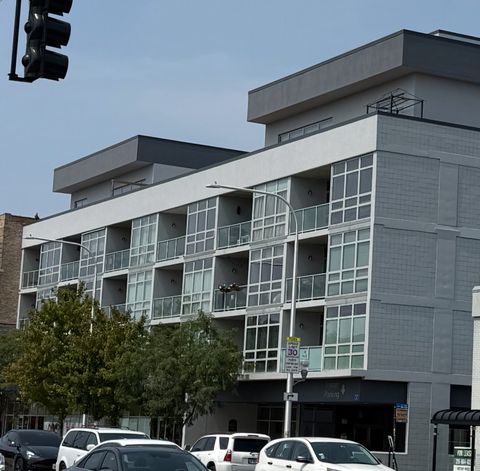
Active
$570,000
2
bds
|
2
ba
|
1,300
sqft
|
built
2008
1610 W Fullerton Ave, Chicago, IL 60614
$-1,131
Cash flow
-10.4%
Cash-on-Cash Return
3.3%
Cap rate
0.6%
Rent to Value Ratio
Active
$439,000
2
bds
|
2
ba
|
1,250
sqft
|
built
1966
3200 N Lake Shore Dr, Chicago, IL 60657
$-1,357
Cash flow
-16.1%
Cash-on-Cash Return
2.0%
Cap rate
0.8%
Rent to Value Ratio
Active
$779,000
4
bds
|
3
ba
|
3,400
sqft
|
built
1929
421 W Melrose St, Chicago, IL 60657
$-4,805
Cash flow
-32.2%
Cash-on-Cash Return
-1.7%
Cap rate
0.9%
Rent to Value Ratio
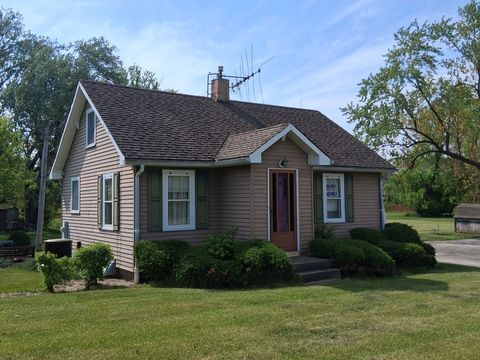
Active
$199,900
3
bds
|
2
ba
|
1,152
sqft
|
built
1965
772 Memorial Dr, Calumet City, IL 60409
$-180
Cash flow
-4.7%
Cash-on-Cash Return
4.6%
Cap rate
1.1%
Rent to Value Ratio
Active
$525,000
4
bds
|
4
ba
|
3,808
sqft
|
built
1890
638 E 65th St, Chicago, IL 60637
$-694
Cash flow
-6.9%
Cash-on-Cash Return
4.1%
Cap rate
0.6%
Rent to Value Ratio
Active
$420,000
5
bds
|
4
ba
|
0
sqft
|
built
1912
5758 S Honore St, Chicago, IL 60636
$-676
Cash flow
-8.4%
Cash-on-Cash Return
3.7%
Cap rate
0.5%
Rent to Value Ratio
Active
$299,900
3
bds
|
2
ba
|
3,286
sqft
|
built
1927
9118 S Marshfield Ave, Chicago, IL 60620
$479
Cash flow
8.3%
Cash-on-Cash Return
7.6%
Cap rate
1.0%
Rent to Value Ratio
Active
$334,900
3
bds
|
3
ba
|
2,529
sqft
|
built
1913
7842 S Evans Ave, Chicago, IL 60619
$-449
Cash flow
-7.0%
Cash-on-Cash Return
4.1%
Cap rate
0.5%
Rent to Value Ratio
Active
$255,000
1
bds
|
1
ba
|
850
sqft
|
built
2007
974 W 35th Pl, Chicago, IL 60609
$-338
Cash flow
-6.9%
Cash-on-Cash Return
4.1%
Cap rate
0.9%
Rent to Value Ratio