Cook County Investment Properties for Sale
Browse homes for sale and investment properties in Cook County. Refine your search by price, property type, or more.
Best cash flowing properties in Cook County
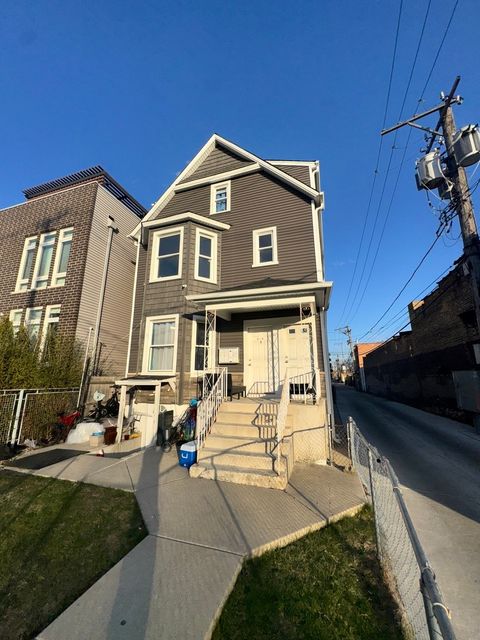
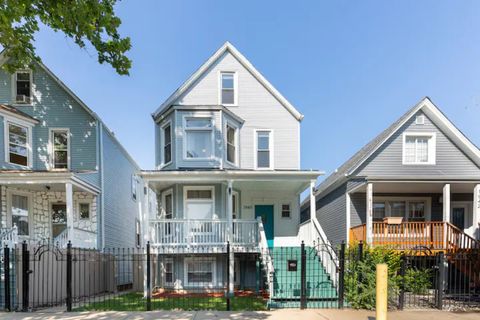
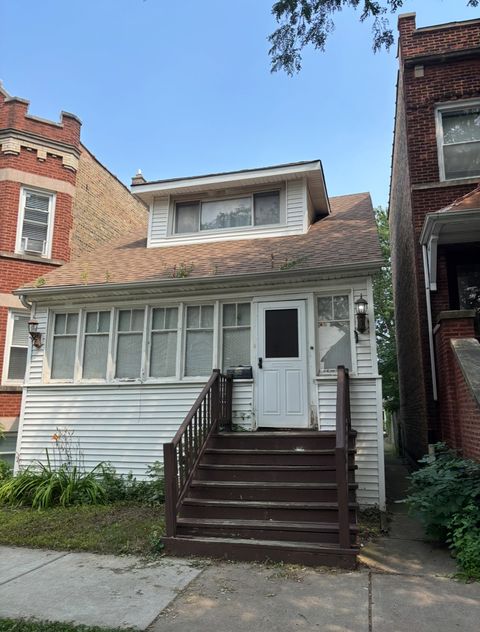
Active
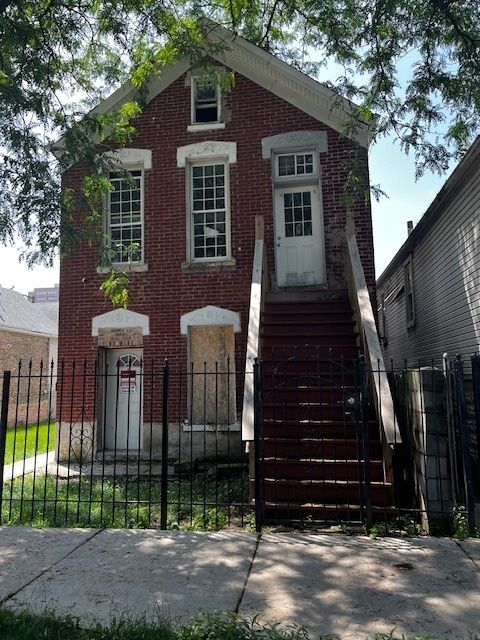
$120,000
4
bds
|
2
ba
|
1,914
sqft
|
built
1914
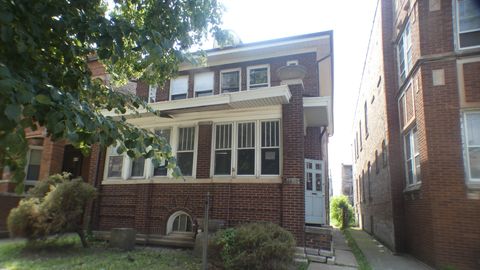
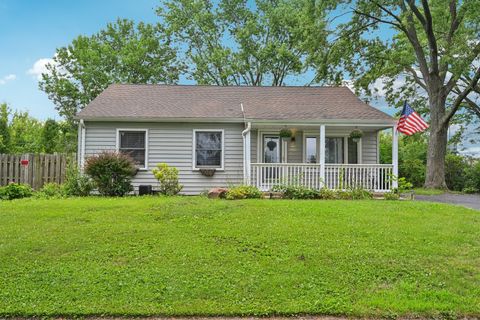
7916 S Elizabeth St, Chicago, IL 60620
$1,170
Cash flow
50.9%
Cash-on-Cash Return
17.4%
Cap rate
2.3%
Rent to Value Ratio
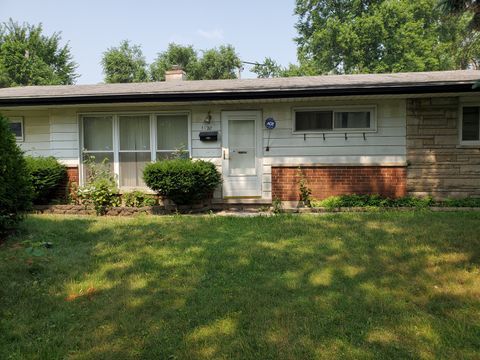
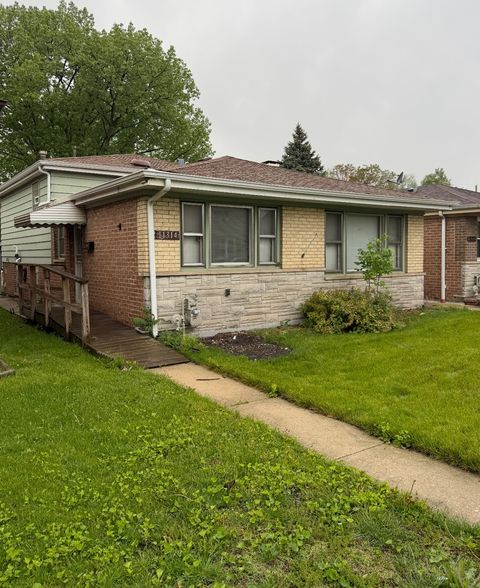
Active
$74,900
2
bds
|
1
ba
|
952
sqft
|
built
1910
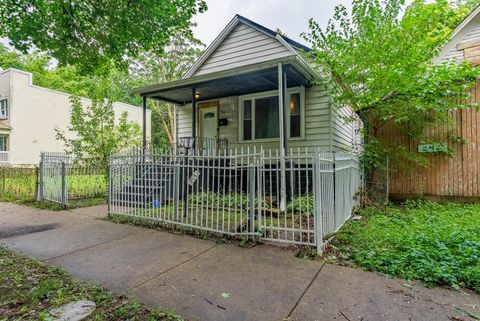
244 W 117th St, Chicago, IL 60628
$1,069
Cash flow
16.6%
Cash-on-Cash Return
17.1%
Cap rate
2.1%
Rent to Value Ratio
4,904 out of 5,692 properties for sale in Cook County
Limited Results Shown
Create a free account, or log in to reveal all property listings and enjoy the complete experience.
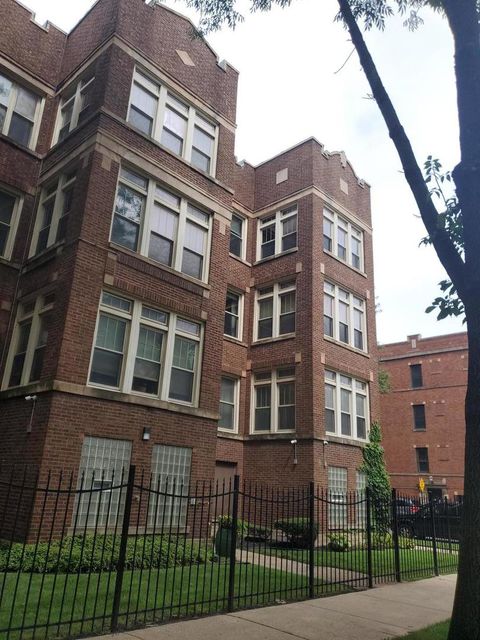
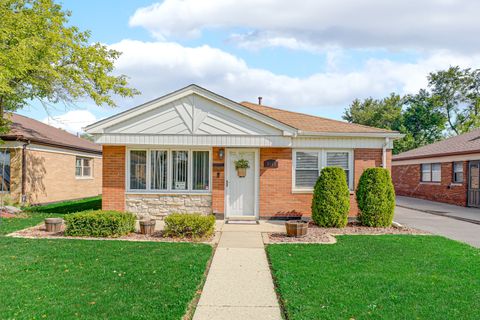
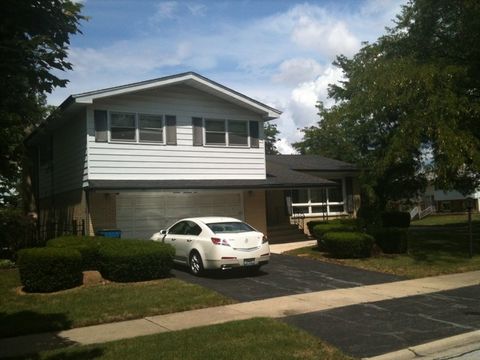
Active
$560,000
4
bds
|
4
ba
|
3,000
sqft
|
built
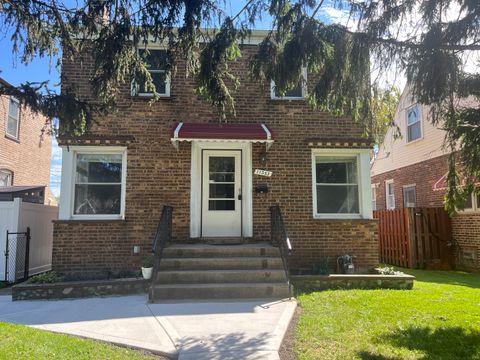
1926
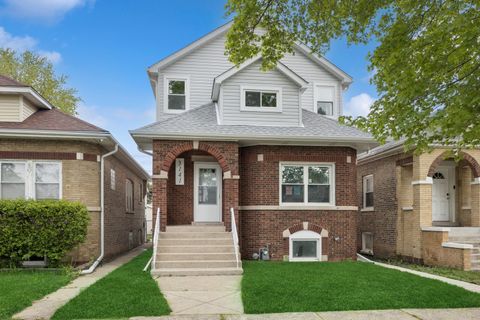
3141 Harvey Ave, Berwyn, IL 60402
$-1,787
Cash flow
-16.6%
Cash-on-Cash Return
1.8%
Cap rate
0.4%
Rent to Value Ratio
Active
$235,000
1
bds
|
1
ba
|
770
sqft
|
built
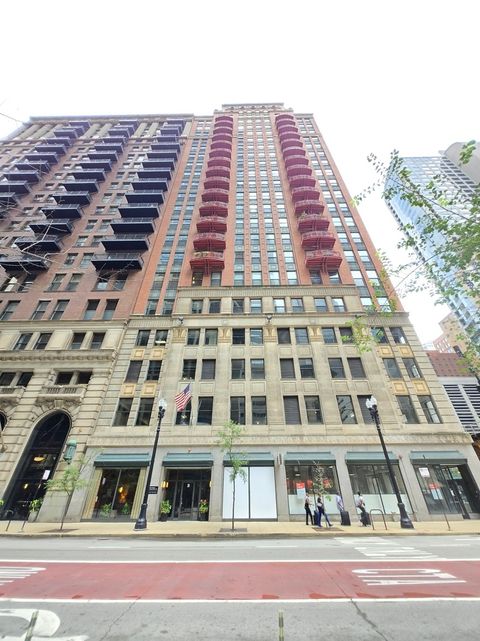
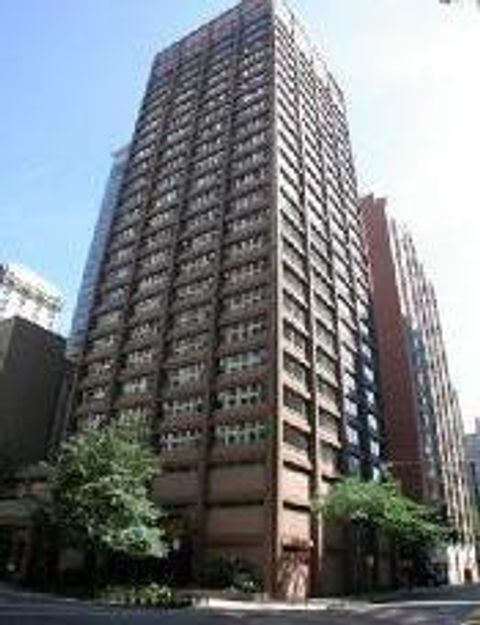
1989
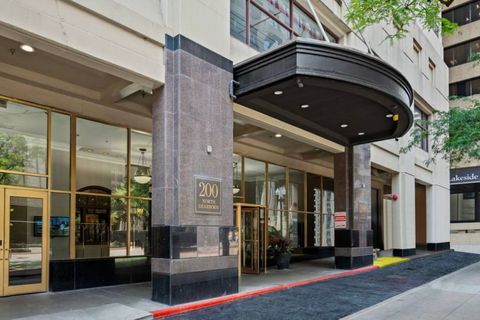
200 N Dearborn St, Chicago, IL 60601
$-772
Cash flow
-17.1%
Cash-on-Cash Return
1.7%
Cap rate
0.8%
Rent to Value Ratio
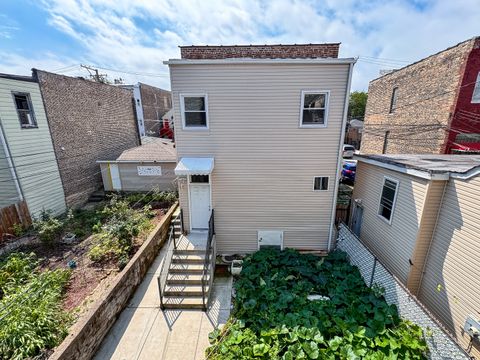
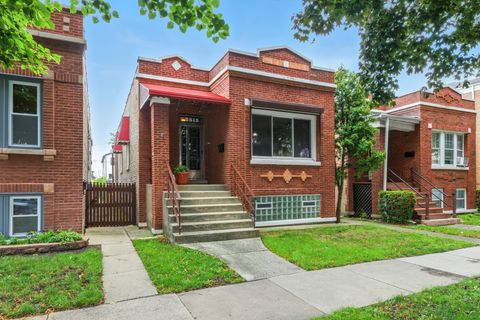
Active
$90,000
3
bds
|
2
ba
|
1,200
sqft
|
built
1924
2234 E 70th Pl, Chicago, IL 60649
$581
Cash flow
33.7%
Cash-on-Cash Return
13.4%
Cap rate
1.8%
Rent to Value Ratio
Active
$850,000
3
bds
|
1
ba
|
0
sqft
|
built
1889
235 W 23rd St, Chicago, IL 60616
$-2,748
Cash flow
-16.9%
Cash-on-Cash Return
1.8%
Cap rate
0.3%
Rent to Value Ratio
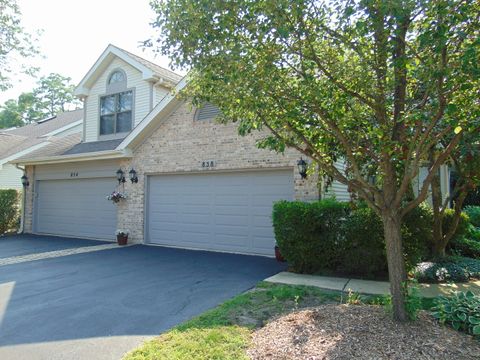
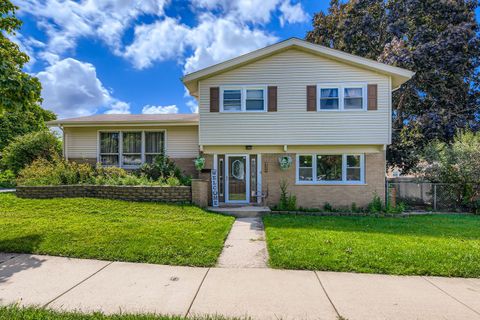
Active
$399,000
3
bds
|
4
ba
|
1,850
sqft
|
built
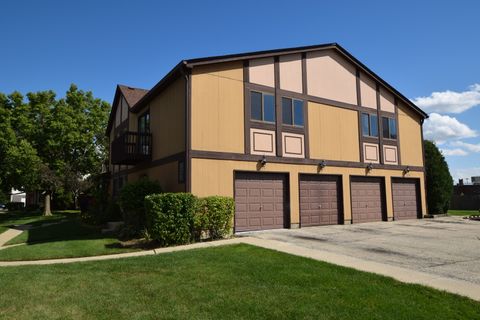
1988
858 N Auburn Woods Dr, Palatine, IL 60067
$-482
Cash flow
-6.3%
Cash-on-Cash Return
4.2%
Cap rate
0.8%
Rent to Value Ratio
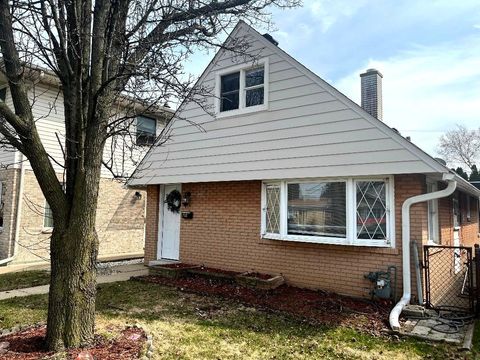
Active
$399,900
3
bds
|
1
ba
|
1,500
sqft
|
built
1951
7519 W Argyle St, Harwood Heights, IL 60706
$-639
Cash flow
-8.3%
Cash-on-Cash Return
3.8%
Cap rate
0.6%
Rent to Value Ratio
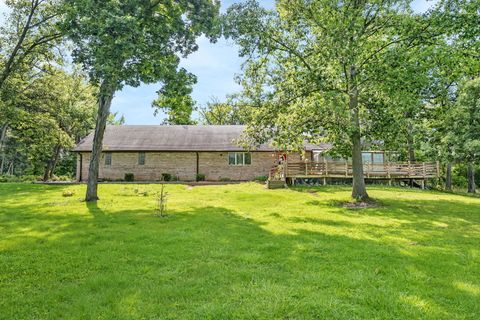
Active
$350,000
bds
|
0
ba
|
0
sqft
|
built
1880
2911 W 25th St, Chicago, IL 60623
$-610
Cash flow
-9.1%
Cash-on-Cash Return
3.6%
Cap rate
0.6%
Rent to Value Ratio
Active
$242,500
2
bds
|
1
ba
|
1,200
sqft
|
built
1987
1259 Inverrary Ln, Palatine, IL 60074
$-493
Cash flow
-10.6%
Cash-on-Cash Return
3.2%
Cap rate
0.7%
Rent to Value Ratio
Active
$360,000
3
bds
|
3
ba
|
2,584
sqft
|
built
1993
21400 Lisa Ln, Steger, IL 60475
$-500
Cash flow
-7.2%
Cash-on-Cash Return
4.0%
Cap rate
0.9%
Rent to Value Ratio

Active
$275,000
3
bds
|
2
ba
|
1,400
sqft
|
built
1912
1520 E Marquette Rd, Chicago, IL 60637
$-235
Cash flow
-4.5%
Cash-on-Cash Return
4.7%
Cap rate
0.8%
Rent to Value Ratio
Active
$365,000
2
bds
|
2
ba
|
1,380
sqft
|
built
1927
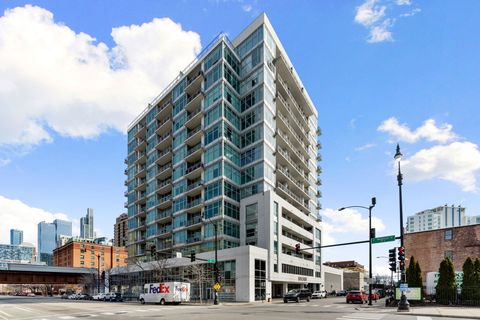
208 W Washington St, Chicago, IL 60606
$-1,434
Cash flow
-20.5%
Cash-on-Cash Return
1.0%
Cap rate
0.9%
Rent to Value Ratio
Active
$750,000
9
bds
|
4
ba
|
0
sqft
|
built
1908
5015 N Kimberly Ave, Chicago, IL 60630
$-2,113
Cash flow
-14.7%
Cash-on-Cash Return
2.3%
Cap rate
0.4%
Rent to Value Ratio
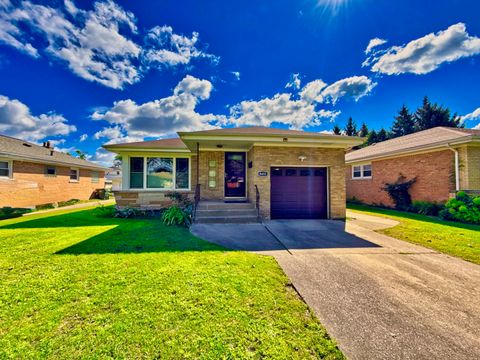
Active
$99,900
3
bds
|
2
ba
|
1,294
sqft
|
built
1956
1520 Lincoln Pl, Calumet City, IL 60409
$431
Cash flow
22.5%
Cash-on-Cash Return
10.9%
Cap rate
2.0%
Rent to Value Ratio
Active
$228,500
2
bds
|
1
ba
|
986
sqft
|
built
1952
3160 W Park Lane Dr, Merrionette Park, IL 60803
$-125
Cash flow
-2.9%
Cash-on-Cash Return
5.0%
Cap rate
0.8%
Rent to Value Ratio
Active
$450,000
2
bds
|
2
ba
|
1,057
sqft
|
built
1956
8451 N Oriole Ave, Niles, IL 60714
$-930
Cash flow
-10.8%
Cash-on-Cash Return
3.2%
Cap rate
0.6%
Rent to Value Ratio
Active
$830,000
8
bds
|
4
ba
|
0
sqft
|
built
1912
1940 N Monticello Ave, Chicago, IL 60647
$-2,178
Cash flow
-13.7%
Cash-on-Cash Return
2.5%
Cap rate
0.4%
Rent to Value Ratio
Active
$292,500
3
bds
|
3
ba
|
1,652
sqft
|
built
1970
16006 Avalon Ave, South Holland, IL 60473
$-11
Cash flow
-0.2%
Cash-on-Cash Return
5.6%
Cap rate
1.1%
Rent to Value Ratio
Active
$290,000
2
bds
|
2
ba
|
1,155
sqft
|
built
1920
2515 Highland Ave, Berwyn, IL 60402
$187
Cash flow
3.4%
Cash-on-Cash Return
6.5%
Cap rate
0.9%
Rent to Value Ratio
Active
$390,000
3
bds
|
2
ba
|
1,745
sqft
|
built
1966
4509 W 105th St, Oak Lawn, IL 60453
$-586
Cash flow
-7.8%
Cash-on-Cash Return
3.9%
Cap rate
0.7%
Rent to Value Ratio
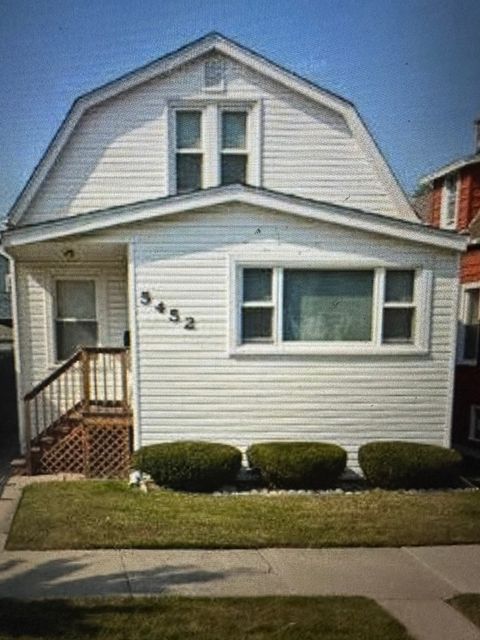
Active
$395,000
3
bds
|
1
ba
|
1,056
sqft
|
built
1918
5452 W Warwick Ave, Chicago, IL 60641
$-342
Cash flow
-4.5%
Cash-on-Cash Return
4.6%
Cap rate
0.7%
Rent to Value Ratio
Active
$159,900
2
bds
|
2
ba
|
1,217
sqft
|
built
1953
9601 S Perry Ave, Chicago, IL 60628
$696
Cash flow
22.7%
Cash-on-Cash Return
10.9%
Cap rate
1.4%
Rent to Value Ratio
Active
$295,000
2
bds
|
3
ba
|
2,005
sqft
|
built
1948
1719 E 86th St, Chicago, IL 60617
$176
Cash flow
3.1%
Cash-on-Cash Return
6.4%
Cap rate
0.8%
Rent to Value Ratio
Active
$460,000
4
bds
|
2
ba
|
1,751
sqft
|
built
1950
2109 N 74th Ave, Elmwood Park, IL 60707
$-1,328
Cash flow
-15.1%
Cash-on-Cash Return
2.2%
Cap rate
0.5%
Rent to Value Ratio
Active
$799,999
3
bds
|
2
ba
|
0
sqft
|
built
2008
50 E 16th St, Chicago, IL 60616
$-1,570
Cash flow
-10.2%
Cash-on-Cash Return
3.3%
Cap rate
0.8%
Rent to Value Ratio
Active
$348,000
2
bds
|
2
ba
|
1,260
sqft
|
built
1963
247 E Chestnut St, Chicago, IL 60611
$-989
Cash flow
-14.8%
Cash-on-Cash Return
2.3%
Cap rate
1.0%
Rent to Value Ratio
Active
$255,900
2
bds
|
1
ba
|
972
sqft
|
built
1947
11353 S Ewing Ave, Chicago, IL 60617
$-145
Cash flow
-3.0%
Cash-on-Cash Return
5.0%
Cap rate
0.7%
Rent to Value Ratio
Active
$359,000
3
bds
|
2
ba
|
1,100
sqft
|
built
1961
1005 E Lilac Dr, Palatine, IL 60074
$-457
Cash flow
-6.6%
Cash-on-Cash Return
4.2%
Cap rate
0.7%
Rent to Value Ratio
Active
$295,000
4
bds
|
2
ba
|
1,810
sqft
|
built
1951
3526 W 80th Pl, Chicago, IL 60652
$276
Cash flow
4.9%
Cash-on-Cash Return
6.8%
Cap rate
0.9%
Rent to Value Ratio
Active
$226,500
3
bds
|
2
ba
|
1,032
sqft
|
built
1971
11314 S Green Bay Ave, Chicago, IL 60617
$184
Cash flow
4.2%
Cash-on-Cash Return
6.7%
Cap rate
0.9%
Rent to Value Ratio
Active
$400,000
3
bds
|
2
ba
|
1,650
sqft
|
built
1914
3911 N Saint Louis Ave, Chicago, IL 60618
$-369
Cash flow
-4.8%
Cash-on-Cash Return
4.6%
Cap rate
0.7%
Rent to Value Ratio
Active
$275,000
3
bds
|
3
ba
|
827
sqft
|
built
1907
6636 S Wood St, Chicago, IL 60636
$-59
Cash flow
-1.1%
Cash-on-Cash Return
5.4%
Cap rate
0.7%
Rent to Value Ratio
Active
$560,000
3
bds
|
2
ba
|
3,100
sqft
|
built
1926
4910 N Kenneth Ave, Chicago, IL 60630
$-983
Cash flow
-9.2%
Cash-on-Cash Return
3.6%
Cap rate
0.6%
Rent to Value Ratio
Active
$204,900
2
bds
|
2
ba
|
0
sqft
|
built
1978
900 Perrie Dr, Elk Grove Village, IL 60007
$-285
Cash flow
-7.3%
Cash-on-Cash Return
4.0%
Cap rate
0.9%
Rent to Value Ratio
Active
$344,900
3
bds
|
2
ba
|
1,160
sqft
|
built
1976
1127 Highbury Dr, Elgin, IL 60120
$-414
Cash flow
-6.3%
Cash-on-Cash Return
4.2%
Cap rate
0.7%
Rent to Value Ratio
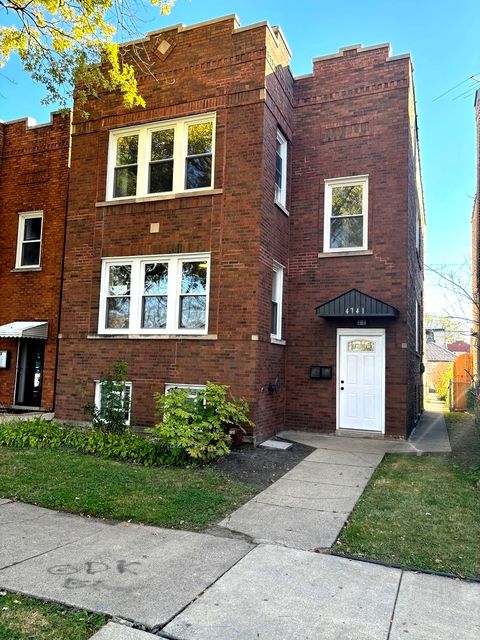
Active
$699,500
4
bds
|
2
ba
|
0
sqft
|
built
1926
4741 N Keating Ave, Chicago, IL 60630
$-1,982
Cash flow
-14.8%
Cash-on-Cash Return
2.3%
Cap rate
0.4%
Rent to Value Ratio
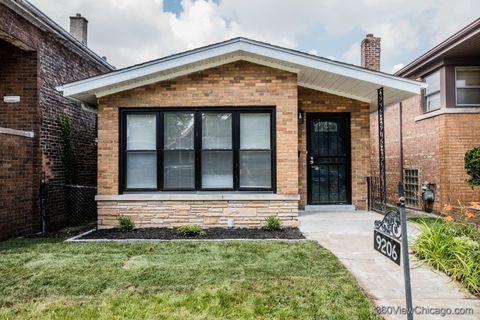
Active
$209,900
2
bds
|
2
ba
|
1,000
sqft
|
built
1957
9206 S Yates Blvd, Chicago, IL 60617
$-4
Cash flow
-0.1%
Cash-on-Cash Return
5.7%
Cap rate
0.8%
Rent to Value Ratio
Active
$250,000
3
bds
|
2
ba
|
1,580
sqft
|
built
1916
5202 S Ingleside Ave, Chicago, IL 60615
$-195
Cash flow
-4.1%
Cash-on-Cash Return
4.7%
Cap rate
1.0%
Rent to Value Ratio
Active
$599,900
3
bds
|
3
ba
|
2,500
sqft
|
built
1956
6335 N Central Park Ave, Chicago, IL 60659
$-714
Cash flow
-6.2%
Cash-on-Cash Return
4.3%
Cap rate
0.7%
Rent to Value Ratio