Cook County Investment Properties for Sale
Browse homes for sale and investment properties in Cook County. Refine your search by price, property type, or more.
Best cash flowing properties in Cook County
Active
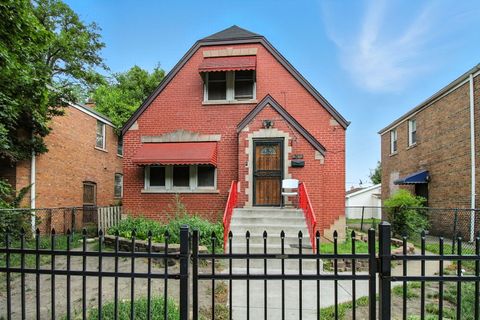
$190,000
3
bds
|
3
ba
|
1,440
sqft
|
built
1950
12473 S Wabash Ave, Chicago, IL 60628
$529
Cash flow
14.5%
Cash-on-Cash Return
9.0%
Cap rate
1.2%
Rent to Value Ratio
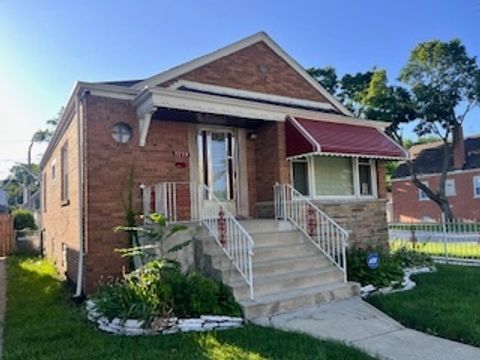
Active
$189,900
2
bds
|
1
ba
|
1,300
sqft
|
built
1952
7759 S Wood St, Chicago, IL 60620
$463
Cash flow
12.7%
Cash-on-Cash Return
8.6%
Cap rate
1.1%
Rent to Value Ratio
4,904 out of 5,692 properties for sale in Cook County
Limited Results Shown
Create a free account, or log in to reveal all property listings and enjoy the complete experience.
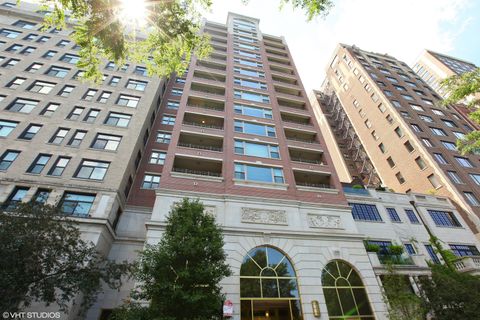
Active
$2,750,000
3
bds
|
4
ba
|
3,100
sqft
|
built
2000
2120 N Lincoln Park W, Chicago, IL 60614
$-18,170
Cash flow
-34.5%
Cash-on-Cash Return
-2.2%
Cap rate
0.2%
Rent to Value Ratio
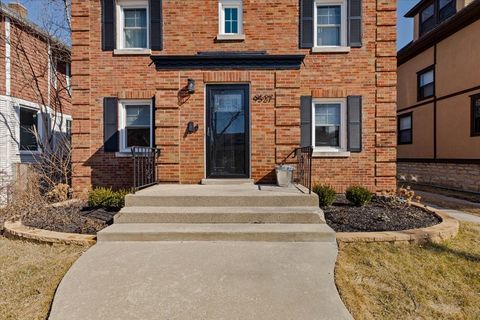
Active
$424,000
3
bds
|
2
ba
|
1,569
sqft
|
built
1944
9527 S Damen Ave, Chicago, IL 60643
$-328
Cash flow
-4.0%
Cash-on-Cash Return
4.8%
Cap rate
0.8%
Rent to Value Ratio
Active
$1,100,000
7
bds
|
4
ba
|
0
sqft
|
built
1890
2707 N Richmond St, Chicago, IL 60647
$-4,400
Cash flow
-20.9%
Cash-on-Cash Return
0.9%
Cap rate
0.2%
Rent to Value Ratio
Active
$324,900
3
bds
|
2
ba
|
960
sqft
|
built
1911
919 N Karlov Ave, Chicago, IL 60651
$-244
Cash flow
-3.9%
Cash-on-Cash Return
4.8%
Cap rate
0.7%
Rent to Value Ratio
Active
$275,000
3
bds
|
1
ba
|
1,050
sqft
|
built
1958
4857 S Lorel Ave, Chicago, IL 60638
$283
Cash flow
5.4%
Cash-on-Cash Return
6.9%
Cap rate
0.8%
Rent to Value Ratio
Active
$429,900
2
bds
|
2
ba
|
1,121
sqft
|
built
1959
7505 N Oconto Ave, Chicago, IL 60631
$-648
Cash flow
-7.9%
Cash-on-Cash Return
3.9%
Cap rate
0.7%
Rent to Value Ratio
Active
$459,000
2
bds
|
2
ba
|
0
sqft
|
built
2007
10 S Dunton Ave, Arlington Heights, IL 60005
$-1,985
Cash flow
-22.6%
Cash-on-Cash Return
0.5%
Cap rate
0.5%
Rent to Value Ratio
Active
$469,900
4
bds
|
3
ba
|
2,271
sqft
|
built
1992
629 Dogleg Ln, Bartlett, IL 60103
$-915
Cash flow
-10.2%
Cash-on-Cash Return
3.3%
Cap rate
0.7%
Rent to Value Ratio
Active
$325,000
3
bds
|
2
ba
|
1,224
sqft
|
built
1951
248 E Lyndale Ave, Northlake, IL 60164
$-232
Cash flow
-3.7%
Cash-on-Cash Return
4.8%
Cap rate
0.9%
Rent to Value Ratio
Active
$570,000
4
bds
|
4
ba
|
3,000
sqft
|
built
1986
14467 Creekview Dr, Orland Park, IL 60467
$-567
Cash flow
-5.2%
Cash-on-Cash Return
4.5%
Cap rate
0.7%
Rent to Value Ratio
Active
$625,000
2
bds
|
3
ba
|
2,340
sqft
|
built
1981
3741 Mission Hills Rd, Northbrook, IL 60062
$-2,260
Cash flow
-18.9%
Cash-on-Cash Return
1.3%
Cap rate
0.5%
Rent to Value Ratio
Active
$364,900
4
bds
|
2
ba
|
1,438
sqft
|
built
1964
1505 Cypress Ct, Hanover Park, IL 60133
$-228
Cash flow
-3.3%
Cash-on-Cash Return
4.9%
Cap rate
0.7%
Rent to Value Ratio
Active
$249,900
1
bds
|
1
ba
|
1,175
sqft
|
built
2001
190 N Milwaukee Ave, Wheeling, IL 60090
$-525
Cash flow
-11.0%
Cash-on-Cash Return
3.2%
Cap rate
0.8%
Rent to Value Ratio
Active
$259,000
2
bds
|
2
ba
|
0
sqft
|
built
1966
5601 N Sheridan Rd, Chicago, IL 60660
$-803
Cash flow
-16.2%
Cash-on-Cash Return
2.0%
Cap rate
1.1%
Rent to Value Ratio
Active
$724,900
4
bds
|
3
ba
|
2,270
sqft
|
built
1978
9 The Court Of Lagoon Vw, Northbrook, IL 60062
$-1,761
Cash flow
-12.7%
Cash-on-Cash Return
2.8%
Cap rate
0.6%
Rent to Value Ratio
Active
$320,000
3
bds
|
2
ba
|
1,032
sqft
|
built
1958
7723 Melvina Ave, Burbank, IL 60459
$-38
Cash flow
-0.6%
Cash-on-Cash Return
5.5%
Cap rate
0.8%
Rent to Value Ratio
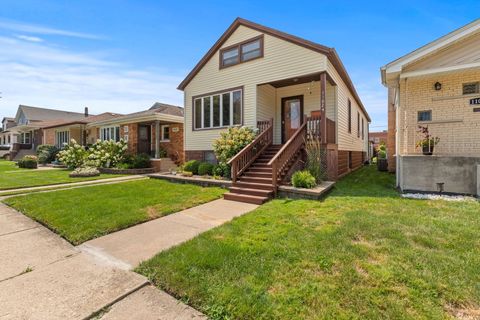
Active
$192,000
4
bds
|
2
ba
|
1,452
sqft
|
built
1953
14808 Dorchester Ave, Dolton, IL 60419
$192
Cash flow
5.2%
Cash-on-Cash Return
6.9%
Cap rate
1.2%
Rent to Value Ratio
Active
$519,900
4
bds
|
3
ba
|
2,230
sqft
|
built
1953
3919 N Oriole Ave, Chicago, IL 60634
$-704
Cash flow
-7.1%
Cash-on-Cash Return
4.1%
Cap rate
0.6%
Rent to Value Ratio
Active
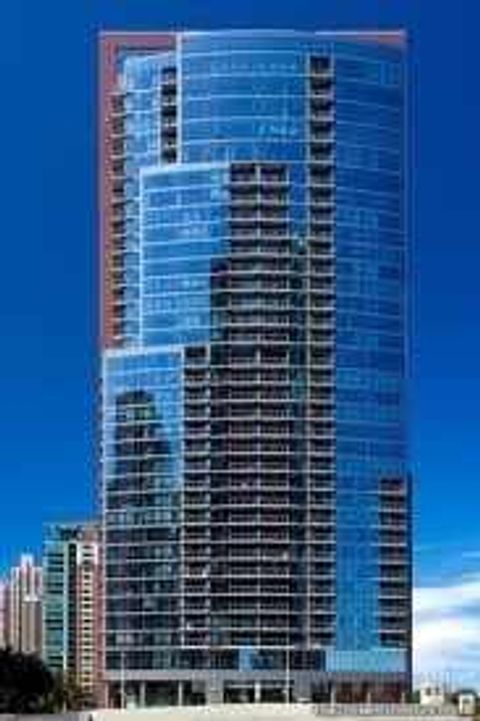
$1,040,000
3
bds
|
3
ba
|
1,900
sqft
|
built
2007
450 E Waterside Dr, Chicago, IL 60601
$-3,274
Cash flow
-16.4%
Cash-on-Cash Return
1.9%
Cap rate
0.6%
Rent to Value Ratio
Active
$329,900
3
bds
|
2
ba
|
1,068
sqft
|
built
1929
11024 S Spaulding Ave, Chicago, IL 60655
$106
Cash flow
1.7%
Cash-on-Cash Return
6.1%
Cap rate
0.8%
Rent to Value Ratio
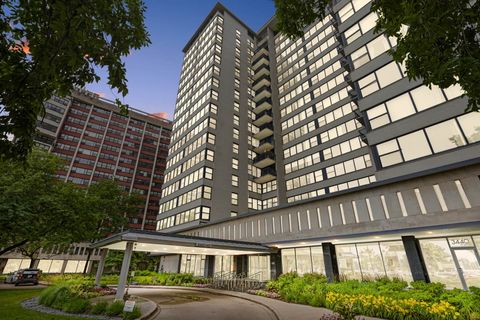
Active
$309,900
2
bds
|
2
ba
|
1,250
sqft
|
built
1974
3430 N Lake Shore Dr, Chicago, IL 60657
$-1,286
Cash flow
-21.7%
Cash-on-Cash Return
0.7%
Cap rate
0.9%
Rent to Value Ratio
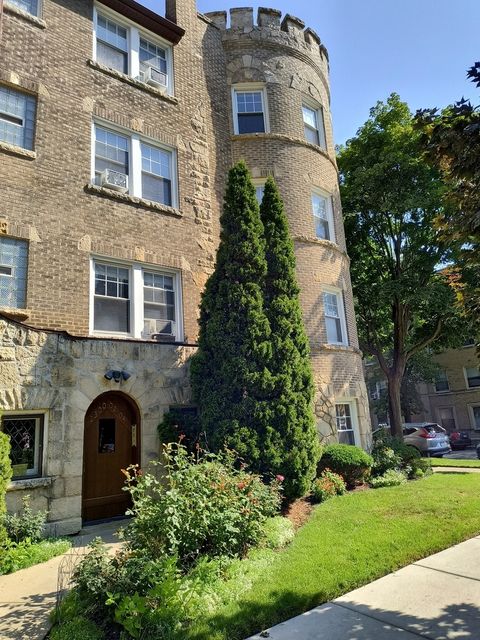
Active
$198,000
2
bds
|
1
ba
|
1,200
sqft
|
built
1929
2300 W Farwell Ave, Chicago, IL 60645
$-244
Cash flow
-6.4%
Cash-on-Cash Return
4.2%
Cap rate
0.9%
Rent to Value Ratio
Active
$520,000
2
bds
|
2
ba
|
1,445
sqft
|
built
2001
512 N Mc Clurg Ct, Chicago, IL 60611
$-1,396
Cash flow
-14.0%
Cash-on-Cash Return
2.5%
Cap rate
0.7%
Rent to Value Ratio
Active
$430,000
2
bds
|
1
ba
|
1,215
sqft
|
built
1948
4631 N Lawler Ave, Chicago, IL 60630
$-34
Cash flow
-0.4%
Cash-on-Cash Return
5.6%
Cap rate
0.7%
Rent to Value Ratio
Active
$1,175,000
6
bds
|
6
ba
|
0
sqft
|
built
2007
1836 S Carpenter St, Chicago, IL 60608
$-3,713
Cash flow
-16.5%
Cash-on-Cash Return
1.9%
Cap rate
0.3%
Rent to Value Ratio
Active
$355,000
3
bds
|
2
ba
|
1,054
sqft
|
built
1954
5036 S Leclaire Ave, Chicago, IL 60638
$-240
Cash flow
-3.5%
Cash-on-Cash Return
4.9%
Cap rate
0.7%
Rent to Value Ratio
Active
$205,000
1
bds
|
1
ba
|
780
sqft
|
built
1976
200 Lake Blvd, Buffalo Grove, IL 60089
$-411
Cash flow
-10.5%
Cash-on-Cash Return
3.3%
Cap rate
1.0%
Rent to Value Ratio
Active
$260,000
3
bds
|
2
ba
|
1,382
sqft
|
built
1957
830 Latimer Ln, Flossmoor, IL 60422
$61
Cash flow
1.2%
Cash-on-Cash Return
6.0%
Cap rate
1.1%
Rent to Value Ratio
Active
$251,000
3
bds
|
2
ba
|
1,272
sqft
|
built
1971
3454 E 170th St, Lansing, IL 60438
$-418
Cash flow
-8.7%
Cash-on-Cash Return
3.7%
Cap rate
0.8%
Rent to Value Ratio
Active
$189,900
1
bds
|
1
ba
|
850
sqft
|
built
1969
141 N La Grange Rd, La Grange, IL 60525
$-413
Cash flow
-11.3%
Cash-on-Cash Return
3.1%
Cap rate
0.9%
Rent to Value Ratio
Active
$175,000
0
bds
|
1
ba
|
0
sqft
|
built
1968
1 E Scott St, Chicago, IL 60610
$-552
Cash flow
-16.5%
Cash-on-Cash Return
1.9%
Cap rate
0.9%
Rent to Value Ratio
Active
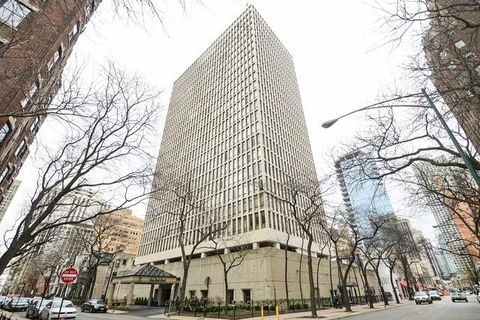
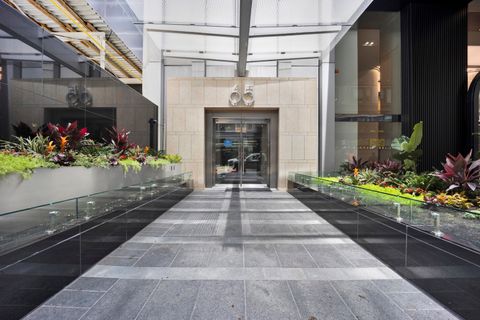
$359,000
1
bds
|
2
ba
|
1,092
sqft
|
built
2008
65 E Monroe St, Chicago, IL 60603
$-1,543
Cash flow
-22.4%
Cash-on-Cash Return
0.5%
Cap rate
0.8%
Rent to Value Ratio
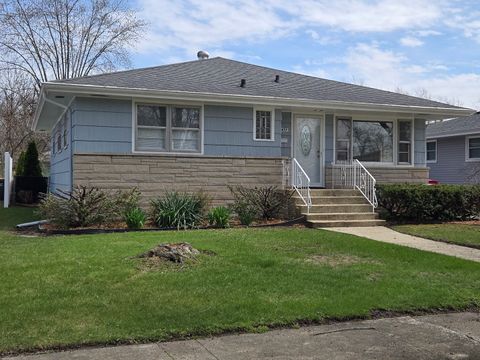
Active
$259,000
3
bds
|
3
ba
|
2,028
sqft
|
built
1960
18433 Arcadia Ave, Lansing, IL 60438
$-381
Cash flow
-7.7%
Cash-on-Cash Return
3.9%
Cap rate
0.8%
Rent to Value Ratio
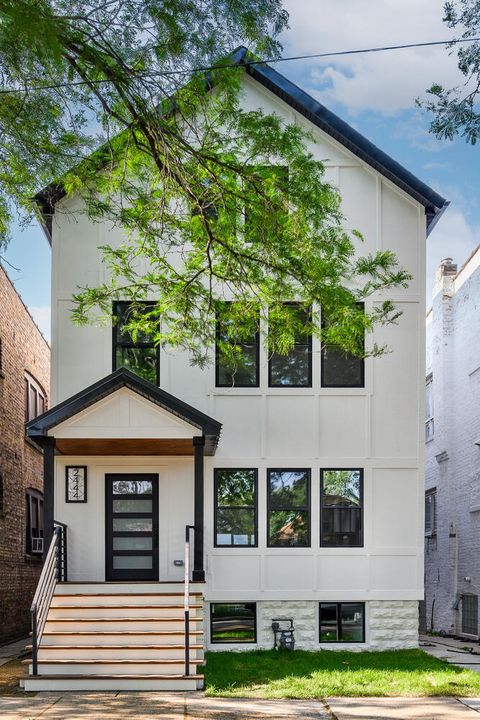
Active
$1,475,000
5
bds
|
5
ba
|
4,194
sqft
|
built
1903
2444 W Dakin St, Chicago, IL 60618
$-3,284
Cash flow
-11.6%
Cash-on-Cash Return
3.0%
Cap rate
0.5%
Rent to Value Ratio
Active
$499,999
2
bds
|
1
ba
|
1,232
sqft
|
built
1996
1330 W Monroe St, Chicago, IL 60607
$-1,326
Cash flow
-13.8%
Cash-on-Cash Return
2.5%
Cap rate
0.6%
Rent to Value Ratio
Active
$205,000
2
bds
|
1
ba
|
1,000
sqft
|
built
1963
920 Beau Dr, Des Plaines, IL 60016
$-457
Cash flow
-11.6%
Cash-on-Cash Return
3.0%
Cap rate
0.9%
Rent to Value Ratio
Active
$775,000
5
bds
|
3
ba
|
2,600
sqft
|
built
1935
9305 S Hoyne Ave, Chicago, IL 60643
$-1,296
Cash flow
-8.7%
Cash-on-Cash Return
3.7%
Cap rate
0.6%
Rent to Value Ratio
Active
$260,000
3
bds
|
2
ba
|
1,575
sqft
|
built
1954
934 W Vermont Ave, Chicago, IL 60643
$449
Cash flow
9.0%
Cash-on-Cash Return
7.7%
Cap rate
1.0%
Rent to Value Ratio