Cook County Investment Properties for Sale
Browse homes for sale and investment properties in Cook County. Refine your search by price, property type, or more.
Best cash flowing properties in Cook County
Active
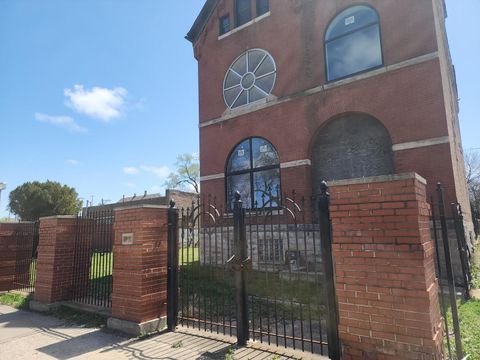
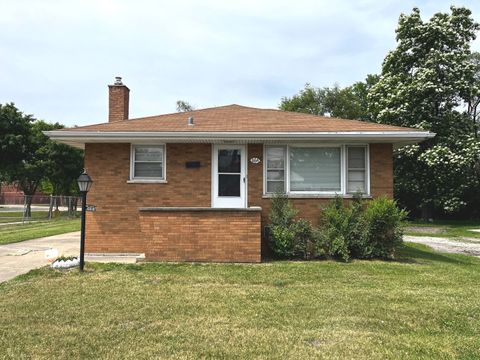
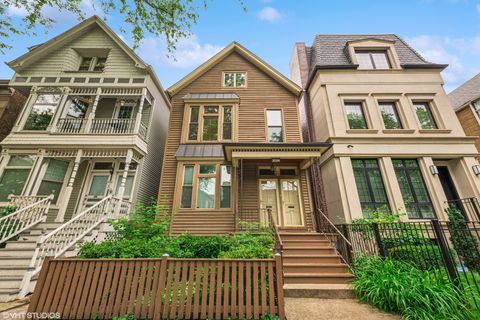
$199,900
6
bds
|
3
ba
|
2,972
sqft
|
built
1875
311 W Garfield Blvd, Chicago, IL 60621
$1,212
Cash flow
31.6%
Cash-on-Cash Return
13.5%
Cap rate
1.8%
Rent to Value Ratio

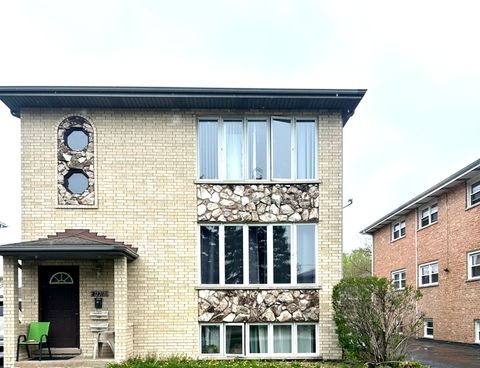
Active
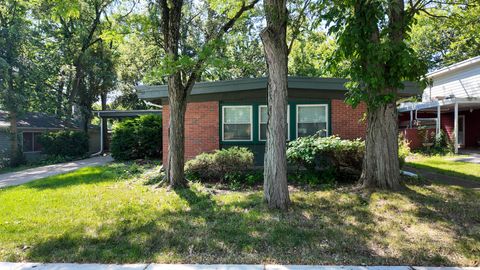
$159,000
3
bds
|
2
ba
|
1,156
sqft
|
built
1969
638 Hoxie Ave, Calumet City, IL 60409
$766
Cash flow
25.1%
Cash-on-Cash Return
11.5%
Cap rate
1.4%
Rent to Value Ratio
6,804 out of 8,365 properties for sale in Cook County
Limited Results Shown
Create a free account, or log in to reveal all property listings and enjoy the complete experience.

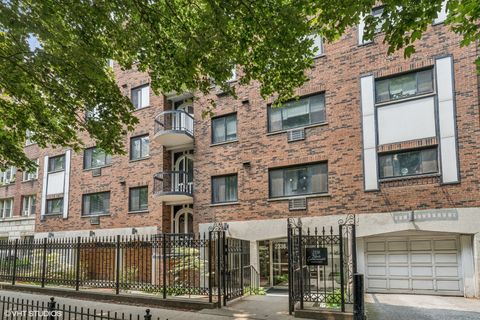
Active
$600,000
4
bds
|
3
ba
|
2,442
sqft
|
built
1965
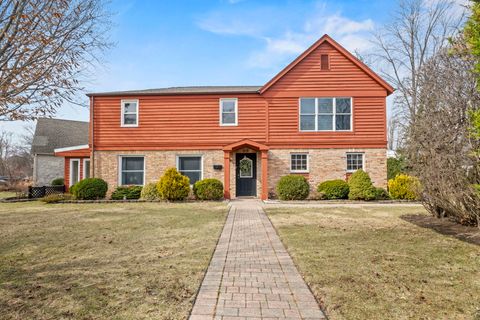
2006 N Burke Dr, Arlington Heights, IL 60004
$-1,170
Cash flow
-10.2%
Cash-on-Cash Return
3.3%
Cap rate
0.6%
Rent to Value Ratio
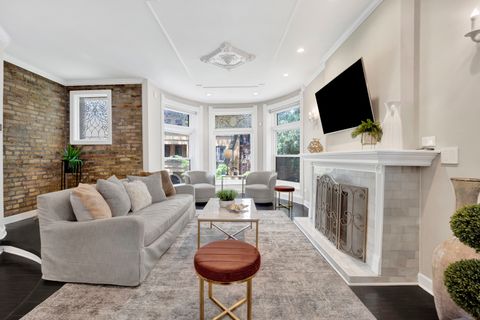
Active
$579,900
4
bds
|
3
ba
|
2,538
sqft
|
built
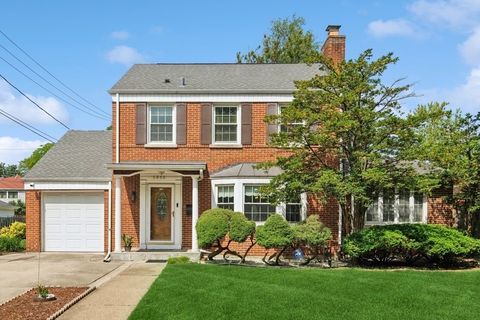
1953
816 E Mayfair Rd, Arlington Heights, IL 60005
$-1,569
Cash flow
-14.1%
Cash-on-Cash Return
3.0%
Cap rate
0.7%
Rent to Value Ratio
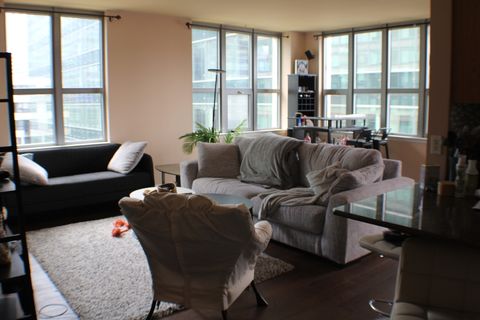
Active
$449,000
2
bds
|
1
ba
|
1,150
sqft
|
built
1916
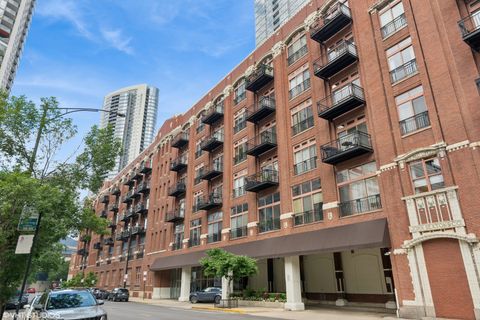
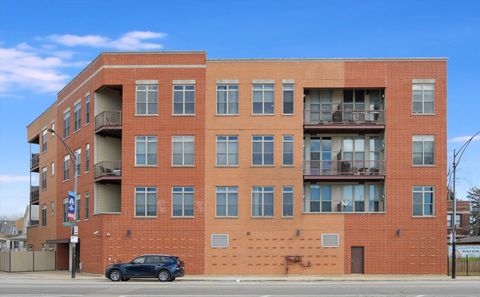
360 W Illinois St, Chicago, IL 60654
$-1,575
Cash flow
-18.3%
Cash-on-Cash Return
2.1%
Cap rate
0.7%
Rent to Value Ratio
Active
$425,000
3
bds
|
2
ba
|
1,448
sqft
|
built
2008
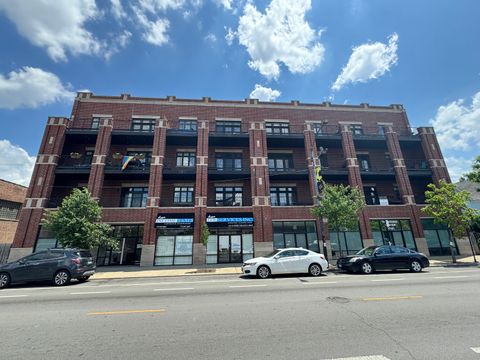
4141 N Kedzie Ave, Chicago, IL 60618
$-1,241
Cash flow
-15.2%
Cash-on-Cash Return
2.8%
Cap rate
0.7%
Rent to Value Ratio
Active
$232,000
4
bds
|
3
ba
|
1,860
sqft
|
built
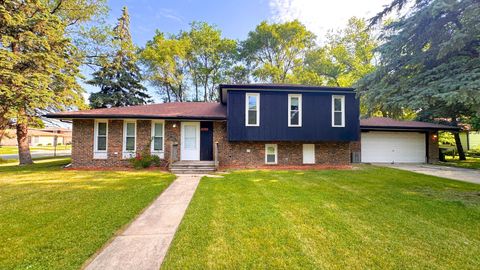
1974
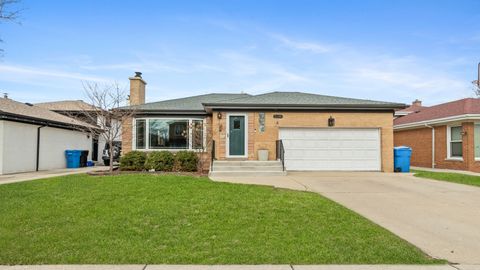
15755 Madison Ave, Dolton, IL 60419
$-60
Cash flow
-1.3%
Cash-on-Cash Return
5.4%
Cap rate
1.1%
Rent to Value Ratio
Active
$250,000
3
bds
|
3
ba
|
1,422
sqft
|
built
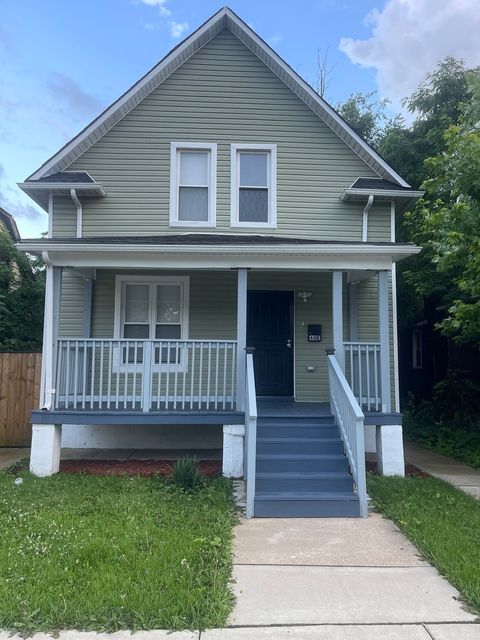
1903
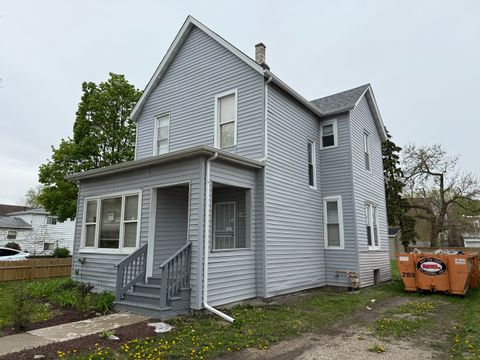
48 E 154th St, Harvey, IL 60426
$57
Cash flow
1.2%
Cash-on-Cash Return
6.0%
Cap rate
0.9%
Rent to Value Ratio

Active
$214,914
2
bds
|
1
ba
|
1,015
sqft
|
built
1955
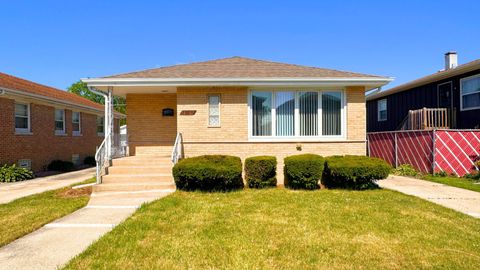
9244 S Sacramento Ave, Evergreen Park, IL 60805
$67
Cash flow
1.6%
Cash-on-Cash Return
6.1%
Cap rate
1.1%
Rent to Value Ratio
Active
$382,900
2
bds
|
2
ba
|
1,375
sqft
|
built
2007
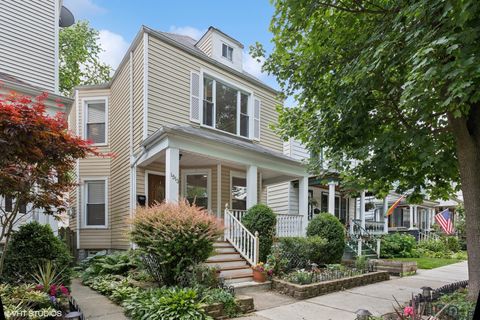
3637 N Spaulding Ave, Chicago, IL 60618
$-1,013
Cash flow
-13.8%
Cash-on-Cash Return
2.5%
Cap rate
0.7%
Rent to Value Ratio
Active
$199,900
6
bds
|
3
ba
|
2,972
sqft
|
built
1875
311 W Garfield Blvd, Chicago, IL 60621
$1,212
Cash flow
31.6%
Cash-on-Cash Return
13.5%
Cap rate
1.8%
Rent to Value Ratio
Active
$749,900
4
bds
|
3
ba
|
2,706
sqft
|
built
1942
5950 N Kostner Ave, Chicago, IL 60646
$-2,043
Cash flow
-14.2%
Cash-on-Cash Return
3.0%
Cap rate
0.6%
Rent to Value Ratio
Active
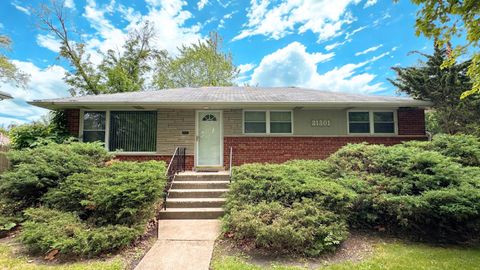
$205,000
3
bds
|
2
ba
|
1,300
sqft
|
built
1958
21301 Tower Ave, Matteson, IL 60443
$260
Cash flow
6.6%
Cash-on-Cash Return
7.2%
Cap rate
1.2%
Rent to Value Ratio
Active
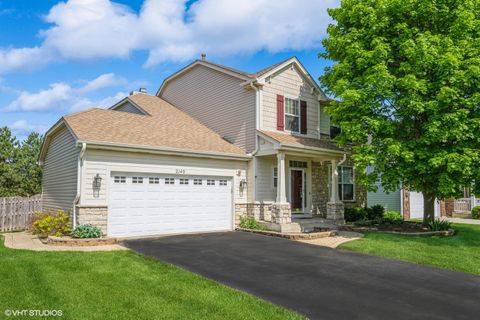
$550,000
4
bds
|
3
ba
|
2,384
sqft
|
built
2000
2140 Colchester Ct, Hoffman Estates, IL 60192
$-1,050
Cash flow
-10.0%
Cash-on-Cash Return
3.4%
Cap rate
0.6%
Rent to Value Ratio
Active
$392,000
3
bds
|
2
ba
|
1,100
sqft
|
built
1967
814 Surrey Dr, Streamwood, IL 60107
$-717
Cash flow
-9.5%
Cash-on-Cash Return
3.5%
Cap rate
0.6%
Rent to Value Ratio
Active
$110,000
2
bds
|
2
ba
|
1,000
sqft
|
built
1972
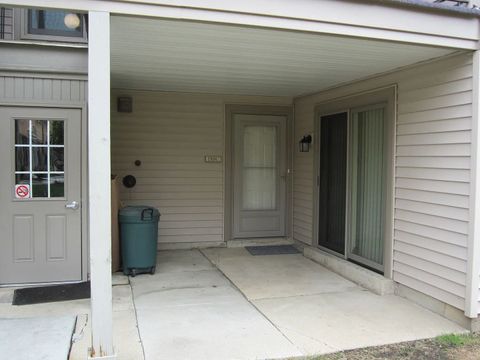
200 Park Ave, Calumet City, IL 60409
$153
Cash flow
7.3%
Cash-on-Cash Return
7.4%
Cap rate
1.6%
Rent to Value Ratio
Active
$226,000
3
bds
|
2
ba
|
1,325
sqft
|
built
1963
664 E 142nd St, Dolton, IL 60419
$-181
Cash flow
-4.2%
Cash-on-Cash Return
4.7%
Cap rate
1.1%
Rent to Value Ratio
Active
$460,000
8
bds
|
5
ba
|
0
sqft
|
built
1990
12211 S Spencer St, Alsip, IL 60803
$-1,681
Cash flow
-19.1%
Cash-on-Cash Return
1.3%
Cap rate
0.5%
Rent to Value Ratio
Active
$215,000
1
bds
|
1
ba
|
700
sqft
|
built
1967
2336 N Commonwealth Ave, Chicago, IL 60614
$-251
Cash flow
-6.1%
Cash-on-Cash Return
4.3%
Cap rate
0.9%
Rent to Value Ratio

Active
$624,900
3
bds
|
4
ba
|
2,688
sqft
|
built
1940
5443 S Rutherford Ave, Chicago, IL 60638
$-1,777
Cash flow
-14.8%
Cash-on-Cash Return
2.3%
Cap rate
0.4%
Rent to Value Ratio
Active
$949,900
3
bds
|
2
ba
|
0
sqft
|
built
1925
435 W Roslyn Pl, Chicago, IL 60614
$-3,618
Cash flow
-19.9%
Cash-on-Cash Return
1.7%
Cap rate
0.5%
Rent to Value Ratio
Active
$995,000
3
bds
|
3
ba
|
0
sqft
|
built
1890
3724 N Bosworth Ave, Chicago, IL 60613
$-3,926
Cash flow
-20.6%
Cash-on-Cash Return
1.5%
Cap rate
0.4%
Rent to Value Ratio
Active
$450,000
2
bds
|
2
ba
|
1,370
sqft
|
built
2003
125 S Jefferson St, Chicago, IL 60661
$-1,400
Cash flow
-16.2%
Cash-on-Cash Return
2.5%
Cap rate
0.8%
Rent to Value Ratio
Active
$206,000
4
bds
|
2
ba
|
1,691
sqft
|
built
1955
335 Oakwood St, Park Forest, IL 60466
$-97
Cash flow
-2.5%
Cash-on-Cash Return
5.1%
Cap rate
1.2%
Rent to Value Ratio
Active
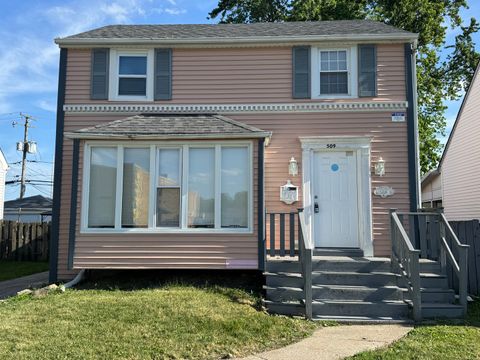
$241,000
3
bds
|
2
ba
|
1,176
sqft
|
built
1948
509 E 161st Pl, South Holland, IL 60473
$149
Cash flow
3.2%
Cash-on-Cash Return
6.4%
Cap rate
1.1%
Rent to Value Ratio
Active
$1,450,000
3
bds
|
3
ba
|
3,000
sqft
|
built
2003
1720 Maple Ave, Evanston, IL 60201
$-4,664
Cash flow
-16.8%
Cash-on-Cash Return
1.8%
Cap rate
0.6%
Rent to Value Ratio
Active
$227,000
3
bds
|
1
ba
|
1,168
sqft
|
built
1949
18052 Commercial Ave, Lansing, IL 60438
$-194
Cash flow
-4.5%
Cash-on-Cash Return
4.7%
Cap rate
0.9%
Rent to Value Ratio
Active
$325,000
2
bds
|
2
ba
|
1,290
sqft
|
built
2006
3450 S Halsted St, Chicago, IL 60608
$-833
Cash flow
-13.4%
Cash-on-Cash Return
3.2%
Cap rate
0.9%
Rent to Value Ratio
Active
$325,000
5
bds
|
3
ba
|
0
sqft
|
built
1898
7250 S Morgan St, Chicago, IL 60621
$-361
Cash flow
-5.8%
Cash-on-Cash Return
4.9%
Cap rate
0.6%
Rent to Value Ratio
Active
$679,000
3
bds
|
3
ba
|
0
sqft
|
built
1959
5660 N Rogers Ave, Chicago, IL 60646
$-1,720
Cash flow
-13.2%
Cash-on-Cash Return
3.2%
Cap rate
0.6%
Rent to Value Ratio
Active
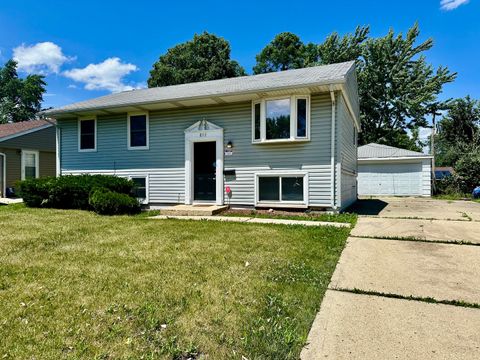
$159,000
3
bds
|
2
ba
|
1,156
sqft
|
built
1969
638 Hoxie Ave, Calumet City, IL 60409
$766
Cash flow
25.1%
Cash-on-Cash Return
11.5%
Cap rate
1.4%
Rent to Value Ratio
Active
$200,000
2
bds
|
2
ba
|
1,100
sqft
|
built
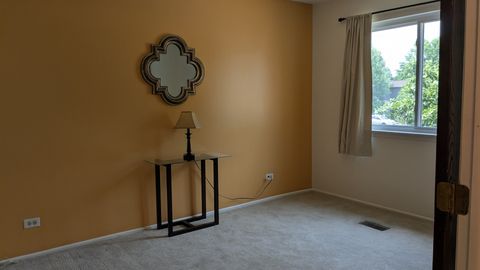
1979
1769 Sessions Walk, Hoffman Estates, IL 60169
$-387
Cash flow
-10.1%
Cash-on-Cash Return
3.4%
Cap rate
1.0%
Rent to Value Ratio
Active
$320,000
3
bds
|
2
ba
|
1,700
sqft
|
built
1981
1991 N Williamsburg Dr, Palatine, IL 60074
$-534
Cash flow
-8.7%
Cash-on-Cash Return
3.7%
Cap rate
0.8%
Rent to Value Ratio

Active
$290,000
3
bds
|
2
ba
|
1,150
sqft
|
built
1970
1777 Dewes St, Glenview, IL 60025
$-356
Cash flow
-6.4%
Cash-on-Cash Return
4.2%
Cap rate
0.9%
Rent to Value Ratio
Active
$330,000
2
bds
|
2
ba
|
1,150
sqft
|
built
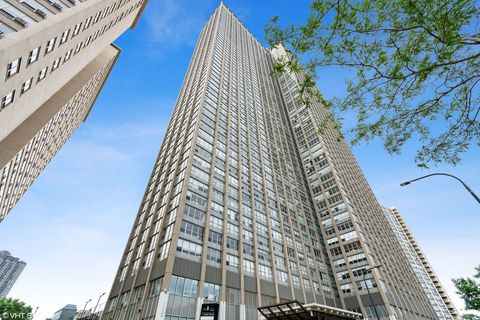
1973
655 W Irving Park Rd, Chicago, IL 60613
$-1,532
Cash flow
-24.2%
Cash-on-Cash Return
0.7%
Cap rate
0.8%
Rent to Value Ratio
Active
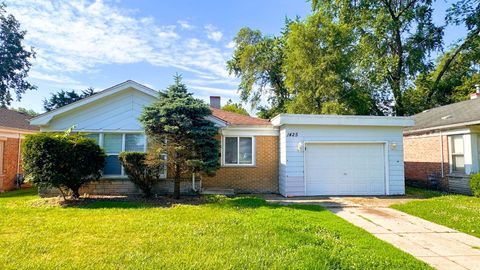
$207,000
3
bds
|
1
ba
|
1,174
sqft
|
built
1961
1425 Kasten Dr, Dolton, IL 60419
$160
Cash flow
4.0%
Cash-on-Cash Return
6.6%
Cap rate
1.1%
Rent to Value Ratio

Active
$198,000
2
bds
|
2
ba
|
1,025
sqft
|
built
1972
7904 W North Ave, Elmwood Park, IL 60707
$-103
Cash flow
-2.7%
Cash-on-Cash Return
5.1%
Cap rate
1.1%
Rent to Value Ratio

Active
$269,900
3
bds
|
1
ba
|
1,602
sqft
|
built
1913
2423 Collins St, Blue Island, IL 60406
$-195
Cash flow
-3.8%
Cash-on-Cash Return
4.8%
Cap rate
0.9%
Rent to Value Ratio
Active
$333,000
4
bds
|
3
ba
|
2,314
sqft
|
built
1893
11258 S Church St, Chicago, IL 60643
$368
Cash flow
5.8%
Cash-on-Cash Return
7.0%
Cap rate
1.0%
Rent to Value Ratio

Active
$239,900
2
bds
|
2
ba
|
1,400
sqft
|
built
1981
9386 Landings Ln, Des Plaines, IL 60016
$-227
Cash flow
-4.9%
Cash-on-Cash Return
4.5%
Cap rate
1.0%
Rent to Value Ratio
Active
$759,900
3
bds
|
3
ba
|
1,921
sqft
|
built
1907
1513 W Highland Ave, Chicago, IL 60660
$-1,910
Cash flow
-13.1%
Cash-on-Cash Return
3.2%
Cap rate
0.5%
Rent to Value Ratio
Active
$229,000
3
bds
|
2
ba
|
1,528
sqft
|
built
1966
376 Luella Ave, Calumet City, IL 60409
$-203
Cash flow
-4.6%
Cash-on-Cash Return
4.6%
Cap rate
1.0%
Rent to Value Ratio