Cook County Investment Properties for Sale
Browse homes for sale and investment properties in Cook County. Refine your search by price, property type, or more.
Best cash flowing properties in Cook County
Active
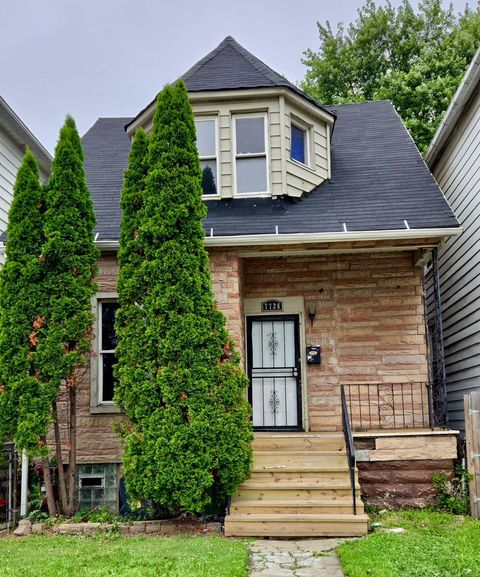
$105,000
4
bds
|
1
ba
|
1,221
sqft
|
built
1978
7726 S Maryland Ave, Chicago, IL 60619
$843
Cash flow
41.9%
Cash-on-Cash Return
15.3%
Cap rate
1.9%
Rent to Value Ratio
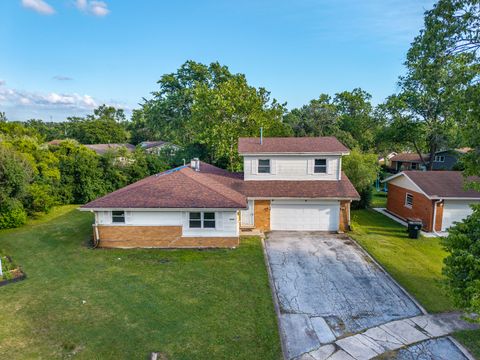
Active
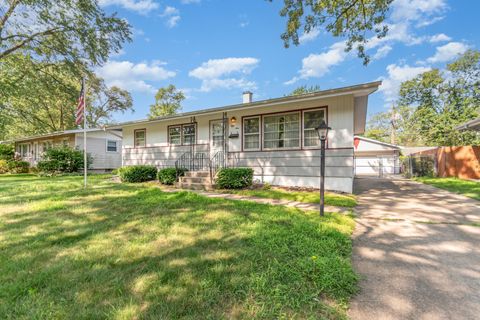
$229,900
4
bds
|
2
ba
|
1,506
sqft
|
built
1958
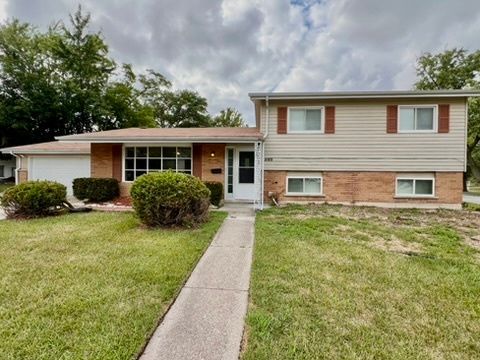
59 Indianwood Dr, Thornton, IL 60476
$518
Cash flow
11.8%
Cash-on-Cash Return
8.4%
Cap rate
1.1%
Rent to Value Ratio
5,263 out of 6,093 properties for sale in Cook County
Limited Results Shown
Create a free account, or log in to reveal all property listings and enjoy the complete experience.
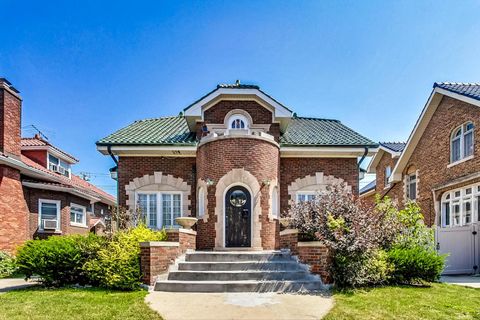
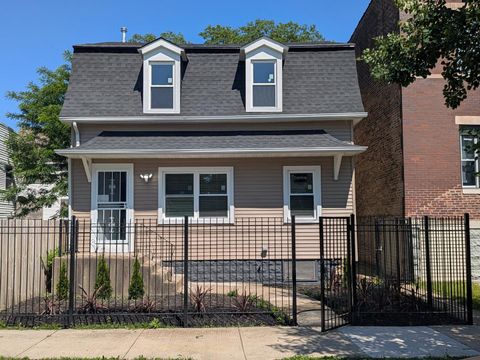
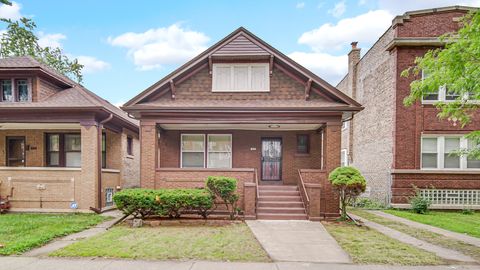
Active
$550,000
4
bds
|
3
ba
|
2,115
sqft
|
built
1921
7102 Riverside Dr, Berwyn, IL 60402
$-876
Cash flow
-8.3%
Cash-on-Cash Return
3.8%
Cap rate
0.7%
Rent to Value Ratio
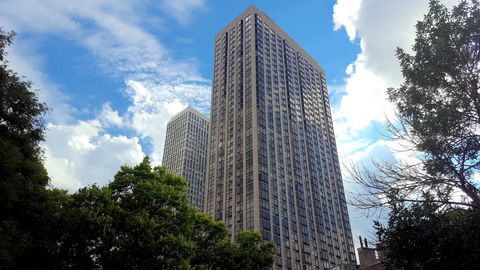
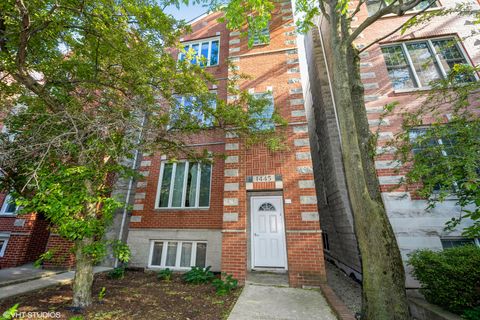
Active
$289,000
1
bds
|
1
ba
|
700
sqft
|
built
1973
2650 N Lakeview Ave, Chicago, IL 60614
$-715
Cash flow
-12.9%
Cash-on-Cash Return
2.7%
Cap rate
0.7%
Rent to Value Ratio
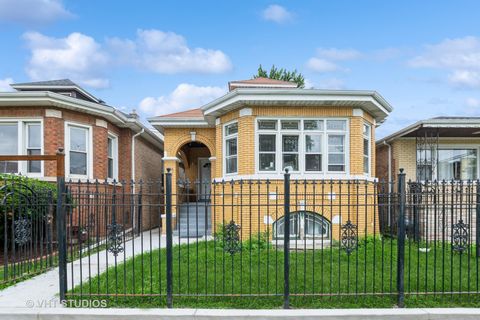
Active
$299,999
4
bds
|
4
ba
|
1,600
sqft
|
built
1888
11531 S Perry Ave, Chicago, IL 60628
$59
Cash flow
1.0%
Cash-on-Cash Return
5.9%
Cap rate
0.7%
Rent to Value Ratio
Active
$247,000
3
bds
|
2
ba
|
984
sqft
|
built
1979
19809 Lakewood Ave, Lynwood, IL 60411
$-277
Cash flow
-5.9%
Cash-on-Cash Return
4.3%
Cap rate
0.9%
Rent to Value Ratio
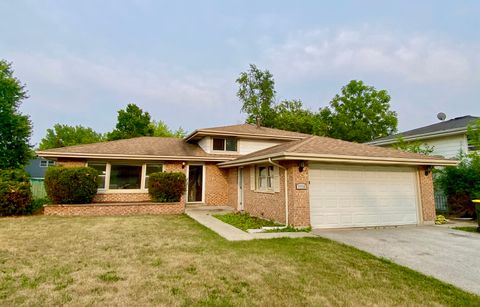
Active
$439,900
3
bds
|
3
ba
|
1,392
sqft
|
built
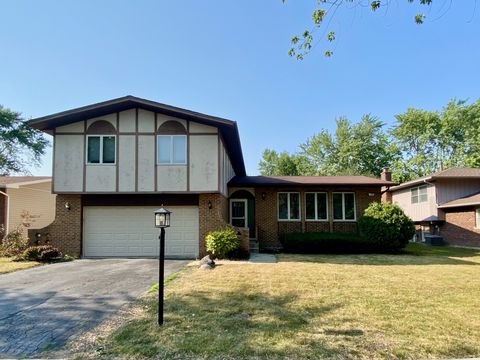
1958
320 Pleasant St, Hoffman Estates, IL 60169
$-279
Cash flow
-3.3%
Cash-on-Cash Return
4.9%
Cap rate
0.7%
Rent to Value Ratio
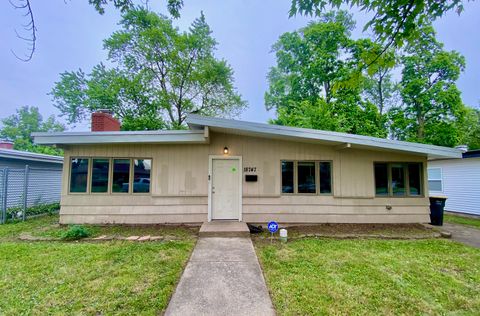
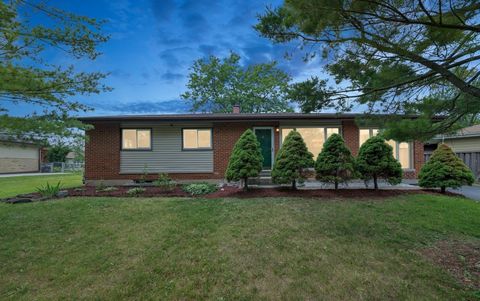
Active
$183,000
3
bds
|
1
ba
|
1,102
sqft
|
built
1956
18747 Sherman St, Lansing, IL 60438
$36
Cash flow
1.0%
Cash-on-Cash Return
5.9%
Cap rate
1.1%
Rent to Value Ratio
Active
$2,599,000
5
bds
|
8
ba
|
5,542
sqft
|
built
2005
1669 Monterey Dr, Glenview, IL 60026
$-10,348
Cash flow
-20.8%
Cash-on-Cash Return
0.9%
Cap rate
0.3%
Rent to Value Ratio
Active
$419,900
3
bds
|
3
ba
|
1,300
sqft
|
built
1917
1616 N Major Ave, Chicago, IL 60639
$-348
Cash flow
-4.3%
Cash-on-Cash Return
4.7%
Cap rate
0.7%
Rent to Value Ratio
Active
$235,000
1
bds
|
1
ba
|
782
sqft
|
built
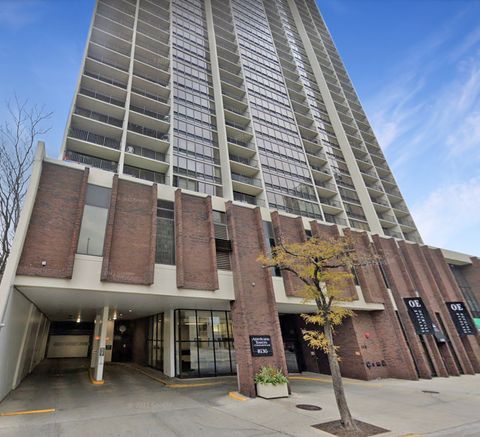
1959
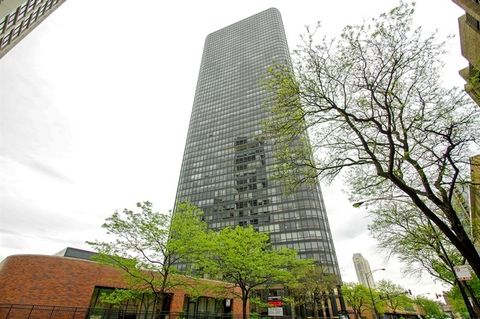
3430 N Lake Shore Dr, Chicago, IL 60657
$-627
Cash flow
-13.9%
Cash-on-Cash Return
2.5%
Cap rate
1.0%
Rent to Value Ratio
Active
$183,000
4
bds
|
2
ba
|
984
sqft
|
built
1963
308 Clyde Ave, Calumet City, IL 60409
$-112
Cash flow
-3.2%
Cash-on-Cash Return
4.9%
Cap rate
1.1%
Rent to Value Ratio
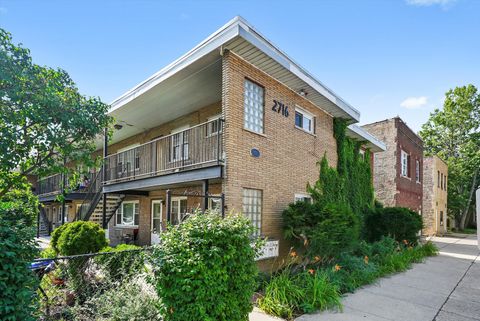
Active
$105,000
1
bds
|
1
ba
|
800
sqft
|
built
1956
2716 Ridgeland Ave, Berwyn, IL 60402
$416
Cash flow
20.7%
Cash-on-Cash Return
10.4%
Cap rate
1.7%
Rent to Value Ratio
Active
$320,000
3
bds
|
2
ba
|
2,600
sqft
|
built
1977
4329 Applewood Ln, Matteson, IL 60443
$-191
Cash flow
-3.1%
Cash-on-Cash Return
5.0%
Cap rate
0.9%
Rent to Value Ratio
Active
$210,000
3
bds
|
2
ba
|
980
sqft
|
built
1964
948 Dartmouth Ave, Matteson, IL 60443
$35
Cash flow
0.9%
Cash-on-Cash Return
5.9%
Cap rate
1.0%
Rent to Value Ratio
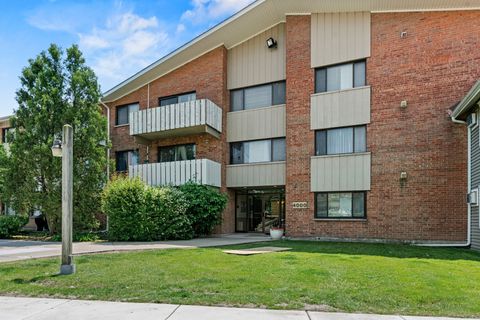
Active
$225,000
2
bds
|
2
ba
|
1,200
sqft
|
built
1976
4000 Bayside Dr, Palatine, IL 60074
$-443
Cash flow
-10.3%
Cash-on-Cash Return
3.3%
Cap rate
0.8%
Rent to Value Ratio
Active
$215,000
2
bds
|
1
ba
|
900
sqft
|
built
1972
8538 W Catherine Ave, Chicago, IL 60656
$-241
Cash flow
-5.8%
Cash-on-Cash Return
4.3%
Cap rate
0.8%
Rent to Value Ratio
Active
$800,000
3
bds
|
3
ba
|
2,200
sqft
|
built
2011
1718 W Le Moyne St, Chicago, IL 60622
$-1,453
Cash flow
-9.5%
Cash-on-Cash Return
3.5%
Cap rate
0.7%
Rent to Value Ratio
Active
$270,000
3
bds
|
3
ba
|
2,000
sqft
|
built
1903
7343 S Kenwood Ave, Chicago, IL 60619
$-211
Cash flow
-4.1%
Cash-on-Cash Return
4.7%
Cap rate
0.6%
Rent to Value Ratio
Active
$1,449,000
4
bds
|
5
ba
|
4,100
sqft
|
built
2016
504 N Paulina St, Chicago, IL 60622
$-2,643
Cash flow
-9.5%
Cash-on-Cash Return
3.5%
Cap rate
0.6%
Rent to Value Ratio
Active
$299,900
3
bds
|
3
ba
|
2,573
sqft
|
built
1920
7940 S Perry Ave, Chicago, IL 60620
$308
Cash flow
5.4%
Cash-on-Cash Return
6.9%
Cap rate
0.9%
Rent to Value Ratio
Active
$144,900
2
bds
|
1
ba
|
965
sqft
|
built
1921
525 E 87th Pl, Chicago, IL 60619
$501
Cash flow
18.0%
Cash-on-Cash Return
9.8%
Cap rate
1.4%
Rent to Value Ratio
Active
$880,000
3
bds
|
2
ba
|
1,900
sqft
|
built
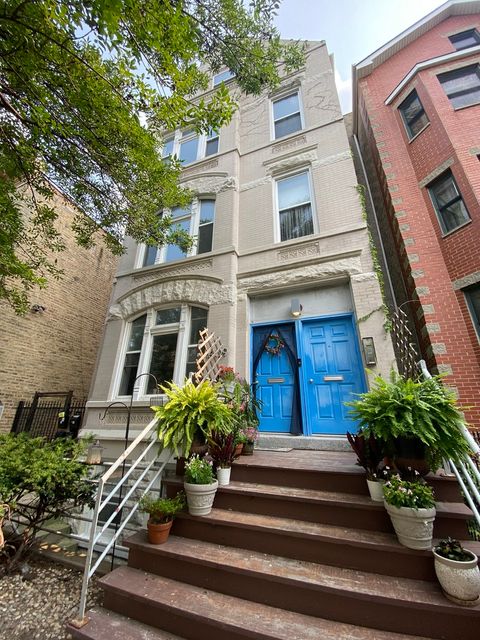
2013
1611 N Hermitage Ave, Chicago, IL 60622
$-3,585
Cash flow
-21.3%
Cash-on-Cash Return
0.8%
Cap rate
0.4%
Rent to Value Ratio
Active
$6,250,000
5
bds
|
9
ba
|
10,179
sqft
|
built
2007
451 W Superior St, Chicago, IL 60654
$-32,038
Cash flow
-26.7%
Cash-on-Cash Return
-0.5%
Cap rate
0.1%
Rent to Value Ratio
Active
$200,000
5
bds
|
3
ba
|
2,238
sqft
|
built
1961
3205 Oak Ct, Hazel Crest, IL 60429
$296
Cash flow
7.7%
Cash-on-Cash Return
7.5%
Cap rate
1.6%
Rent to Value Ratio
Active
$235,000
3
bds
|
2
ba
|
1,225
sqft
|
built
1905
7819 S Colfax Ave, Chicago, IL 60649
$-115
Cash flow
-2.6%
Cash-on-Cash Return
5.1%
Cap rate
0.7%
Rent to Value Ratio
Active
$425,000
3
bds
|
2
ba
|
0
sqft
|
built
2000
1445 W Walton St, Chicago, IL 60642
$-1,191
Cash flow
-14.6%
Cash-on-Cash Return
2.3%
Cap rate
0.6%
Rent to Value Ratio
Active
$349,900
5
bds
|
2
ba
|
2,000
sqft
|
built
1926
8718 S Marshfield Ave, Chicago, IL 60620
$-609
Cash flow
-9.1%
Cash-on-Cash Return
3.6%
Cap rate
0.5%
Rent to Value Ratio
Active
$207,000
3
bds
|
2
ba
|
1,350
sqft
|
built
1963
500 Antietam St, Park Forest, IL 60466
$-260
Cash flow
-6.6%
Cash-on-Cash Return
4.2%
Cap rate
1.1%
Rent to Value Ratio
Active
$259,900
3
bds
|
2
ba
|
1,560
sqft
|
built
1966
14916 La Salle St, Dolton, IL 60419
$300
Cash flow
6.0%
Cash-on-Cash Return
7.1%
Cap rate
0.9%
Rent to Value Ratio
Active
$364,900
3
bds
|
2
ba
|
1,900
sqft
|
built
1987
12818 S Blossom Dr, Alsip, IL 60803
$-543
Cash flow
-7.8%
Cash-on-Cash Return
3.9%
Cap rate
0.7%
Rent to Value Ratio
Active
$209,000
3
bds
|
3
ba
|
1,200
sqft
|
built
1944
2745 179th St, Lansing, IL 60438
$-44
Cash flow
-1.1%
Cash-on-Cash Return
5.4%
Cap rate
0.9%
Rent to Value Ratio
Active
$268,000
3
bds
|
3
ba
|
2,046
sqft
|
built
1979
5058 Roberta Ln, Richton Park, IL 60471
$-434
Cash flow
-8.4%
Cash-on-Cash Return
3.7%
Cap rate
0.9%
Rent to Value Ratio
Active
$299,000
2
bds
|
2
ba
|
1,056
sqft
|
built
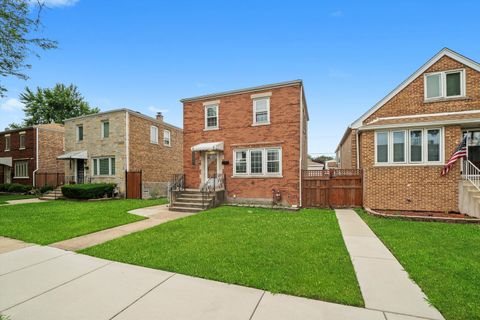
1943
5308 S Keeler Ave, Chicago, IL 60632
$-423
Cash flow
-7.4%
Cash-on-Cash Return
4.0%
Cap rate
0.7%
Rent to Value Ratio
Active
$245,000
1
bds
|
1
ba
|
0
sqft
|
built
1945
1409 W Superior St, Chicago, IL 60642
$-323
Cash flow
-6.9%
Cash-on-Cash Return
4.1%
Cap rate
0.8%
Rent to Value Ratio
Active
$290,000
1
bds
|
1
ba
|
750
sqft
|
built
1974
1636 N Wells St, Chicago, IL 60614
$-780
Cash flow
-14.0%
Cash-on-Cash Return
2.4%
Cap rate
0.9%
Rent to Value Ratio
Active
$234,900
1
bds
|
1
ba
|
795
sqft
|
built
1973
5415 N Sheridan Rd, Chicago, IL 60640
$-792
Cash flow
-17.6%
Cash-on-Cash Return
1.6%
Cap rate
0.9%
Rent to Value Ratio
Active
$175,000
2
bds
|
1
ba
|
950
sqft
|
built
1974
4917 W 109th St, Oak Lawn, IL 60453
$-198
Cash flow
-5.9%
Cash-on-Cash Return
4.3%
Cap rate
1.0%
Rent to Value Ratio
Active
$399,909
4
bds
|
4
ba
|
2,454
sqft
|
built
1990
1614 185th St, Lansing, IL 60438
$-1,098
Cash flow
-14.3%
Cash-on-Cash Return
2.4%
Cap rate
0.7%
Rent to Value Ratio
Active
$579,900
4
bds
|
3
ba
|
2,300
sqft
|
built
1928
6155 W Cornelia Ave, Chicago, IL 60634
$-1,057
Cash flow
-9.5%
Cash-on-Cash Return
3.5%
Cap rate
0.4%
Rent to Value Ratio