Cook County Investment Properties for Sale
Browse homes for sale and investment properties in Cook County. Refine your search by price, property type, or more.
Best cash flowing properties in Cook County
Active
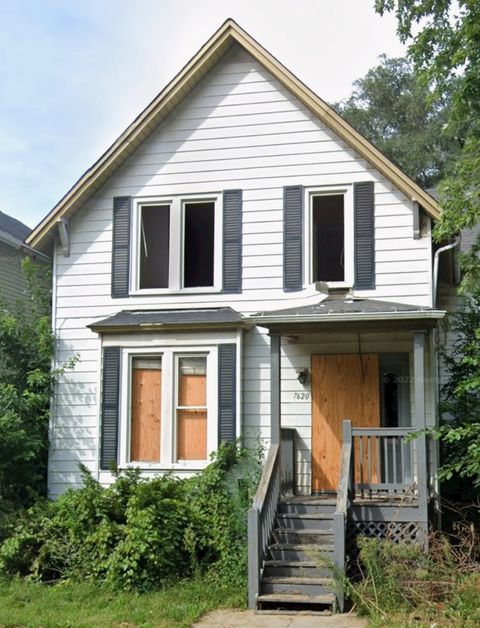
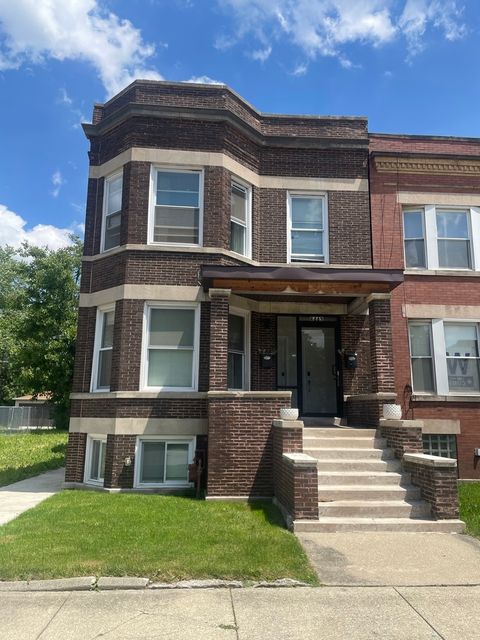
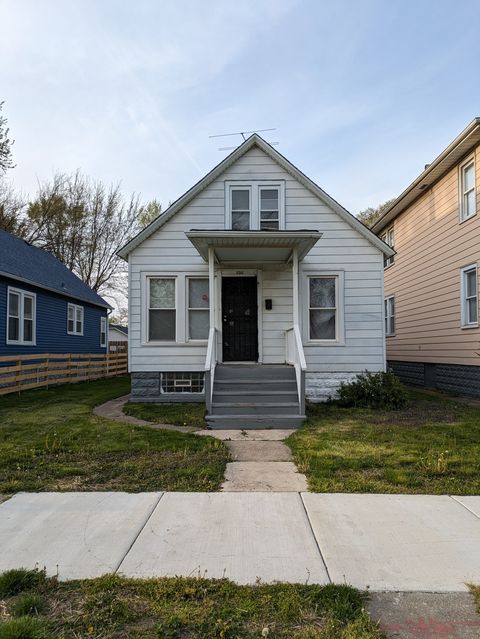
$73,100
6
bds
|
2
ba
|
0
sqft
|
built
1885
7620 S Ingleside Ave, Chicago, IL 60619
$964
Cash flow
15.4%
Cash-on-Cash Return
15.8%
Cap rate
2.2%
Rent to Value Ratio
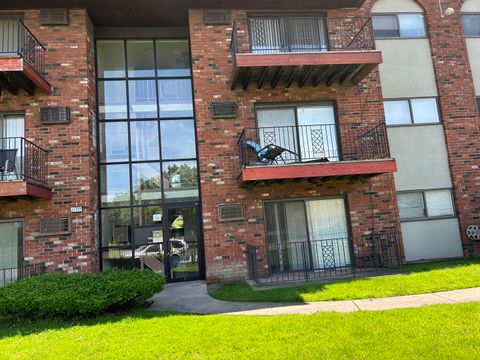
Active
$53,000
2
bds
|
1
ba
|
0
sqft
|
built
1919
13701 S Stewart Ave, Riverdale, IL 60827
$681
Cash flow
15.0%
Cash-on-Cash Return
15.4%
Cap rate
2.6%
Rent to Value Ratio
6,241 out of 8,483 properties for sale in Cook County
Limited Results Shown
Create a free account, or log in to reveal all property listings and enjoy the complete experience.
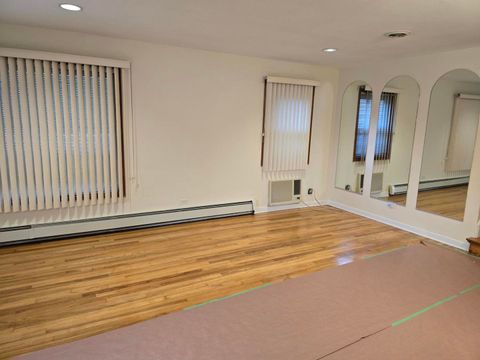
Active
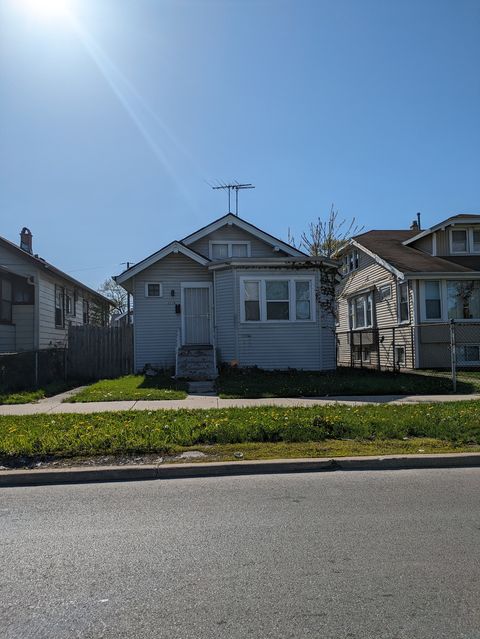
$235,900
4
bds
|
2
ba
|
1,500
sqft
|
built
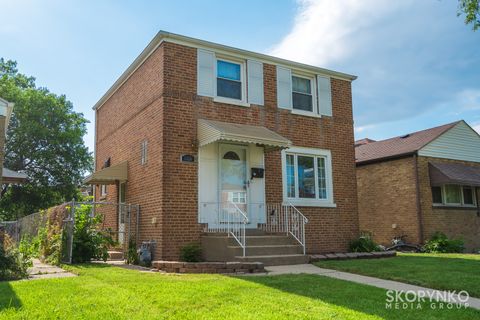
1957
8441 S King Dr, Chicago, IL 60619
$216
Cash flow
4.8%
Cash-on-Cash Return
6.8%
Cap rate
0.9%
Rent to Value Ratio
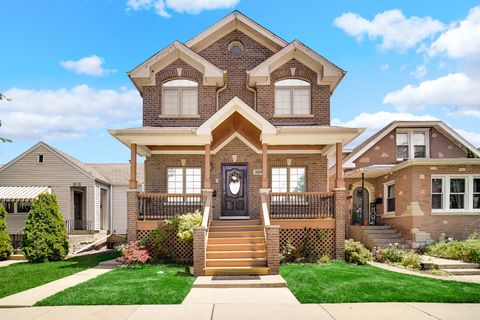
Active
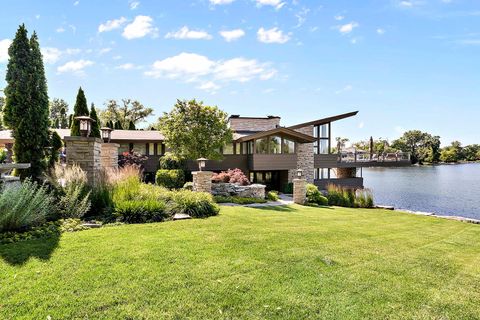
$785,000
5
bds
|
4
ba
|
3,928
sqft
|
built
2005
3129 N Oconto Ave, Chicago, IL 60707
$-1,035
Cash flow
-6.9%
Cash-on-Cash Return
4.1%
Cap rate
0.6%
Rent to Value Ratio
Active
$899,000
3
bds
|
3
ba
|
1,750
sqft
|
built
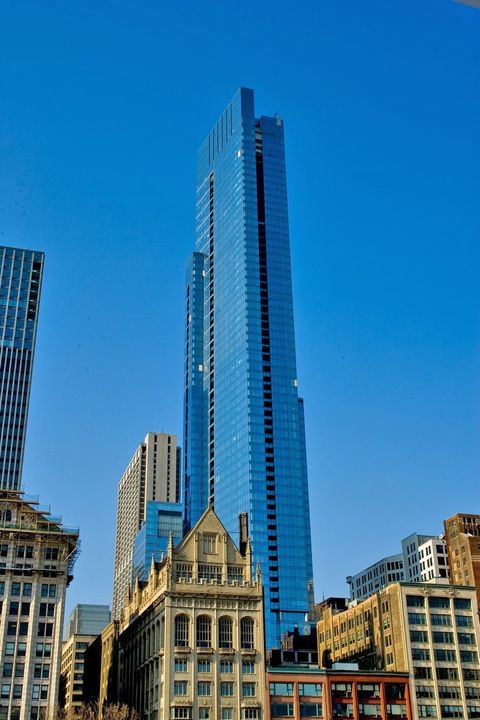
60 E Monroe St, Chicago, IL 60603
$-3,259
Cash flow
-18.9%
Cash-on-Cash Return
1.3%
Cap rate
0.7%
Rent to Value Ratio
Active
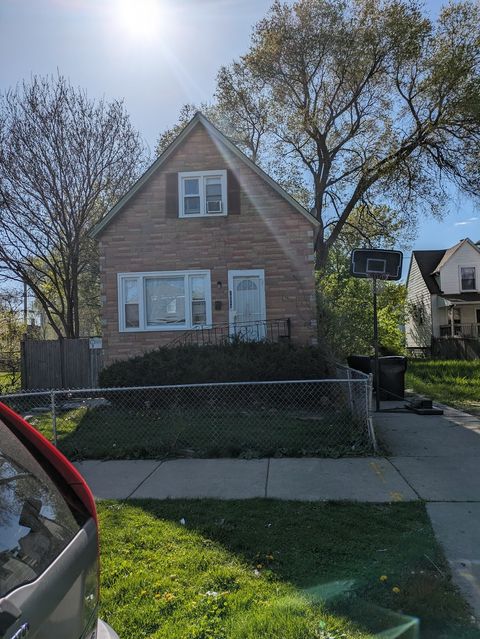
$160,000
3
bds
|
2
ba
|
888
sqft
|
built
1912
108 N Hamlin Blvd, Chicago, IL 60624
$-123
Cash flow
-4.0%
Cash-on-Cash Return
4.8%
Cap rate
1.1%
Rent to Value Ratio
Active
$945,800
7
bds
|
3
ba
|
0
sqft
|
built
1891
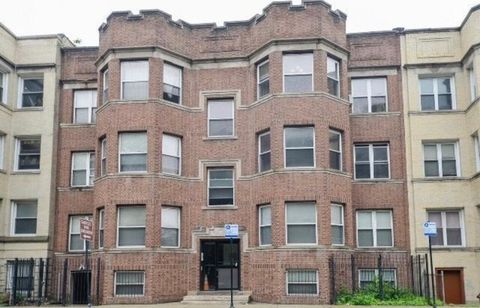
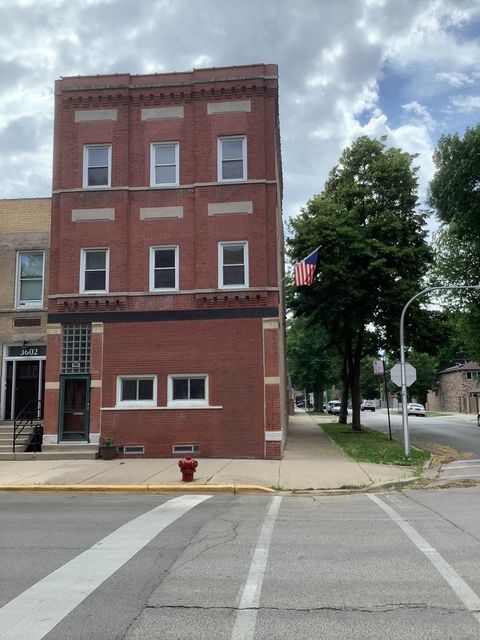
3600 S Emerald Ave, Chicago, IL 60609
$-3,002
Cash flow
-16.6%
Cash-on-Cash Return
1.9%
Cap rate
0.3%
Rent to Value Ratio

Active
$300,000
4
bds
|
3
ba
|
630
sqft
|
built
1888
2658 W 24th Pl, Chicago, IL 60608
$-453
Cash flow
-7.9%
Cash-on-Cash Return
3.9%
Cap rate
0.6%
Rent to Value Ratio

Active
$1,600,000
3
bds
|
4
ba
|
2,333
sqft
|
built
2005
21 E Huron St, Chicago, IL 60611
$-6,474
Cash flow
-21.1%
Cash-on-Cash Return
0.8%
Cap rate
0.6%
Rent to Value Ratio
Active
$252,900
2
bds
|
2
ba
|
966
sqft
|
built
1947
1128 Marshall Ave, Bellwood, IL 60104
$-313
Cash flow
-6.5%
Cash-on-Cash Return
4.2%
Cap rate
0.9%
Rent to Value Ratio
Active
$240,000
3
bds
|
2
ba
|
1,420
sqft
|
built
1972
824 N Austin Blvd, Oak Park, IL 60302
$-80
Cash flow
-1.7%
Cash-on-Cash Return
5.3%
Cap rate
1.2%
Rent to Value Ratio
Active
$205,000
5
bds
|
2
ba
|
2,500
sqft
|
built
1890
7122 S Champlain Ave, Chicago, IL 60619
$652
Cash flow
16.6%
Cash-on-Cash Return
9.5%
Cap rate
1.2%
Rent to Value Ratio
Active
$73,100
6
bds
|
2
ba
|
0
sqft
|
built
1885
7620 S Ingleside Ave, Chicago, IL 60619
$964
Cash flow
15.4%
Cash-on-Cash Return
15.8%
Cap rate
2.2%
Rent to Value Ratio
Active
$269,999
3
bds
|
2
ba
|
1,900
sqft
|
built
1967
11842 S Justine St, Chicago, IL 60643
$421
Cash flow
8.1%
Cash-on-Cash Return
7.6%
Cap rate
1.0%
Rent to Value Ratio
Active
$845,000
3
bds
|
3
ba
|
1,700
sqft
|
built
2004
201 W Grand Ave, Chicago, IL 60654
$-1,987
Cash flow
-12.3%
Cash-on-Cash Return
2.9%
Cap rate
0.7%
Rent to Value Ratio
Active
$374,999
10
bds
|
3
ba
|
0
sqft
|
built
1908
6443 S Morgan St, Chicago, IL 60621
$-610
Cash flow
-8.5%
Cash-on-Cash Return
3.7%
Cap rate
0.5%
Rent to Value Ratio
Active
$2,150,000
4
bds
|
4
ba
|
0
sqft
|
built
1959
130 N Dee Rd, Park Ridge, IL 60068
$-5,493
Cash flow
-13.3%
Cash-on-Cash Return
2.6%
Cap rate
0.5%
Rent to Value Ratio
Active
$115,000
3
bds
|
1
ba
|
924
sqft
|
built
1917
10238 S Wentworth Ave, Chicago, IL 60628
$500
Cash flow
22.7%
Cash-on-Cash Return
10.9%
Cap rate
1.4%
Rent to Value Ratio
Active
$115,000
4
bds
|
1
ba
|
799
sqft
|
built
1899
10568 S Indiana Ave, Chicago, IL 60628
$413
Cash flow
18.7%
Cash-on-Cash Return
10.0%
Cap rate
1.3%
Rent to Value Ratio
Active
$110,000
3
bds
|
1
ba
|
1,200
sqft
|
built
1913
656 W 116th Pl, Chicago, IL 60628
$678
Cash flow
32.2%
Cash-on-Cash Return
13.1%
Cap rate
1.6%
Rent to Value Ratio
Active
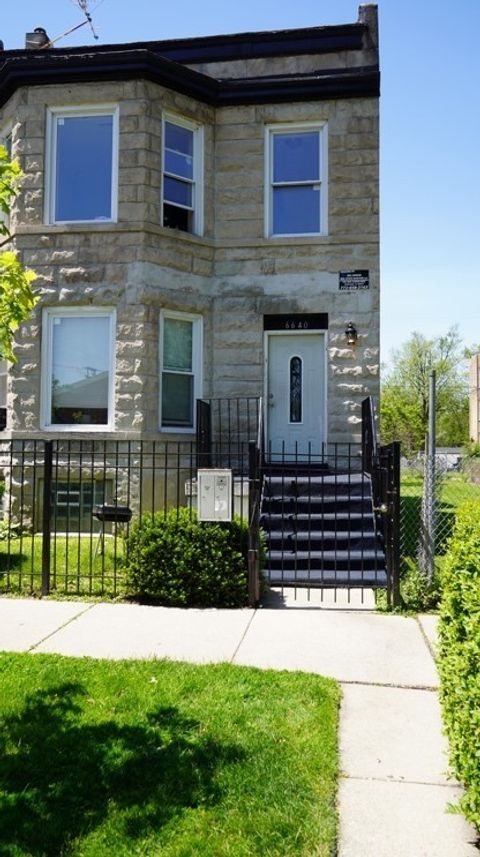
$330,000
6
bds
|
3
ba
|
0
sqft
|
built
1899
6640 S Evans Ave, Chicago, IL 60637
$-567
Cash flow
-9.0%
Cash-on-Cash Return
3.6%
Cap rate
0.6%
Rent to Value Ratio
Active
$360,000
6
bds
|
3
ba
|
0
sqft
|
built
1930
630 E 102nd Pl, Chicago, IL 60628
$-406
Cash flow
-5.9%
Cash-on-Cash Return
4.3%
Cap rate
0.6%
Rent to Value Ratio
Active
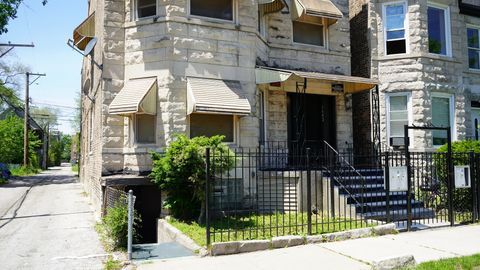
$450,000
5
bds
|
4
ba
|
0
sqft
|
built
1900
6642 S Evans Ave, Chicago, IL 60637
$-945
Cash flow
-11.0%
Cash-on-Cash Return
3.2%
Cap rate
0.5%
Rent to Value Ratio

Active
$389,900
2
bds
|
2
ba
|
1,200
sqft
|
built
1959
4919 S Long Ave, Chicago, IL 60638
$-106
Cash flow
-1.4%
Cash-on-Cash Return
5.4%
Cap rate
0.8%
Rent to Value Ratio
Active
$53,000
2
bds
|
1
ba
|
0
sqft
|
built
1919
13701 S Stewart Ave, Riverdale, IL 60827
$681
Cash flow
15.0%
Cash-on-Cash Return
15.4%
Cap rate
2.6%
Rent to Value Ratio
Active
$170,000
5
bds
|
2
ba
|
0
sqft
|
built
1890
6921 S Normal Blvd, Chicago, IL 60621
$236
Cash flow
7.2%
Cash-on-Cash Return
7.3%
Cap rate
0.9%
Rent to Value Ratio
Active
$125,000
3
bds
|
1
ba
|
958
sqft
|
built
1922
12115 S Emerald Ave, Chicago, IL 60628
$581
Cash flow
24.3%
Cash-on-Cash Return
11.3%
Cap rate
1.4%
Rent to Value Ratio
Active
$130,000
4
bds
|
2
ba
|
1,240
sqft
|
built
1913
8127 S Coles Ave, Chicago, IL 60617
$420
Cash flow
16.9%
Cash-on-Cash Return
9.6%
Cap rate
1.2%
Rent to Value Ratio
Active
$815,000
12
bds
|
5
ba
|
0
sqft
|
built
1905
5330 S Wabash Ave, Chicago, IL 60615
$-2,791
Cash flow
-17.9%
Cash-on-Cash Return
1.6%
Cap rate
0.3%
Rent to Value Ratio
Active
$170,000
6
bds
|
2
ba
|
0
sqft
|
built
1890
12026 S Wallace St, Chicago, IL 60628
$231
Cash flow
7.1%
Cash-on-Cash Return
7.3%
Cap rate
0.9%
Rent to Value Ratio
Active
$150,000
4
bds
|
1
ba
|
1,034
sqft
|
built
1971
17110 Apple Tree Dr, Country Club Hills, IL 60478
$376
Cash flow
13.1%
Cash-on-Cash Return
8.7%
Cap rate
1.5%
Rent to Value Ratio
Active
$345,000
bds
|
0
ba
|
0
sqft
|
built
1890
3633 S Calumet Ave, Chicago, IL 60653
$-349
Cash flow
-5.3%
Cash-on-Cash Return
4.5%
Cap rate
0.7%
Rent to Value Ratio
Active
$1,295,000
3
bds
|
4
ba
|
2,985
sqft
|
built
1968
505 N Lake Shore Dr, Chicago, IL 60611
$-6,546
Cash flow
-26.4%
Cash-on-Cash Return
-0.4%
Cap rate
0.5%
Rent to Value Ratio

Active
$324,000
9
bds
|
6
ba
|
0
sqft
|
built
2010
98 W 154th St, Harvey, IL 60426
$-1,473
Cash flow
-23.7%
Cash-on-Cash Return
0.2%
Cap rate
0.6%
Rent to Value Ratio
Active
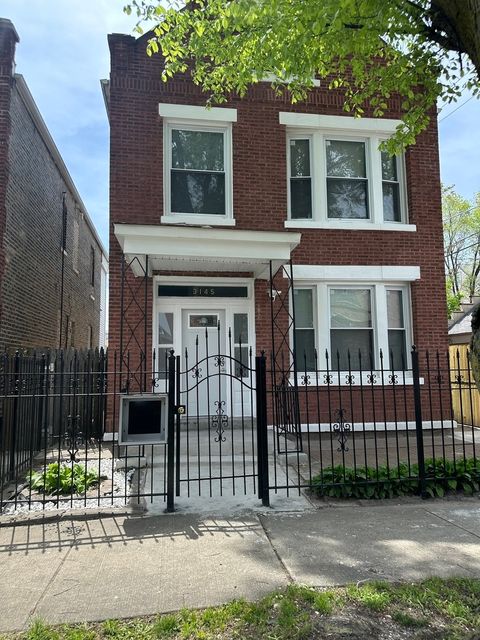
$538,900
5
bds
|
3
ba
|
0
sqft
|
built
1918
3145 W 42nd St, Chicago, IL 60632
$-1,344
Cash flow
-13.0%
Cash-on-Cash Return
2.7%
Cap rate
0.4%
Rent to Value Ratio
Active
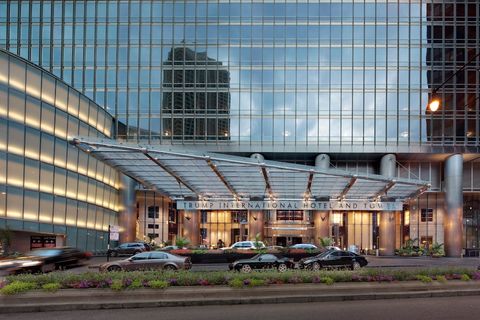
$2,500,000
3
bds
|
4
ba
|
3,080
sqft
|
built
2008
401 N Wabash Ave, Chicago, IL 60611
$-12,879
Cash flow
-26.9%
Cash-on-Cash Return
-0.5%
Cap rate
0.4%
Rent to Value Ratio
Active
$410,000
10
bds
|
4
ba
|
0
sqft
|
built
1922
417 E 60th St, Chicago, IL 60637
$-1,126
Cash flow
-14.3%
Cash-on-Cash Return
2.4%
Cap rate
0.4%
Rent to Value Ratio

Active
$948,500
4
bds
|
4
ba
|
3,310
sqft
|
built
1989
812 Elm St, Park Ridge, IL 60068
$-2,451
Cash flow
-13.5%
Cash-on-Cash Return
2.6%
Cap rate
0.6%
Rent to Value Ratio
Active
$299,900
4
bds
|
2
ba
|
0
sqft
|
built
1911
1900 S 57th Ct, Cicero, IL 60804
$-689
Cash flow
-12.0%
Cash-on-Cash Return
2.9%
Cap rate
0.6%
Rent to Value Ratio
Active
$1,095,000
3
bds
|
3
ba
|
1,875
sqft
|
built
1982
360 E Randolph St, Chicago, IL 60601
$-3,891
Cash flow
-18.5%
Cash-on-Cash Return
1.4%
Cap rate
0.7%
Rent to Value Ratio
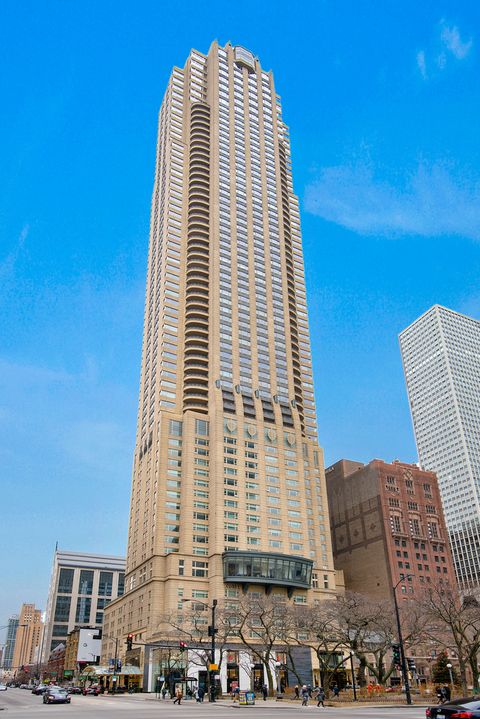
Active
$1,199,000
2
bds
|
3
ba
|
2,000
sqft
|
built
2000
800 N Michigan Ave, Chicago, IL 60611
$-5,013
Cash flow
-21.8%
Cash-on-Cash Return
0.7%
Cap rate
0.5%
Rent to Value Ratio

Active
$260,000
5
bds
|
2
ba
|
1,425
sqft
|
built
1929
7823 S Indiana Ave, Chicago, IL 60619
$-102
Cash flow
-2.0%
Cash-on-Cash Return
5.2%
Cap rate
0.8%
Rent to Value Ratio