Cook County Investment Properties for Sale
Browse homes for sale and investment properties in Cook County. Refine your search by price, property type, or more.
Best cash flowing properties in Cook County
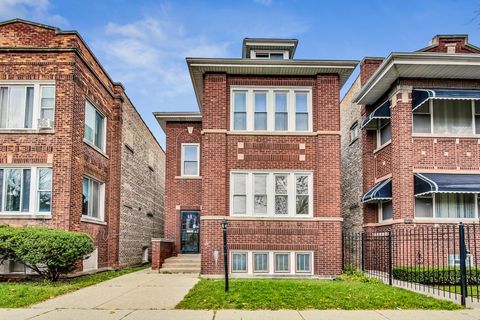
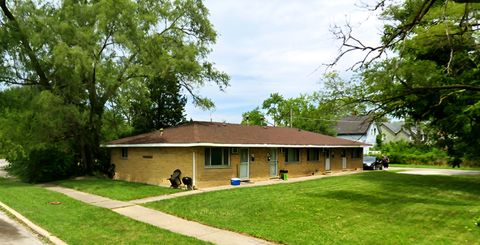
Active
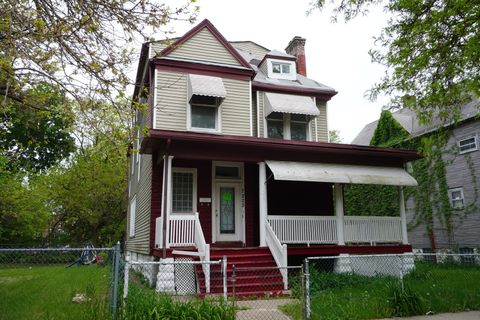
$175,000
7
bds
|
5
ba
|
2,300
sqft
|
built
1883
7225 S Princeton Ave, Chicago, IL 60621
$1,473
Cash flow
43.9%
Cash-on-Cash Return
15.8%
Cap rate
2.0%
Rent to Value Ratio
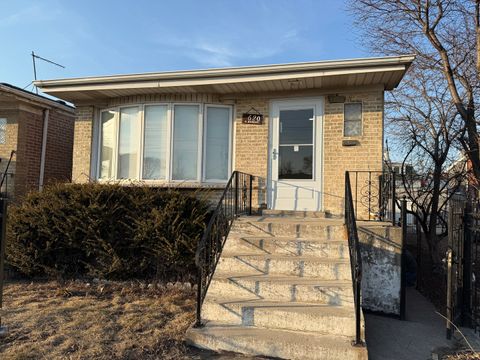
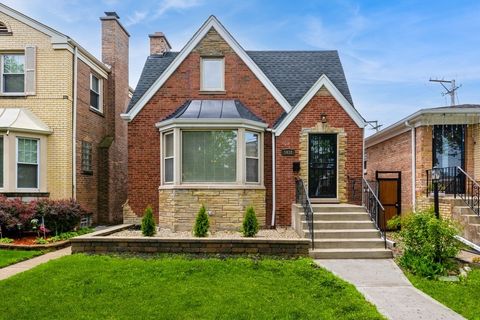
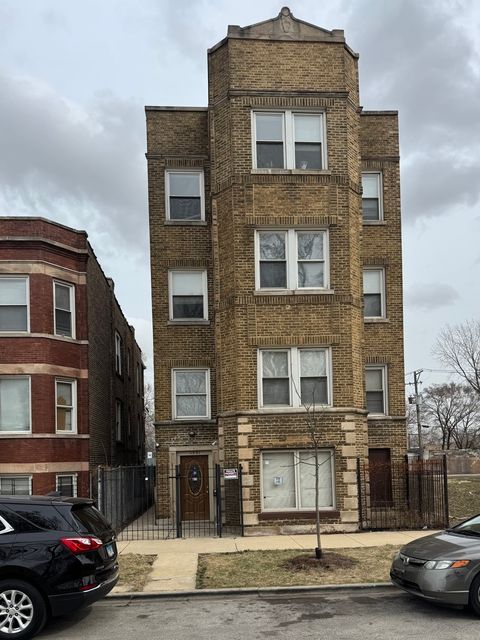
Active
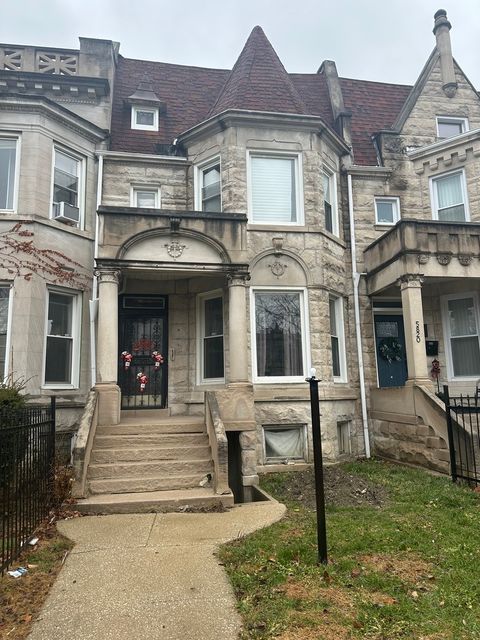
$198,997
4
bds
|
3
ba
|
2,040
sqft
|
built
1888
5822 W Washington Blvd, Chicago, IL 60644
$830
Cash flow
21.8%
Cash-on-Cash Return
10.7%
Cap rate
1.5%
Rent to Value Ratio
6,217 out of 7,111 properties for sale in Cook County
Limited Results Shown
Create a free account, or log in to reveal all property listings and enjoy the complete experience.
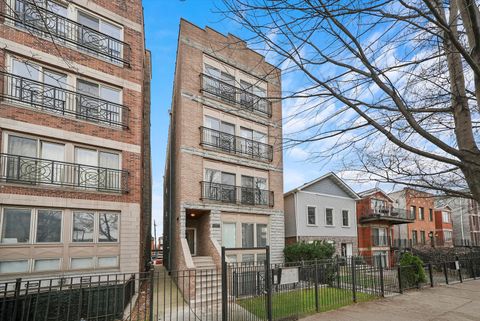
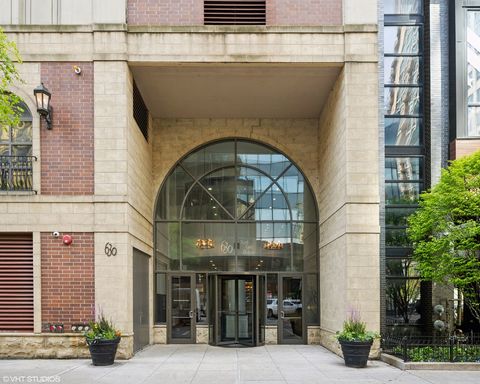
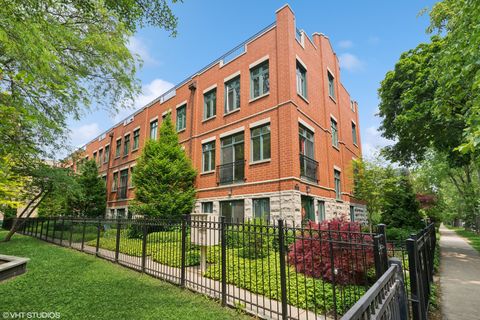
Active
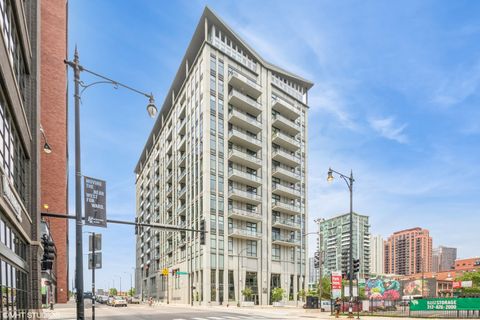
$585,000
2
bds
|
2
ba
|
1,338
sqft
|
built
2007
740 W Fulton St, Chicago, IL 60661
$-1,531
Cash flow
-13.7%
Cash-on-Cash Return
2.5%
Cap rate
0.8%
Rent to Value Ratio
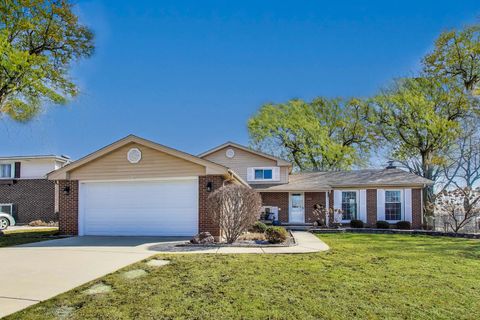
Active
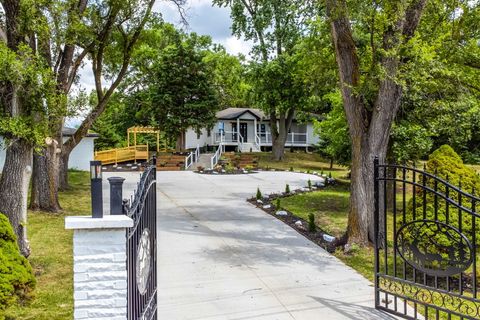
$799,000
3
bds
|
2
ba
|
2,600
sqft
|
built
1958
16705 Wolf Rd, Orland Park, IL 60467
$-2,261
Cash flow
-14.8%
Cash-on-Cash Return
2.3%
Cap rate
0.4%
Rent to Value Ratio
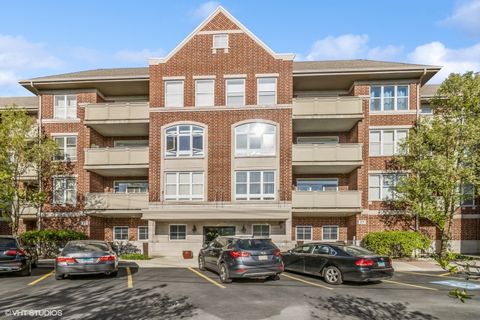
Active
$319,777
3
bds
|
2
ba
|
1,207
sqft
|
built
1972
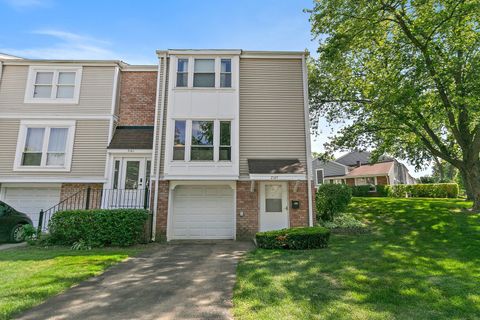
2165 Greystone Pl, Hoffman Estates, IL 60169
$-521
Cash flow
-8.5%
Cash-on-Cash Return
3.7%
Cap rate
0.7%
Rent to Value Ratio
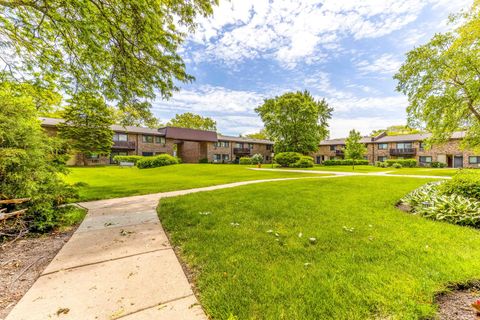
Active
$1,749,000
5
bds
|
6
ba
|
6,263
sqft
|
built
2001
5851 N Newark Ave, Chicago, IL 60631
$-5,614
Cash flow
-16.7%
Cash-on-Cash Return
1.8%
Cap rate
0.4%
Rent to Value Ratio
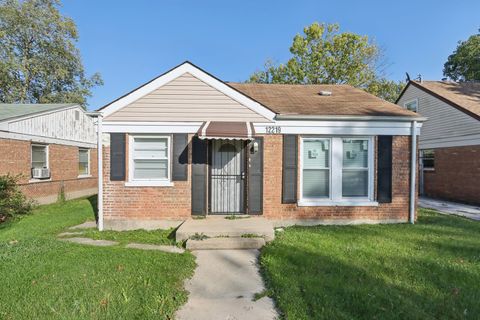
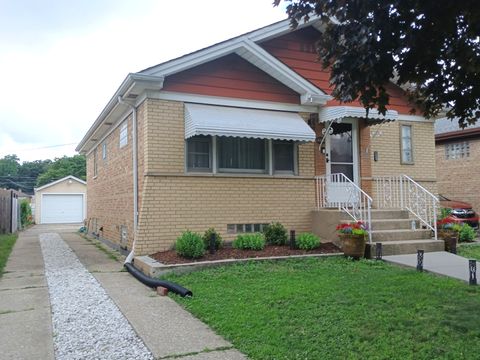
Active
$210,000
3
bds
|
1
ba
|
2,638
sqft
|
built
1930
8940 S Emerald Ave, Chicago, IL 60620
$670
Cash flow
16.6%
Cash-on-Cash Return
9.5%
Cap rate
1.2%
Rent to Value Ratio
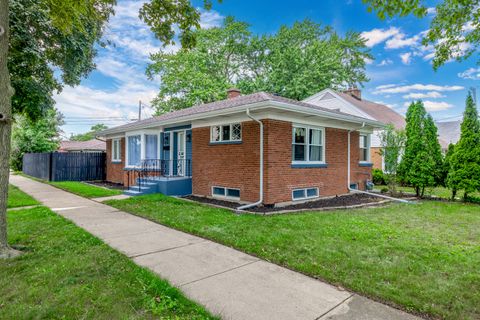
Active
$314,900
3
bds
|
2
ba
|
1,055
sqft
|
built
1963
11024 Mason Ave, Chicago Ridge, IL 60415
$-441
Cash flow
-7.3%
Cash-on-Cash Return
4.0%
Cap rate
0.8%
Rent to Value Ratio
Active
$450,000
3
bds
|
3
ba
|
2,320
sqft
|
built
2003
2515 W Harrison St, Chicago, IL 60612
$-1,204
Cash flow
-14.0%
Cash-on-Cash Return
2.5%
Cap rate
0.6%
Rent to Value Ratio
Active
$99,999
3
bds
|
1
ba
|
880
sqft
|
built
1953
12219 S Throop St, Chicago, IL 60643
$766
Cash flow
40.0%
Cash-on-Cash Return
14.9%
Cap rate
2.0%
Rent to Value Ratio
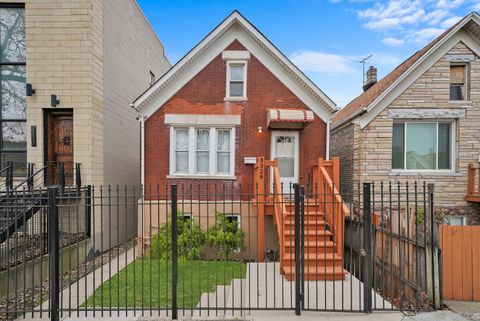
Active
$449,000
4
bds
|
2
ba
|
2,000
sqft
|
built
1888
3328 S Damen Ave, Chicago, IL 60608
$-331
Cash flow
-3.8%
Cash-on-Cash Return
4.8%
Cap rate
0.7%
Rent to Value Ratio
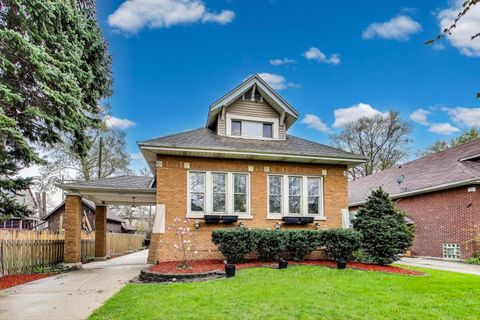
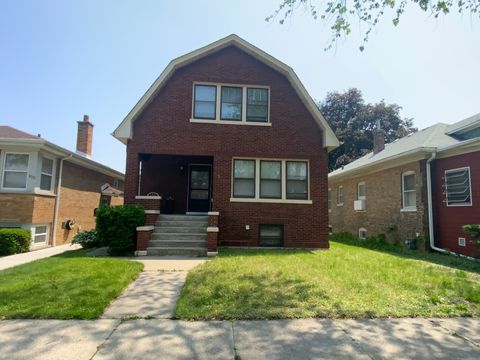
Active
$379,900
3
bds
|
2
ba
|
2,108
sqft
|
built
1926
2253 W 110th Pl, Chicago, IL 60643
$172
Cash flow
2.4%
Cash-on-Cash Return
6.2%
Cap rate
0.9%
Rent to Value Ratio
Active
$459,000
6
bds
|
2
ba
|
0
sqft
|
built
1924
5092 W Monroe St, Chicago, IL 60644
$-1,169
Cash flow
-13.3%
Cash-on-Cash Return
2.6%
Cap rate
0.4%
Rent to Value Ratio
Active
$449,900
3
bds
|
2
ba
|
1,060
sqft
|
built
1968
2620 W 36th Pl, Chicago, IL 60632
$-1,209
Cash flow
-14.0%
Cash-on-Cash Return
2.5%
Cap rate
0.4%
Rent to Value Ratio
Active
$304,900
2
bds
|
1
ba
|
942
sqft
|
built
1958
4324 Wisconsin Ave, Stickney, IL 60402
$-366
Cash flow
-6.3%
Cash-on-Cash Return
4.2%
Cap rate
0.7%
Rent to Value Ratio
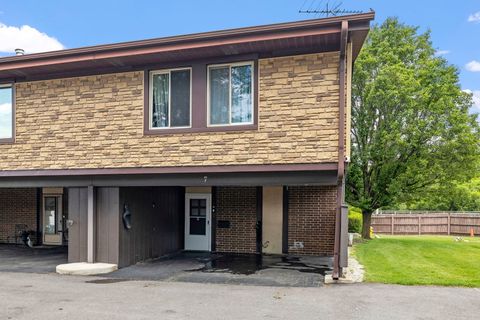
Active
$285,000
3
bds
|
2
ba
|
1,240
sqft
|
built
1975
7 Cour Versaille, Palos Hills, IL 60465
$94
Cash flow
1.7%
Cash-on-Cash Return
6.1%
Cap rate
1.0%
Rent to Value Ratio
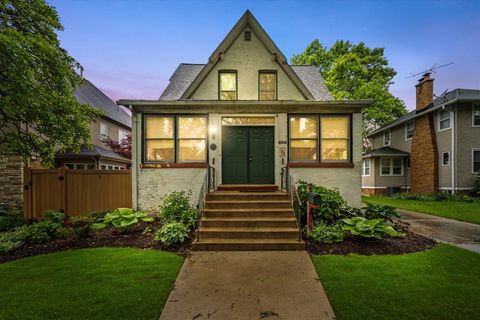
Active
$574,900
3
bds
|
3
ba
|
1,954
sqft
|
built
1938
1021 Cleveland Ave, Park Ridge, IL 60068
$-1,277
Cash flow
-11.6%
Cash-on-Cash Return
3.0%
Cap rate
0.6%
Rent to Value Ratio
Active
$958,000
5
bds
|
3
ba
|
3,000
sqft
|
built
1972
3622 Dauphine Ave, Northbrook, IL 60062
$-2,606
Cash flow
-14.2%
Cash-on-Cash Return
2.4%
Cap rate
0.5%
Rent to Value Ratio
Active
$175,000
0
bds
|
1
ba
|
550
sqft
|
built
1957
253 E Delaware Pl, Chicago, IL 60611
$-246
Cash flow
-7.3%
Cash-on-Cash Return
4.0%
Cap rate
1.0%
Rent to Value Ratio
Active
$300,000
2
bds
|
2
ba
|
1,274
sqft
|
built
1917
1949 N Whipple St, Chicago, IL 60647
$-378
Cash flow
-6.6%
Cash-on-Cash Return
4.2%
Cap rate
0.9%
Rent to Value Ratio
Active
$244,900
3
bds
|
2
ba
|
1,016
sqft
|
built
1962
3034 190th St, Lansing, IL 60438
$-270
Cash flow
-5.8%
Cash-on-Cash Return
4.4%
Cap rate
0.9%
Rent to Value Ratio
Active
$249,700
3
bds
|
2
ba
|
1,600
sqft
|
built
1977
18200 Fountainbleau Dr, Hazel Crest, IL 60429
$24
Cash flow
0.5%
Cash-on-Cash Return
5.8%
Cap rate
1.1%
Rent to Value Ratio
Active
$419,900
2
bds
|
2
ba
|
1,100
sqft
|
built
1926
2676 Julian Ter, River Grove, IL 60171
$-915
Cash flow
-11.4%
Cash-on-Cash Return
3.1%
Cap rate
0.5%
Rent to Value Ratio
Active
$499,900
4
bds
|
3
ba
|
0
sqft
|
built
1913
3312 N California Ave, Chicago, IL 60618
$-653
Cash flow
-6.8%
Cash-on-Cash Return
4.1%
Cap rate
0.7%
Rent to Value Ratio
Active
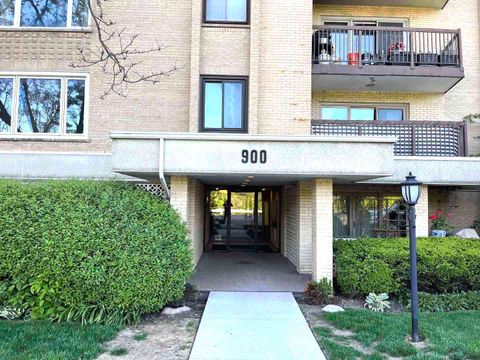
$265,000
2
bds
|
2
ba
|
1,200
sqft
|
built
1974
900 S River Rd, Des Plaines, IL 60016
$-434
Cash flow
-8.5%
Cash-on-Cash Return
3.7%
Cap rate
0.8%
Rent to Value Ratio
Active
$549,900
3
bds
|
2
ba
|
2,300
sqft
|
built
1956
3900 Jerome Ave, Skokie, IL 60076
$-1,547
Cash flow
-14.7%
Cash-on-Cash Return
2.3%
Cap rate
0.5%
Rent to Value Ratio
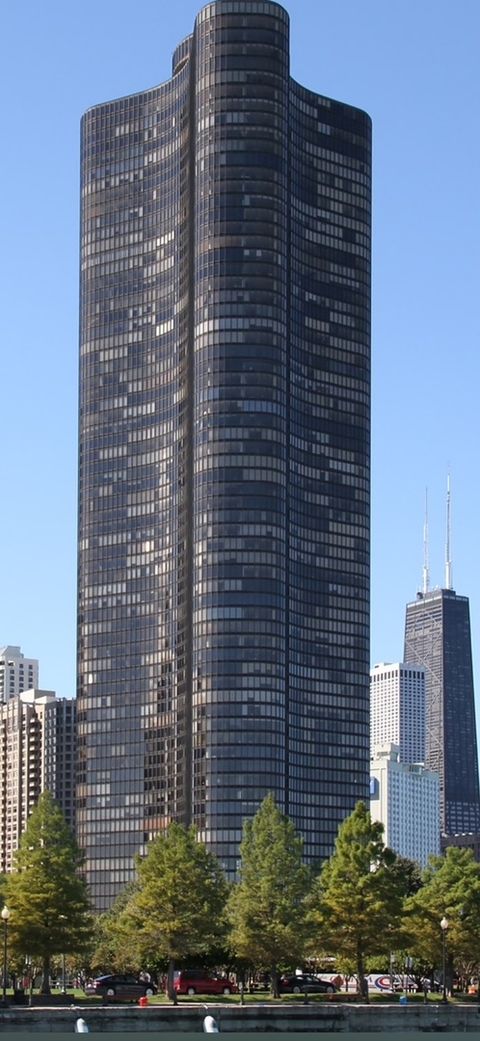
Active
$615,000
2
bds
|
2
ba
|
1,450
sqft
|
built
1968
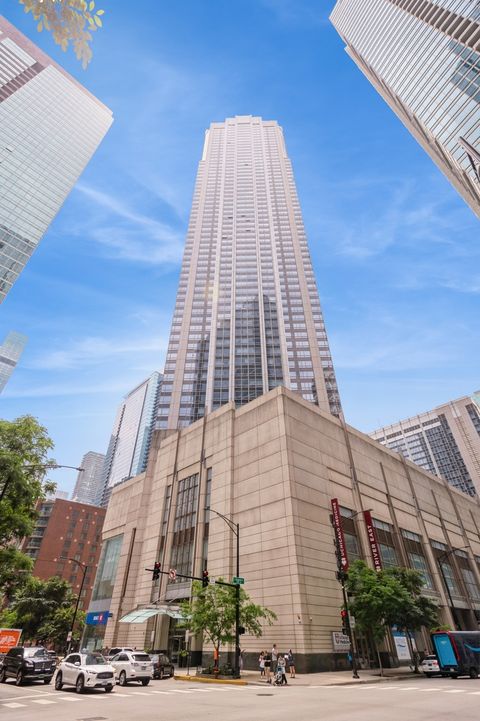
505 N Lake Shore Dr, Chicago, IL 60611
$-1,938
Cash flow
-16.4%
Cash-on-Cash Return
1.9%
Cap rate
0.7%
Rent to Value Ratio
Active
$489,000
4
bds
|
3
ba
|
2,241
sqft
|
built
1975
8559 Broadmoor Dr, Palos Hills, IL 60465
$-758
Cash flow
-8.1%
Cash-on-Cash Return
3.8%
Cap rate
0.7%
Rent to Value Ratio
Active
$189,900
8
bds
|
4
ba
|
0
sqft
|
built
1963
173 E 151st St, Harvey, IL 60426
$-2,417
Cash flow
-66.4%
Cash-on-Cash Return
-9.6%
Cap rate
0.9%
Rent to Value Ratio
Active
$689,900
4
bds
|
3
ba
|
3,500
sqft
|
built
1951
5938 N Sacramento Ave, Chicago, IL 60659
$-1,984
Cash flow
-15.0%
Cash-on-Cash Return
2.2%
Cap rate
0.4%
Rent to Value Ratio
Active
$485,000
2
bds
|
2
ba
|
1,241
sqft
|
built
2000
630 N State St, Chicago, IL 60654
$-1,580
Cash flow
-17.0%
Cash-on-Cash Return
1.8%
Cap rate
0.7%
Rent to Value Ratio
Active
$490,000
5
bds
|
3
ba
|
2,571
sqft
|
built
1929
4517 N Austin Ave, Chicago, IL 60630
$-608
Cash flow
-6.5%
Cash-on-Cash Return
4.2%
Cap rate
0.7%
Rent to Value Ratio
Active
$325,000
1
bds
|
1
ba
|
920
sqft
|
built
2001
512 N Mc Clurg Ct, Chicago, IL 60611
$-793
Cash flow
-12.7%
Cash-on-Cash Return
2.8%
Cap rate
0.8%
Rent to Value Ratio
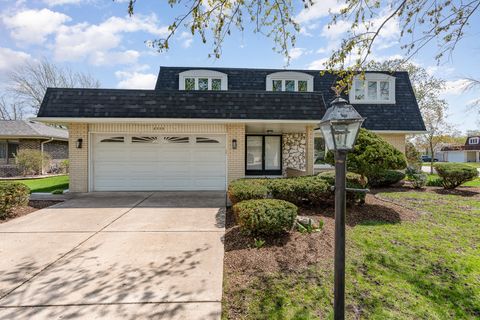
Active
$529,000
4
bds
|
2
ba
|
1,900
sqft
|
built
1966
2023 N Shenandoah Dr, Arlington Heights, IL 60004
$-765
Cash flow
-7.5%
Cash-on-Cash Return
3.9%
Cap rate
0.7%
Rent to Value Ratio
Active
$399,999
2
bds
|
2
ba
|
1,733
sqft
|
built
2006
77 N Quentin Rd, Palatine, IL 60067
$-859
Cash flow
-11.2%
Cash-on-Cash Return
3.1%
Cap rate
0.8%
Rent to Value Ratio
Active
$214,900
2
bds
|
2
ba
|
1,200
sqft
|
built
1975
2638 N Windsor Dr, Arlington Heights, IL 60004
$-264
Cash flow
-6.4%
Cash-on-Cash Return
4.2%
Cap rate
1.0%
Rent to Value Ratio
Active
$710,000
3
bds
|
3
ba
|
2,400
sqft
|
built
1999
5414 S Greenwood Ave, Chicago, IL 60615
$-1,437
Cash flow
-10.6%
Cash-on-Cash Return
3.3%
Cap rate
0.6%
Rent to Value Ratio
Active
$759,000
12
bds
|
7
ba
|
0
sqft
|
built
1920
1531 S Kolin Ave, Chicago, IL 60623
$-2,671
Cash flow
-18.4%
Cash-on-Cash Return
1.5%
Cap rate
0.3%
Rent to Value Ratio
Active
$409,900
3
bds
|
2
ba
|
1,377
sqft
|
built
1888
606 N Brainard Ave, La Grange Park, IL 60526
$-356
Cash flow
-4.5%
Cash-on-Cash Return
4.6%
Cap rate
0.9%
Rent to Value Ratio
Active
$314,500
3
bds
|
2
ba
|
0
sqft
|
built
1924
3019 Wesley Ave, Berwyn, IL 60402
$-853
Cash flow
-14.2%
Cash-on-Cash Return
2.4%
Cap rate
0.6%
Rent to Value Ratio