Cook County Investment Properties for Sale
Browse homes for sale and investment properties in Cook County. Refine your search by price, property type, or more.
Best cash flowing properties in Cook County
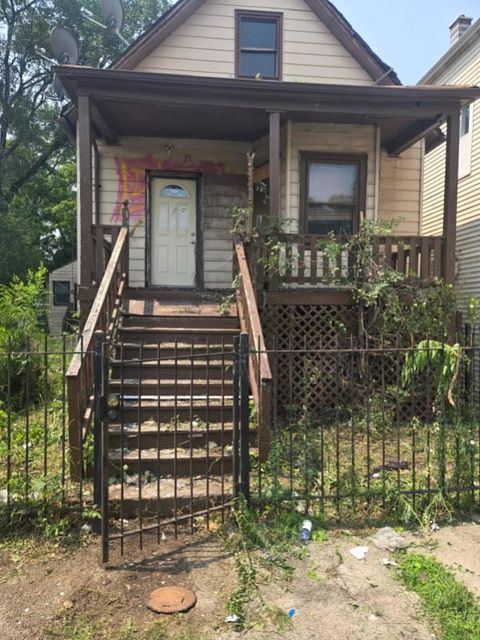
Active
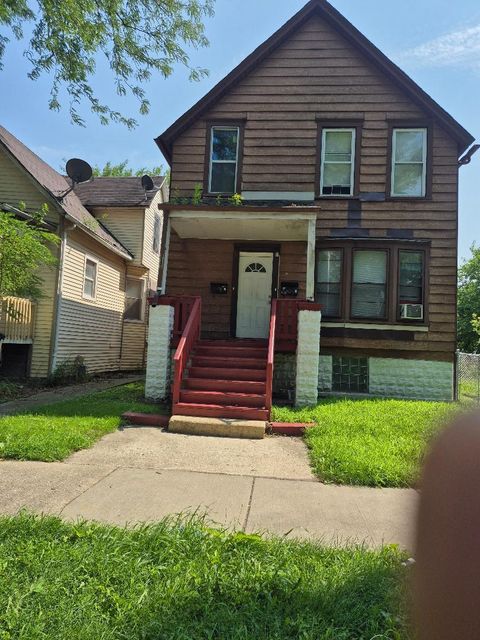
$74,900
4
bds
|
2
ba
|
1,300
sqft
|
built
1902
7010 S Paulina St, Chicago, IL 60636
$1,310
Cash flow
20.4%
Cash-on-Cash Return
21.0%
Cap rate
2.7%
Rent to Value Ratio

Active
$54,900
3
bds
|
1
ba
|
1,200
sqft
|
built
1913
10510 S Perry Ave, Chicago, IL 60628
$1,262
Cash flow
26.8%
Cash-on-Cash Return
27.6%
Cap rate
3.5%
Rent to Value Ratio
5,021 out of 5,819 properties for sale in Cook County
Limited Results Shown
Create a free account, or log in to reveal all property listings and enjoy the complete experience.
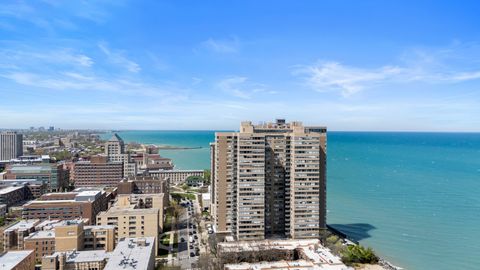
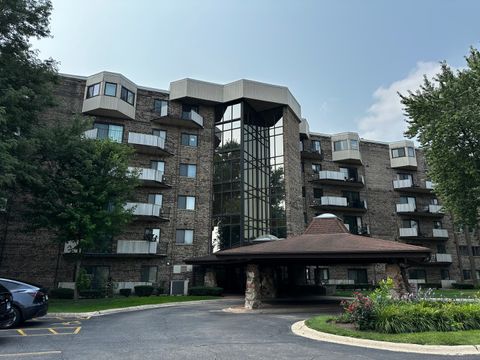
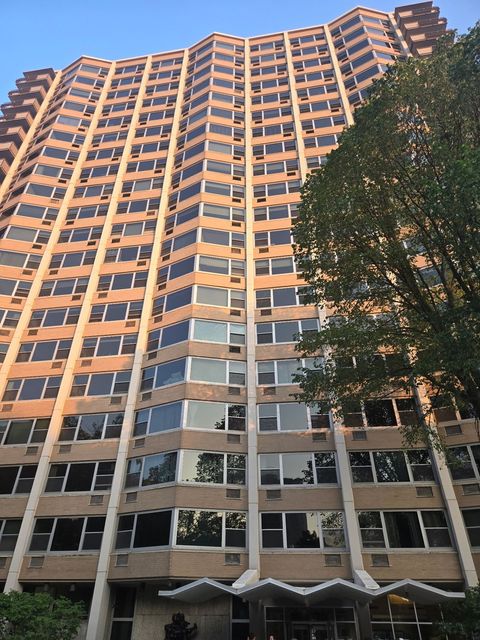
Active
$249,900
3
bds
|
2
ba
|
0
sqft
|
built
1970
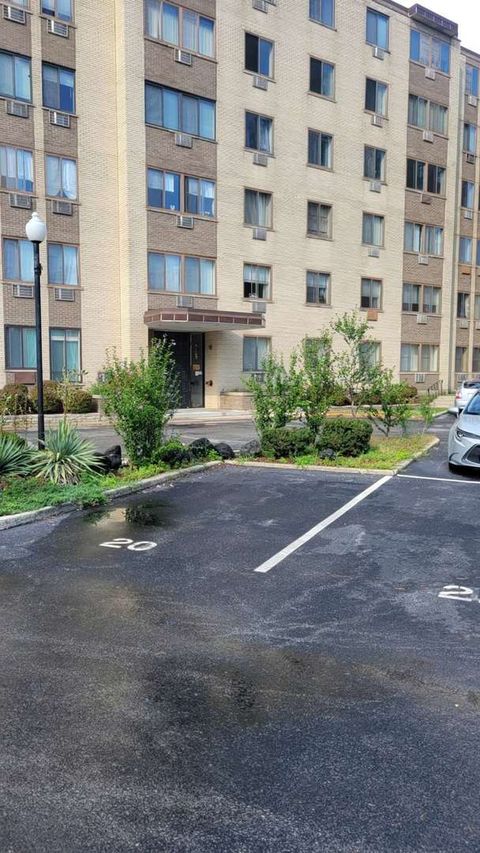
6301 N Sheridan Rd, Chicago, IL 60660
$-1,262
Cash flow
-26.3%
Cash-on-Cash Return
-0.4%
Cap rate
1.0%
Rent to Value Ratio

Active
$240,000
2
bds
|
2
ba
|
1,200
sqft
|
built
1975
1926 Prairie Sq, Schaumburg, IL 60173
$-566
Cash flow
-12.3%
Cash-on-Cash Return
2.9%
Cap rate
0.8%
Rent to Value Ratio
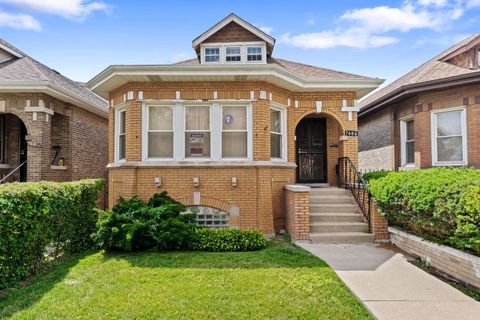
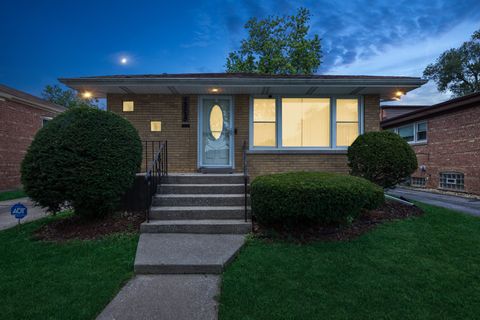
Active
$259,900
3
bds
|
2
ba
|
1,146
sqft
|
built
1928
7636 S Winchester Ave, Chicago, IL 60620
$279
Cash flow
5.6%
Cash-on-Cash Return
7.0%
Cap rate
0.8%
Rent to Value Ratio
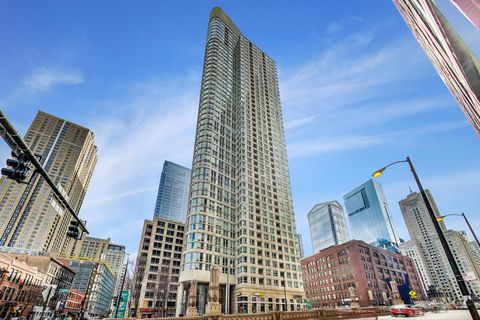
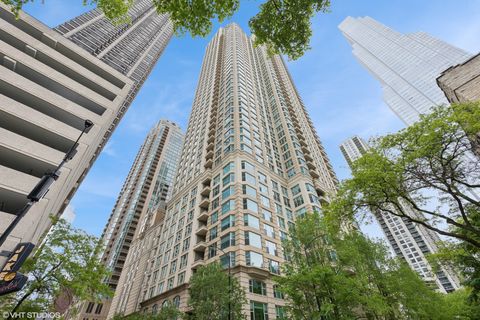
Active
$330,000
1
bds
|
1
ba
|
860
sqft
|
built
2001
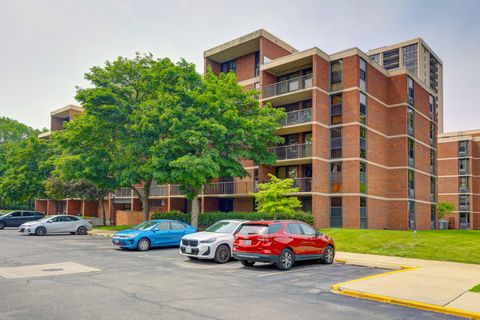
345 N La Salle Dr, Chicago, IL 60654
$-837
Cash flow
-13.2%
Cash-on-Cash Return
2.6%
Cap rate
0.8%
Rent to Value Ratio
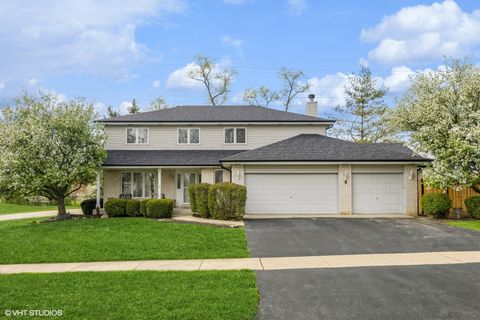
Active
$425,000
3
bds
|
2
ba
|
1,394
sqft
|
built
1954
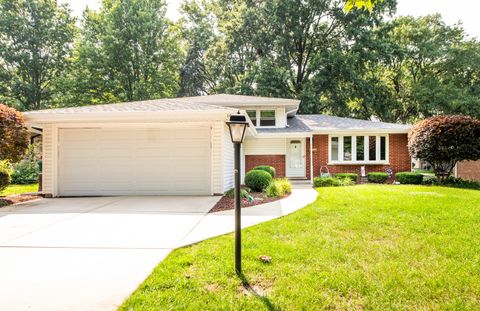
7939 N Neva Ave, Niles, IL 60714
$-69
Cash flow
-0.8%
Cash-on-Cash Return
5.5%
Cap rate
0.7%
Rent to Value Ratio
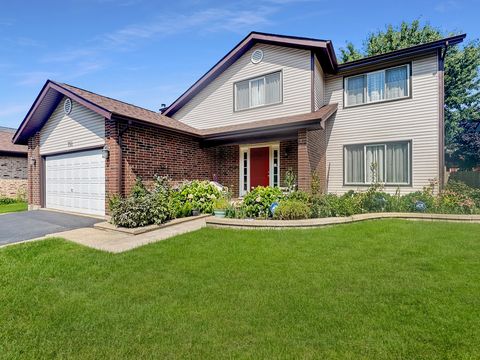
Active
$439,900
3
bds
|
2
ba
|
1,304
sqft
|
built
1949
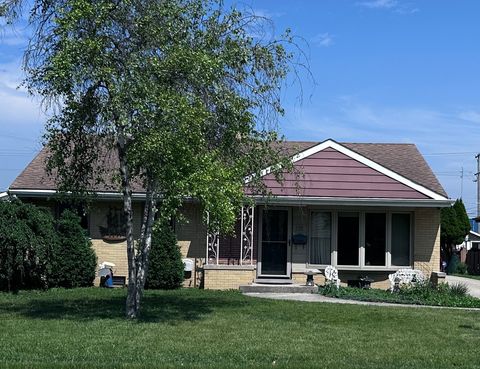
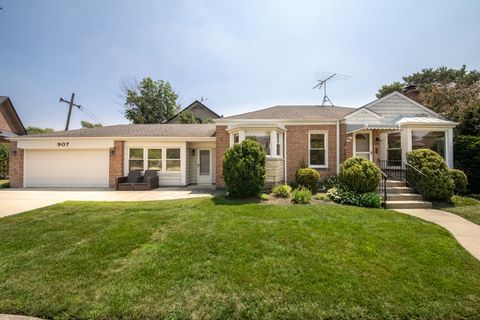
907 Wilkinson Pkwy, Park Ridge, IL 60068
$-613
Cash flow
-7.3%
Cash-on-Cash Return
4.0%
Cap rate
0.7%
Rent to Value Ratio
Active
$159,000
5
bds
|
2
ba
|
0
sqft
|
built
1920
2032 N 18th Ave, Melrose Park, IL 60160
$113
Cash flow
3.7%
Cash-on-Cash Return
6.5%
Cap rate
1.4%
Rent to Value Ratio
Active
$149,500
1
bds
|
1
ba
|
700
sqft
|
built
1972
2941 S Michigan Ave, Chicago, IL 60616
$-326
Cash flow
-11.4%
Cash-on-Cash Return
3.1%
Cap rate
1.1%
Rent to Value Ratio
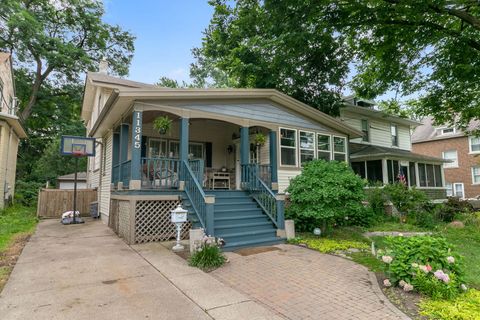
Active
$574,900
3
bds
|
3
ba
|
1,396
sqft
|
built
1916
11345 S Bell Ave, Chicago, IL 60643
$-943
Cash flow
-8.6%
Cash-on-Cash Return
3.7%
Cap rate
0.5%
Rent to Value Ratio
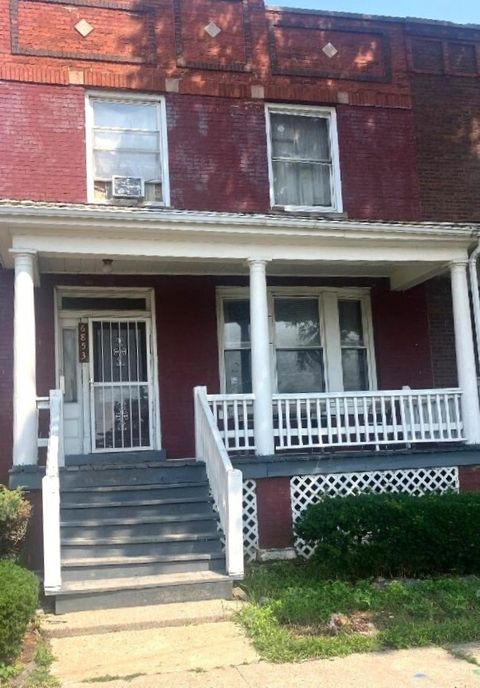
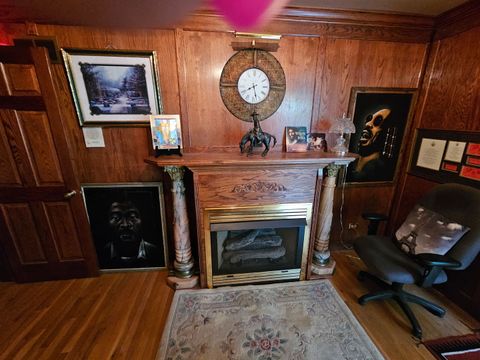
Active
$150,000
3
bds
|
2
ba
|
1,600
sqft
|
built
1915
6853 S Saint Lawrence Ave, Chicago, IL 60637
$833
Cash flow
29.0%
Cash-on-Cash Return
12.3%
Cap rate
1.7%
Rent to Value Ratio
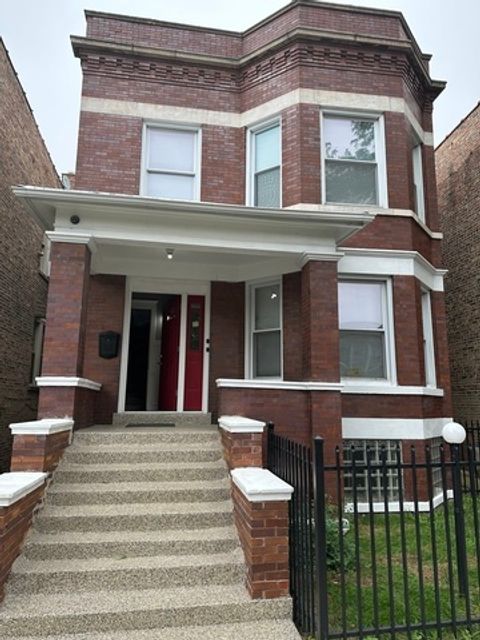
Active
$320,000
5
bds
|
2
ba
|
0
sqft
|
built
1910
7137 S Saint Lawrence Ave, Chicago, IL 60619
$-266
Cash flow
-4.3%
Cash-on-Cash Return
4.7%
Cap rate
0.6%
Rent to Value Ratio
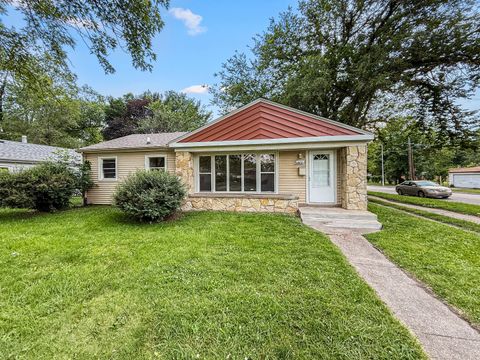
Active
$215,000
4
bds
|
2
ba
|
1,682
sqft
|
built
1953
16802 Anthony Ave, Hazel Crest, IL 60429
$5
Cash flow
0.1%
Cash-on-Cash Return
5.7%
Cap rate
1.0%
Rent to Value Ratio
Active
$299,900
6
bds
|
3
ba
|
2,150
sqft
|
built
1923
691 Wentworth Ave, Calumet City, IL 60409
$-316
Cash flow
-5.5%
Cash-on-Cash Return
4.4%
Cap rate
0.8%
Rent to Value Ratio
Active
$289,000
3
bds
|
3
ba
|
1,403
sqft
|
built
1928
9413 S Prairie Ave, Chicago, IL 60619
$172
Cash flow
3.1%
Cash-on-Cash Return
6.4%
Cap rate
0.9%
Rent to Value Ratio
Active
$229,000
2
bds
|
2
ba
|
1,200
sqft
|
built
1970
6325 N Sheridan Rd, Chicago, IL 60660
$-618
Cash flow
-14.1%
Cash-on-Cash Return
2.4%
Cap rate
1.1%
Rent to Value Ratio
Active
$439,900
2
bds
|
4
ba
|
1,988
sqft
|
built
2013
16516 Timber Trl, Orland Park, IL 60467
$-718
Cash flow
-8.5%
Cash-on-Cash Return
3.7%
Cap rate
0.7%
Rent to Value Ratio
Active
$219,900
2
bds
|
2
ba
|
1,250
sqft
|
built
1978
1275 E Baldwin Ln, Palatine, IL 60074
$-360
Cash flow
-8.5%
Cash-on-Cash Return
3.7%
Cap rate
1.0%
Rent to Value Ratio
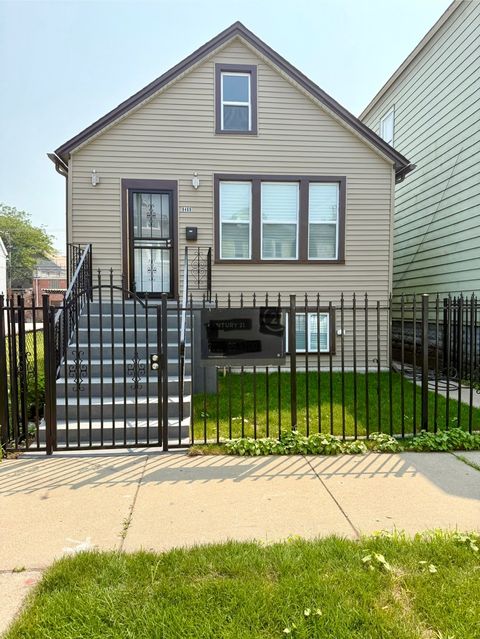
Active
$54,900
4
bds
|
2
ba
|
1,400
sqft
|
built
1912
11532 S Harvard Ave, Chicago, IL 60628
$1,184
Cash flow
25.1%
Cash-on-Cash Return
25.9%
Cap rate
3.3%
Rent to Value Ratio
Active
$299,000
4
bds
|
2
ba
|
0
sqft
|
built
1913
225 W 108th Pl, Chicago, IL 60628
$-442
Cash flow
-7.7%
Cash-on-Cash Return
3.9%
Cap rate
0.5%
Rent to Value Ratio
Active
$230,000
3
bds
|
2
ba
|
1,033
sqft
|
built
1960
15320 Evers St, Dolton, IL 60419
$-257
Cash flow
-5.8%
Cash-on-Cash Return
4.3%
Cap rate
0.9%
Rent to Value Ratio
Active
$632,000
4
bds
|
4
ba
|
3,382
sqft
|
built
1997
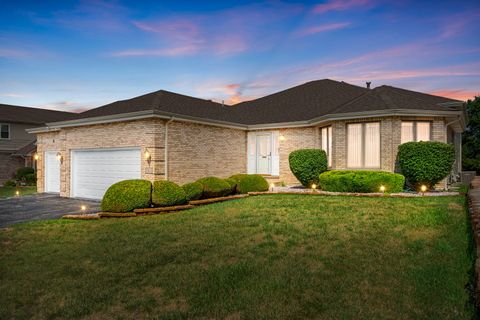
10401 Bloomfield Dr, Palos Park, IL 60464
$-972
Cash flow
-8.0%
Cash-on-Cash Return
3.8%
Cap rate
0.7%
Rent to Value Ratio
Active
$215,000
1
bds
|
1
ba
|
720
sqft
|
built
1961
555 W Cornelia Ave, Chicago, IL 60657
$-502
Cash flow
-12.2%
Cash-on-Cash Return
2.9%
Cap rate
1.0%
Rent to Value Ratio
Active
$419,900
3
bds
|
2
ba
|
1,134
sqft
|
built
1956
10012 S 52nd Ave, Oak Lawn, IL 60453
$-841
Cash flow
-10.4%
Cash-on-Cash Return
3.3%
Cap rate
0.6%
Rent to Value Ratio
Active
$399,000
5
bds
|
2
ba
|
1,934
sqft
|
built
1971
7505 165th St, Tinley Park, IL 60477
$-75
Cash flow
-1.0%
Cash-on-Cash Return
5.5%
Cap rate
0.9%
Rent to Value Ratio
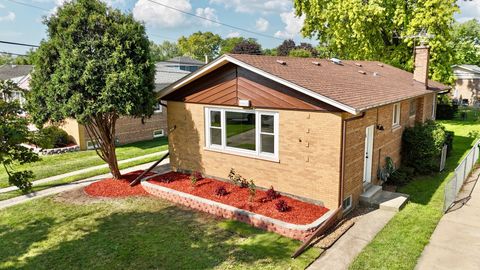
Active
$271,000
3
bds
|
1
ba
|
1,200
sqft
|
built
1900
3718 W 64th St, Chicago, IL 60629
$-15
Cash flow
-0.3%
Cash-on-Cash Return
5.6%
Cap rate
0.8%
Rent to Value Ratio
Active
$359,900
3
bds
|
2
ba
|
1,635
sqft
|
built
1968
14440 Brentwood St, Orland Park, IL 60462
$-328
Cash flow
-4.8%
Cash-on-Cash Return
4.6%
Cap rate
0.8%
Rent to Value Ratio
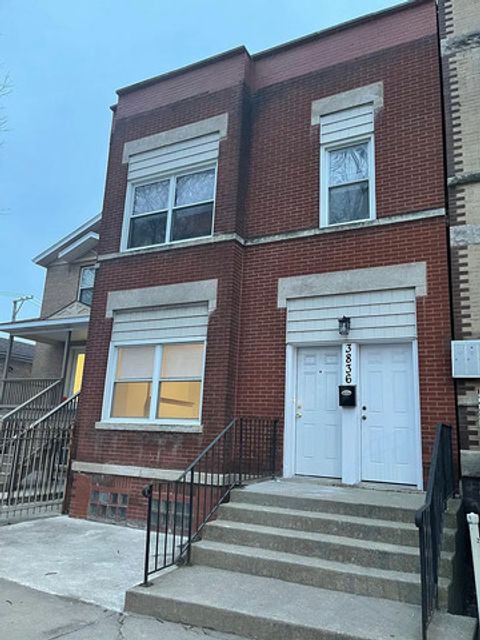
Active
$524,999
7
bds
|
2
ba
|
0
sqft
|
built
1888
3836 S Parnell Ave, Chicago, IL 60609
$-1,529
Cash flow
-15.2%
Cash-on-Cash Return
2.2%
Cap rate
0.4%
Rent to Value Ratio
Active
$1,625,000
3
bds
|
3
ba
|
2,610
sqft
|
built
2003
25 E Superior St, Chicago, IL 60611
$-6,878
Cash flow
-22.1%
Cash-on-Cash Return
0.6%
Cap rate
0.4%
Rent to Value Ratio
Active
$725,000
5
bds
|
6
ba
|
5,945
sqft
|
built
1996
22775 Sherman Rd, Steger, IL 60475
$-2,371
Cash flow
-17.1%
Cash-on-Cash Return
1.8%
Cap rate
0.6%
Rent to Value Ratio
Active
$599,900
4
bds
|
3
ba
|
2,240
sqft
|
built
1987
751 Garth Rd, Wheeling, IL 60090
$-1,007
Cash flow
-8.8%
Cash-on-Cash Return
3.7%
Cap rate
0.6%
Rent to Value Ratio
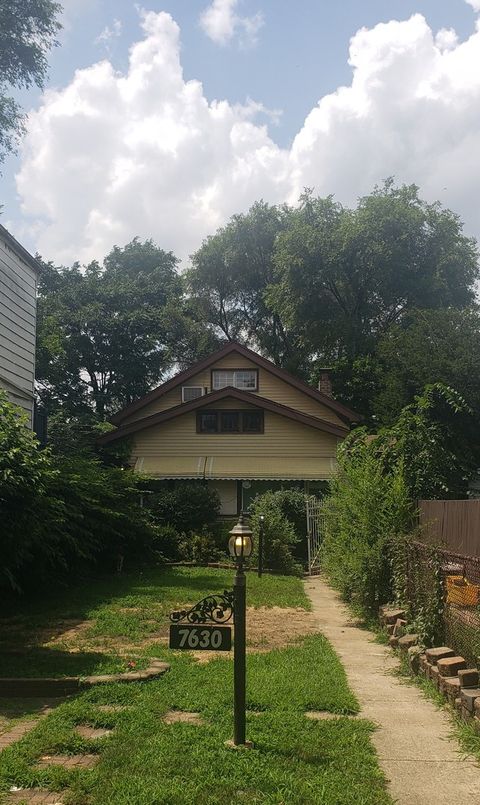
Active
$50,000
2
bds
|
1
ba
|
1,500
sqft
|
built
1908
7630 S Champlain Ave, Chicago, IL 60619
$1,104
Cash flow
25.7%
Cash-on-Cash Return
26.5%
Cap rate
3.2%
Rent to Value Ratio
Active
$389,900
3
bds
|
2
ba
|
1,280
sqft
|
built
1958
6524 N Northwest Hwy, Chicago, IL 60631
$-580
Cash flow
-7.8%
Cash-on-Cash Return
3.9%
Cap rate
0.7%
Rent to Value Ratio
Active
$244,900
3
bds
|
2
ba
|
1,280
sqft
|
built
1900
8409 S Brandon Ave, Chicago, IL 60617
$-218
Cash flow
-4.6%
Cash-on-Cash Return
4.6%
Cap rate
0.6%
Rent to Value Ratio
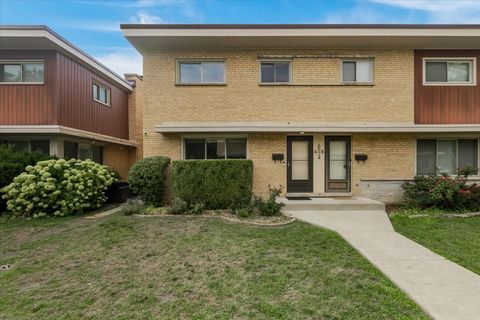
Active
$165,000
2
bds
|
2
ba
|
1,000
sqft
|
built
1967
9725 S Karlov Ave, Oak Lawn, IL 60453
$-120
Cash flow
-3.8%
Cash-on-Cash Return
4.8%
Cap rate
1.1%
Rent to Value Ratio
Active
$350,000
4
bds
|
4
ba
|
2,070
sqft
|
built
1998
23021 Eastbrook Dr, Sauk Village, IL 60411
$-43
Cash flow
-0.6%
Cash-on-Cash Return
5.5%
Cap rate
0.8%
Rent to Value Ratio
Active
$1,050,000
3
bds
|
2
ba
|
1,746
sqft
|
built
2008
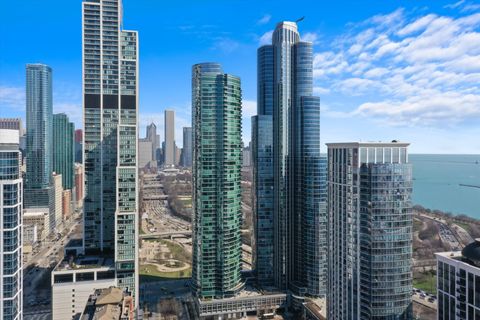
1201 S Prairie Ave, Chicago, IL 60605
$-5,824
Cash flow
-28.9%
Cash-on-Cash Return
-1.0%
Cap rate
0.3%
Rent to Value Ratio
Active
$299,500
1
bds
|
1
ba
|
995
sqft
|
built
1986
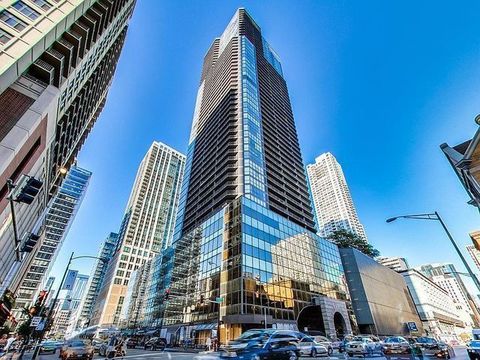
10 E Ontario St, Chicago, IL 60611
$-1,107
Cash flow
-19.3%
Cash-on-Cash Return
1.2%
Cap rate
0.8%
Rent to Value Ratio
Active
$499,000
3
bds
|
2
ba
|
1,777
sqft
|
built
1921
3909 N New England Ave, Chicago, IL 60634
$-506
Cash flow
-5.3%
Cash-on-Cash Return
4.5%
Cap rate
0.6%
Rent to Value Ratio