Cook County Investment Properties for Sale
Browse homes for sale and investment properties in Cook County. Refine your search by price, property type, or more.
Best cash flowing properties in Cook County
Active
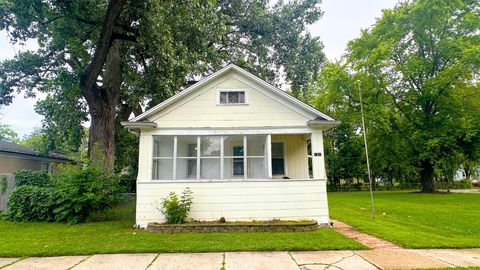
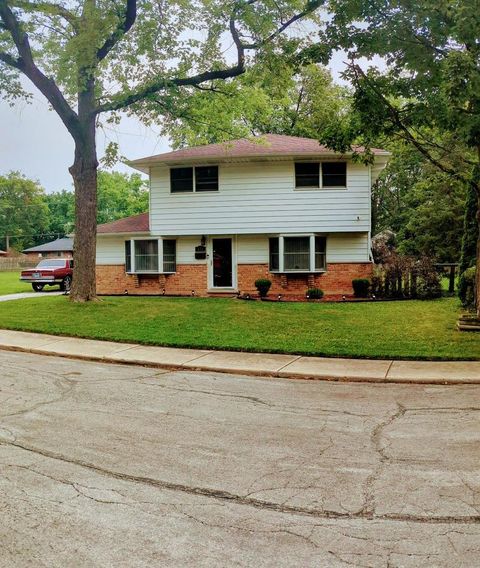
$205,000
3
bds
|
1
ba
|
1,100
sqft
|
built
1918
2030 170th St, Hazel Crest, IL 60429
$371
Cash flow
9.4%
Cash-on-Cash Return
7.8%
Cap rate
1.2%
Rent to Value Ratio
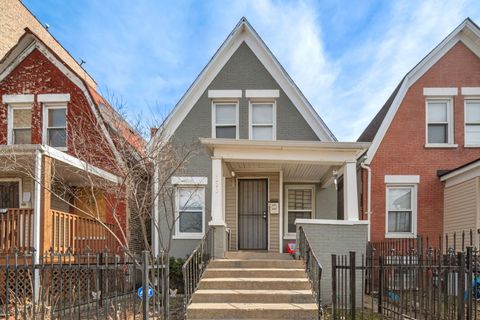
Active
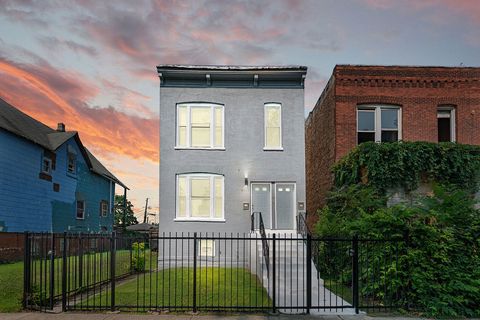
$172,000
3
bds
|
2
ba
|
0
sqft
|
built
1898
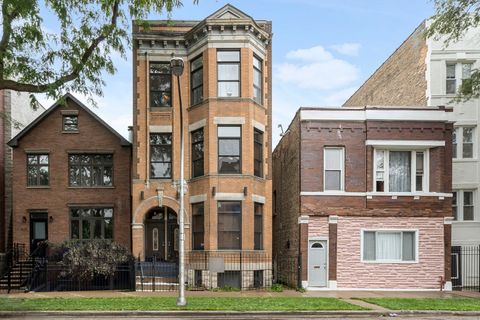
1223 S Keeler Ave, Chicago, IL 60623
$357
Cash flow
10.8%
Cash-on-Cash Return
8.2%
Cap rate
1.0%
Rent to Value Ratio
5,242 out of 6,069 properties for sale in Cook County
Limited Results Shown
Create a free account, or log in to reveal all property listings and enjoy the complete experience.
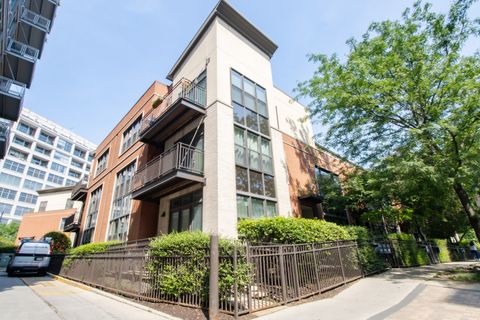
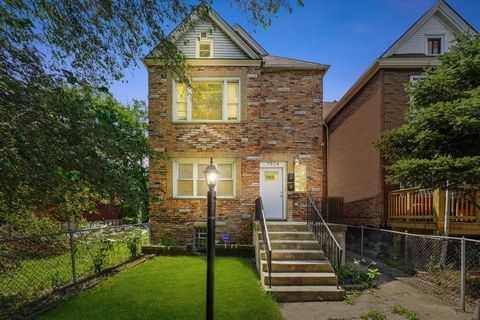
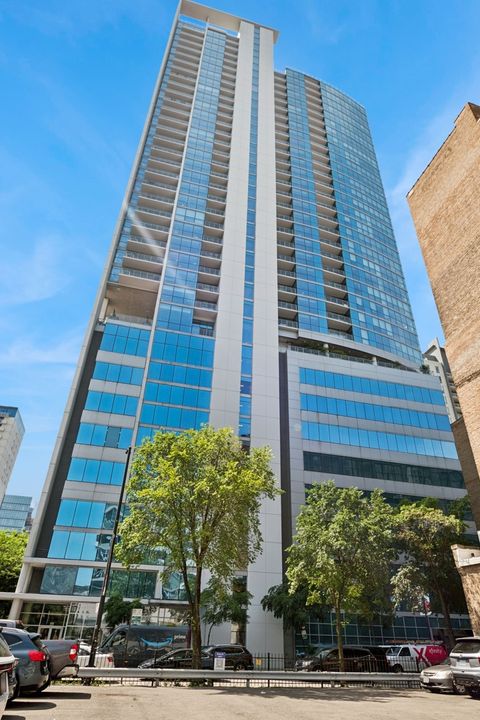
Active
$340,000
2
bds
|
1
ba
|
900
sqft
|
built
2004
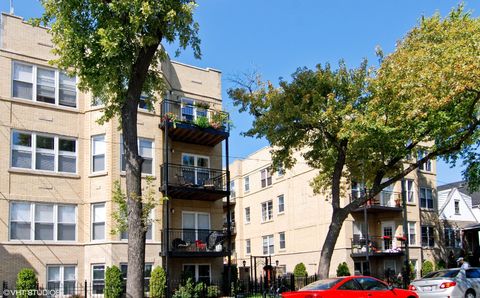
906 N Larrabee St, Chicago, IL 60610
$-413
Cash flow
-6.3%
Cash-on-Cash Return
4.2%
Cap rate
0.8%
Rent to Value Ratio
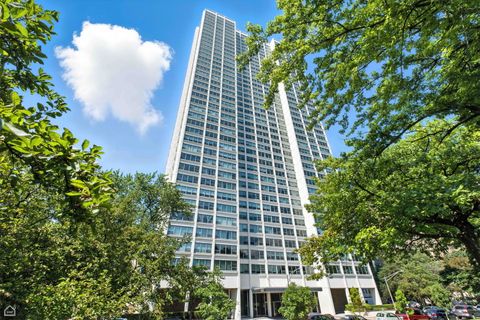
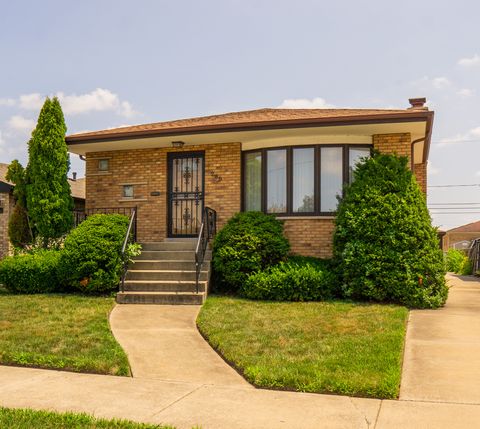
Active
$339,900
2
bds
|
2
ba
|
1,250
sqft
|
built
1968
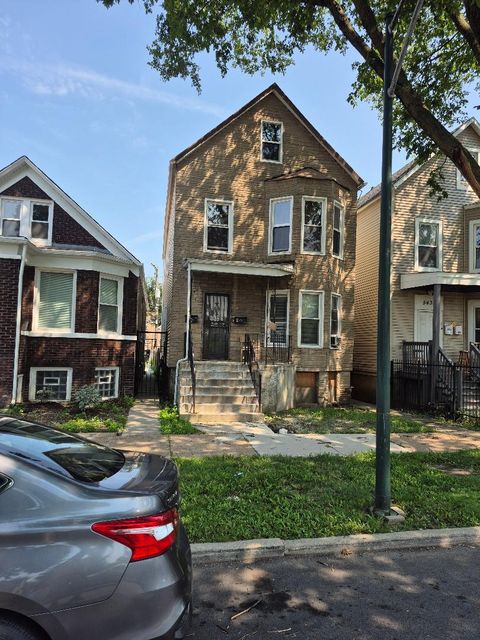
1700 E 56th St, Chicago, IL 60637
$-1,111
Cash flow
-17.1%
Cash-on-Cash Return
1.8%
Cap rate
0.8%
Rent to Value Ratio
Active
$369,900
6
bds
|
2
ba
|
0
sqft
|
built
1888
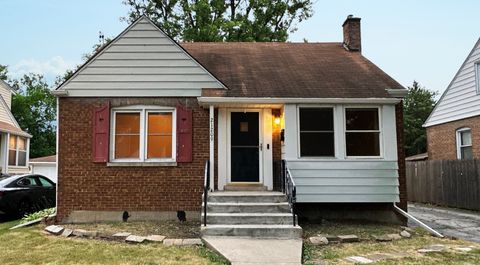
7924 S Lowe Ave, Chicago, IL 60620
$-708
Cash flow
-10.0%
Cash-on-Cash Return
3.4%
Cap rate
0.4%
Rent to Value Ratio
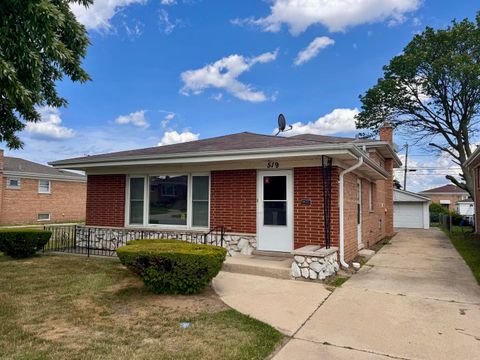
Active
$257,000
3
bds
|
2
ba
|
1,313
sqft
|
built
1972
519 Paxton Ave, Calumet City, IL 60409
$-414
Cash flow
-8.4%
Cash-on-Cash Return
3.7%
Cap rate
0.9%
Rent to Value Ratio
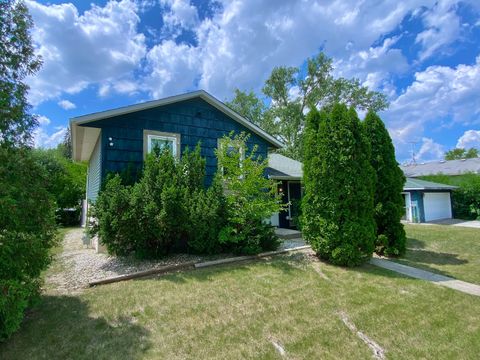
Active
$213,000
3
bds
|
2
ba
|
1,000
sqft
|
built
1975
22200 Windsor Ct, Richton Park, IL 60471
$-90
Cash flow
-2.2%
Cash-on-Cash Return
5.2%
Cap rate
0.9%
Rent to Value Ratio
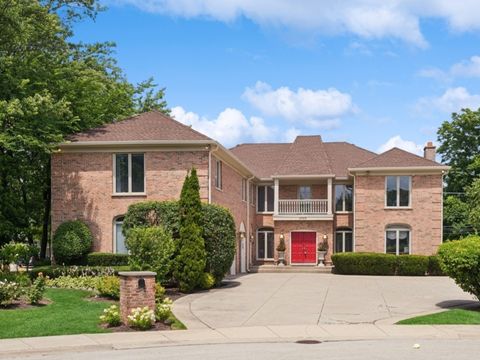
Active
$1,300,000
5
bds
|
6
ba
|
5,720
sqft
|
built
1990
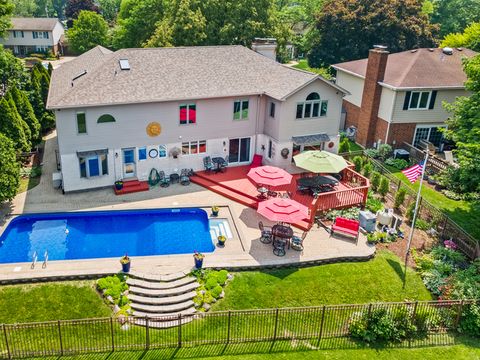
2509 Astor Ct, Glenview, IL 60026
$-3,554
Cash flow
-14.3%
Cash-on-Cash Return
2.4%
Cap rate
0.5%
Rent to Value Ratio
Active
$230,000
1
bds
|
1
ba
|
887
sqft
|
built
1955
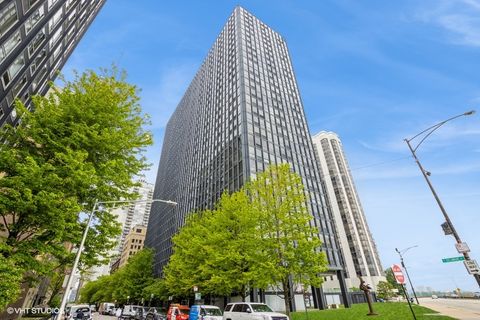
900 N Lake Shore Dr, Chicago, IL 60611
$-446
Cash flow
-10.1%
Cash-on-Cash Return
3.3%
Cap rate
1.2%
Rent to Value Ratio
Active
$1,380,000
5
bds
|
4
ba
|
3,750
sqft
|
built
1977
1424 E Jonquil Cir, Arlington Heights, IL 60004
$-4,580
Cash flow
-17.3%
Cash-on-Cash Return
1.7%
Cap rate
0.3%
Rent to Value Ratio
Active
$899,000
4
bds
|
4
ba
|
2,781
sqft
|
built
1908
400 S Green St, Chicago, IL 60607
$-2,101
Cash flow
-12.2%
Cash-on-Cash Return
2.9%
Cap rate
0.9%
Rent to Value Ratio
Active
$389,900
4
bds
|
3
ba
|
2,021
sqft
|
built
1991
1159 Spring Creek Rd, Elgin, IL 60120
$-378
Cash flow
-5.1%
Cash-on-Cash Return
4.5%
Cap rate
0.8%
Rent to Value Ratio
Active
$330,000
2
bds
|
2
ba
|
1,264
sqft
|
built
1945
3121 N Normandy Ave, Chicago, IL 60634
$-89
Cash flow
-1.4%
Cash-on-Cash Return
5.4%
Cap rate
0.9%
Rent to Value Ratio
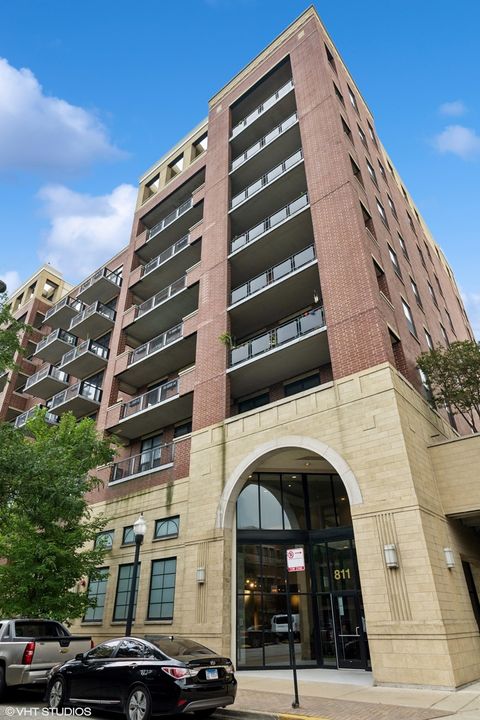
Active
$235,000
1
bds
|
1
ba
|
700
sqft
|
built
2003
811 W 15th Pl, Chicago, IL 60608
$-380
Cash flow
-8.4%
Cash-on-Cash Return
3.7%
Cap rate
0.8%
Rent to Value Ratio
Active
$315,000
4
bds
|
2
ba
|
2,300
sqft
|
built
1924
13621 S Homan Ave, Robbins, IL 60472
$5
Cash flow
0.1%
Cash-on-Cash Return
5.7%
Cap rate
0.7%
Rent to Value Ratio
Active
$799,900
3
bds
|
2
ba
|
2,200
sqft
|
built
1892
1013 W Webster Ave, Chicago, IL 60614
$-1,488
Cash flow
-9.7%
Cash-on-Cash Return
3.4%
Cap rate
0.7%
Rent to Value Ratio
Active
$299,900
3
bds
|
2
ba
|
1,310
sqft
|
built
1903
1237 Clinton Ave, Berwyn, IL 60402
$-29
Cash flow
-0.5%
Cash-on-Cash Return
5.6%
Cap rate
0.9%
Rent to Value Ratio
Active
$1,365,000
5
bds
|
6
ba
|
4,090
sqft
|
built
1988
87 Windmill Rd, Orland Park, IL 60467
$-1,309
Cash flow
-5.0%
Cash-on-Cash Return
4.5%
Cap rate
0.7%
Rent to Value Ratio
Active
$599,000
2
bds
|
3
ba
|
2,144
sqft
|
built
2000
1041 W Bogey Ln, Palatine, IL 60067
$-1,736
Cash flow
-15.1%
Cash-on-Cash Return
2.2%
Cap rate
0.6%
Rent to Value Ratio
Active
$263,000
3
bds
|
2
ba
|
1,165
sqft
|
built
1963
1238 E 166th St, South Holland, IL 60473
$66
Cash flow
1.3%
Cash-on-Cash Return
6.0%
Cap rate
1.1%
Rent to Value Ratio
Active
$465,000
3
bds
|
3
ba
|
1,952
sqft
|
built
1901
1129 N Mozart St, Chicago, IL 60622
$-850
Cash flow
-9.5%
Cash-on-Cash Return
3.5%
Cap rate
0.7%
Rent to Value Ratio
Active
$195,000
2
bds
|
1
ba
|
0
sqft
|
built
1925
4018 N Albany Ave, Chicago, IL 60618
$-298
Cash flow
-8.0%
Cash-on-Cash Return
3.8%
Cap rate
0.8%
Rent to Value Ratio
Active
$299,000
4
bds
|
2
ba
|
0
sqft
|
built
1908
5427 S Wolcott Ave, Chicago, IL 60609
$-470
Cash flow
-8.2%
Cash-on-Cash Return
3.8%
Cap rate
0.5%
Rent to Value Ratio
Active
$214,000
3
bds
|
2
ba
|
1,500
sqft
|
built
1953
21209 Oak St, Matteson, IL 60443
$19
Cash flow
0.5%
Cash-on-Cash Return
5.8%
Cap rate
1.0%
Rent to Value Ratio
Active
$449,000
3
bds
|
3
ba
|
2,185
sqft
|
built
1995
6815 169th St, Tinley Park, IL 60477
$-862
Cash flow
-10.0%
Cash-on-Cash Return
3.4%
Cap rate
0.6%
Rent to Value Ratio
Active
$135,000
1
bds
|
1
ba
|
750
sqft
|
built
1968
7234 W North Ave, Elmwood Park, IL 60707
$-303
Cash flow
-11.7%
Cash-on-Cash Return
3.0%
Cap rate
1.0%
Rent to Value Ratio
Active
$359,900
3
bds
|
1
ba
|
1,379
sqft
|
built
1954
124 Sawyer Ave, La Grange, IL 60525
$-147
Cash flow
-2.1%
Cash-on-Cash Return
5.2%
Cap rate
0.7%
Rent to Value Ratio
Active
$1,698,900
4
bds
|
5
ba
|
7,000
sqft
|
built
2017
14151 131st St, Lemont, IL 60439
$-5,371
Cash flow
-16.5%
Cash-on-Cash Return
1.9%
Cap rate
0.3%
Rent to Value Ratio
Active
$205,000
3
bds
|
2
ba
|
1,606
sqft
|
built
1955
136 Iroquois St, Park Forest, IL 60466
$-19
Cash flow
-0.5%
Cash-on-Cash Return
5.6%
Cap rate
1.2%
Rent to Value Ratio
Active
$385,000
6
bds
|
2
ba
|
0
sqft
|
built
1890
6660 S Michigan Ave, Chicago, IL 60637
$-773
Cash flow
-10.5%
Cash-on-Cash Return
3.3%
Cap rate
0.5%
Rent to Value Ratio

Active
$715,000
3
bds
|
3
ba
|
3,400
sqft
|
built
1926
5251 N La Crosse Ave, Chicago, IL 60630
$-1,164
Cash flow
-8.5%
Cash-on-Cash Return
3.7%
Cap rate
0.6%
Rent to Value Ratio
Active
$535,000
2
bds
|
2
ba
|
1,300
sqft
|
built
2009
303 W Ohio St, Chicago, IL 60654
$-2,126
Cash flow
-20.7%
Cash-on-Cash Return
0.9%
Cap rate
0.5%
Rent to Value Ratio
Active
$189,900
3
bds
|
2
ba
|
1,303
sqft
|
built
1987
289 Saginaw Ave, Calumet City, IL 60409
$-182
Cash flow
-5.0%
Cash-on-Cash Return
4.5%
Cap rate
1.1%
Rent to Value Ratio
Active
$252,000
3
bds
|
3
ba
|
1,373
sqft
|
built
1978
20073 Park Ave, Lynwood, IL 60411
$-115
Cash flow
-2.4%
Cash-on-Cash Return
5.1%
Cap rate
0.9%
Rent to Value Ratio
Active
$310,000
3
bds
|
2
ba
|
1,418
sqft
|
built
1959
18823 Ashland Ave, Homewood, IL 60430
$-502
Cash flow
-8.4%
Cash-on-Cash Return
3.7%
Cap rate
0.8%
Rent to Value Ratio
Active
$214,999
2
bds
|
2
ba
|
1,000
sqft
|
built
1969
940 E Old Willow Rd, Prospect Heights, IL 60070
$-453
Cash flow
-11.0%
Cash-on-Cash Return
3.1%
Cap rate
0.8%
Rent to Value Ratio
Active
$169,900
2
bds
|
2
ba
|
963
sqft
|
built
1955
14405 Woodlawn Ave, Dolton, IL 60419
$328
Cash flow
10.1%
Cash-on-Cash Return
8.0%
Cap rate
1.4%
Rent to Value Ratio
Active
$264,777
3
bds
|
2
ba
|
1,747
sqft
|
built
1960
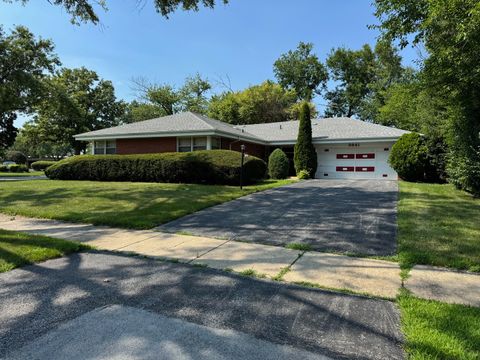
3641 Beech St, Flossmoor, IL 60422
$250
Cash flow
4.9%
Cash-on-Cash Return
6.8%
Cap rate
1.1%
Rent to Value Ratio
Active
$419,000
3
bds
|
2
ba
|
2,168
sqft
|
built
1961
8758 Nashville Ave, Oak Lawn, IL 60453
$-527
Cash flow
-6.6%
Cash-on-Cash Return
4.2%
Cap rate
0.7%
Rent to Value Ratio
Active
$645,000
3
bds
|
2
ba
|
1,550
sqft
|
built
2015
956 N Noble St, Chicago, IL 60642
$-1,390
Cash flow
-11.2%
Cash-on-Cash Return
3.1%
Cap rate
0.6%
Rent to Value Ratio