Cook County Investment Properties for Sale
Browse homes for sale and investment properties in Cook County. Refine your search by price, property type, or more.
Best cash flowing properties in Cook County
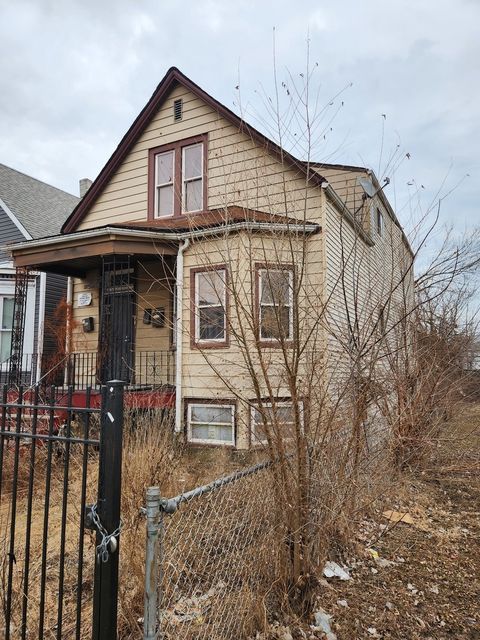
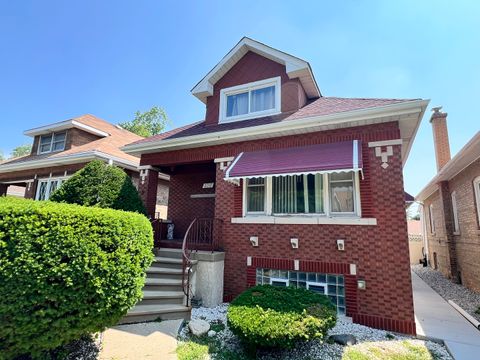
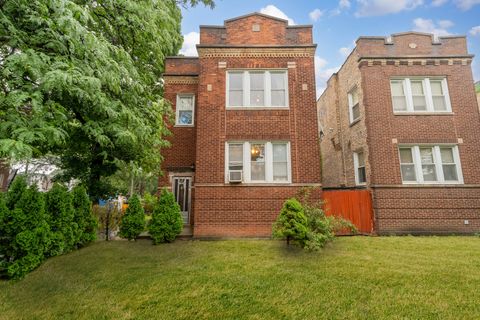
Active
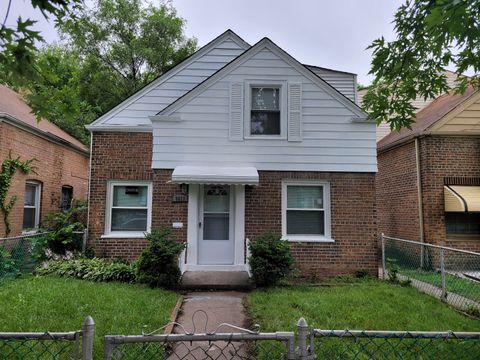
$42,500
3
bds
|
2
ba
|
1,150
sqft
|
built
1922
6836 S Crandon Ave, Chicago, IL 60649
$1,005
Cash flow
27.5%
Cash-on-Cash Return
28.4%
Cap rate
3.5%
Rent to Value Ratio
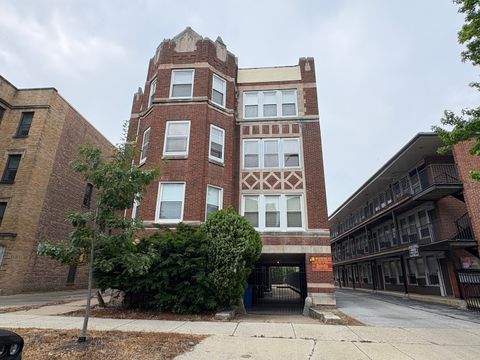
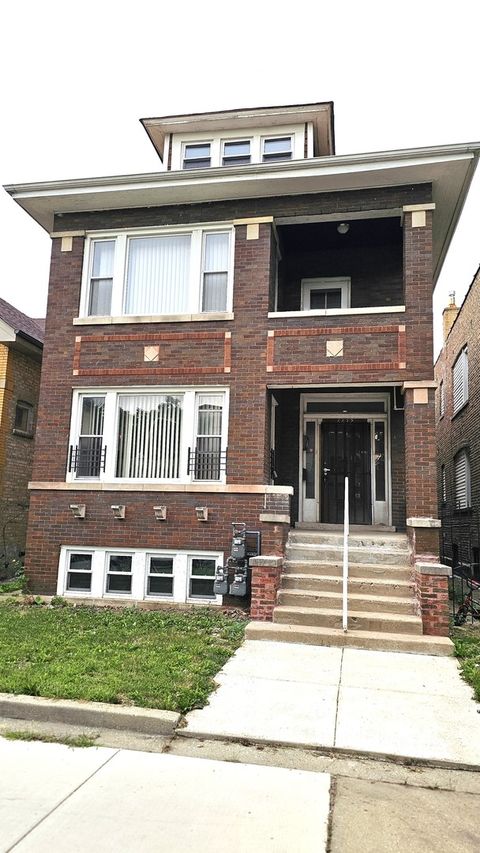
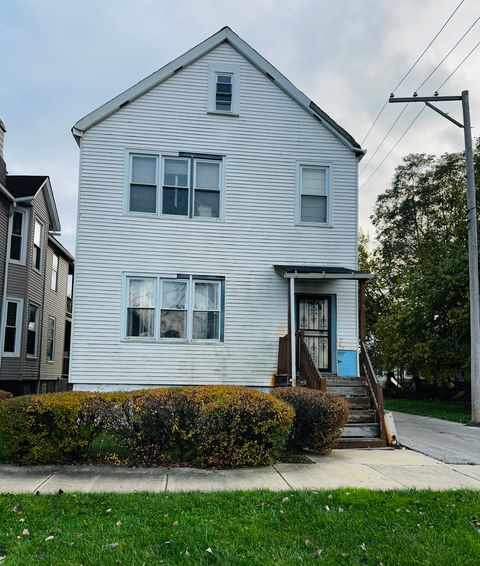
Active
$80,000
8
bds
|
3
ba
|
0
sqft
|
built
1900
6835 S May St, Chicago, IL 60621
$966
Cash flow
63.0%
Cash-on-Cash Return
20.2%
Cap rate
2.5%
Rent to Value Ratio
4,965 out of 5,758 properties for sale in Cook County
Limited Results Shown
Create a free account, or log in to reveal all property listings and enjoy the complete experience.
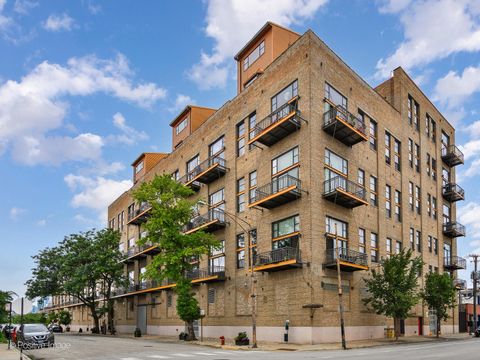
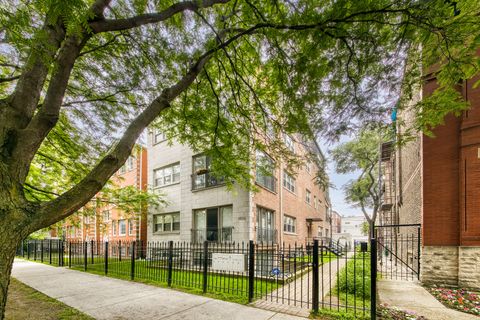
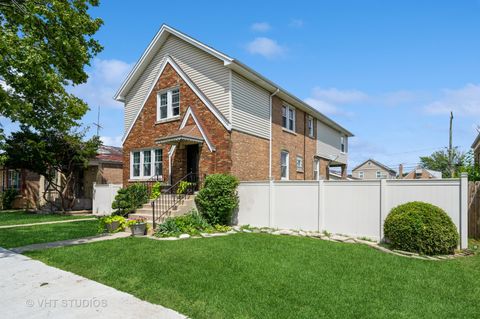
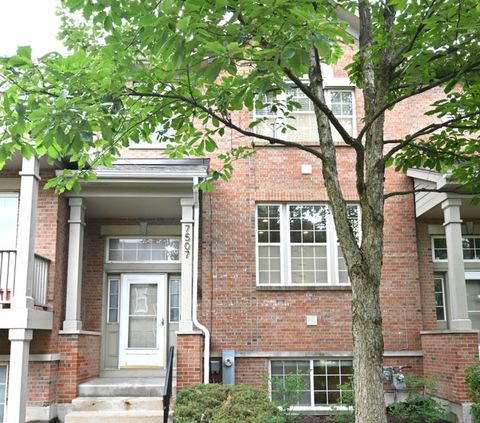
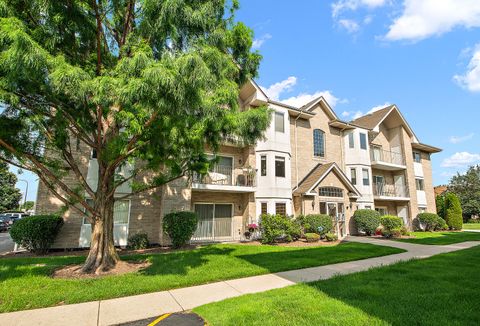
Active
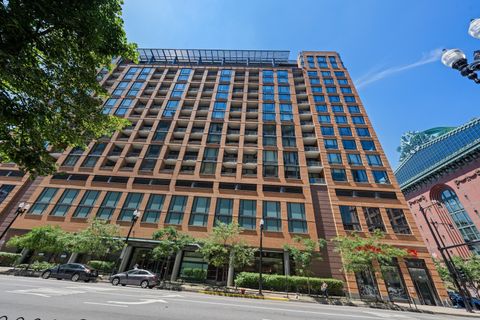
$389,900
2
bds
|
2
ba
|
1,342
sqft
|
built
1909
2545 S Dearborn St, Chicago, IL 60616
$-976
Cash flow
-13.1%
Cash-on-Cash Return
2.7%
Cap rate
0.7%
Rent to Value Ratio
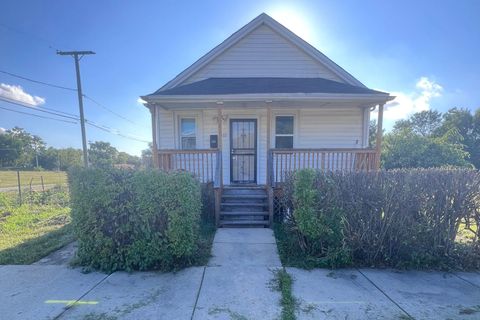
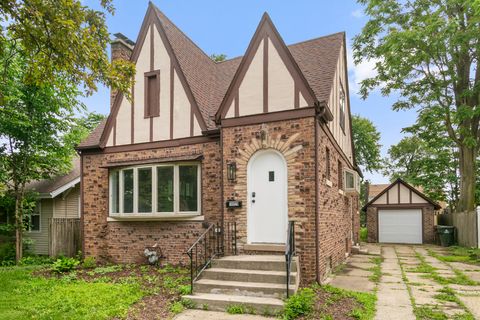
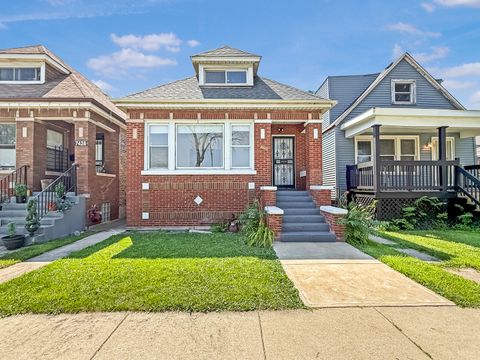
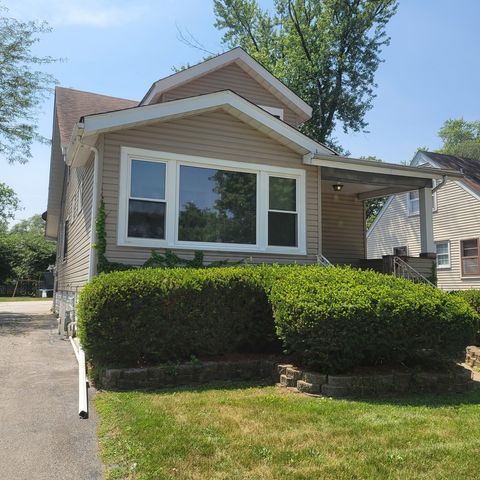
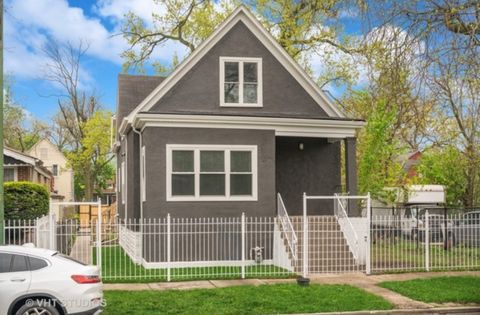
Active
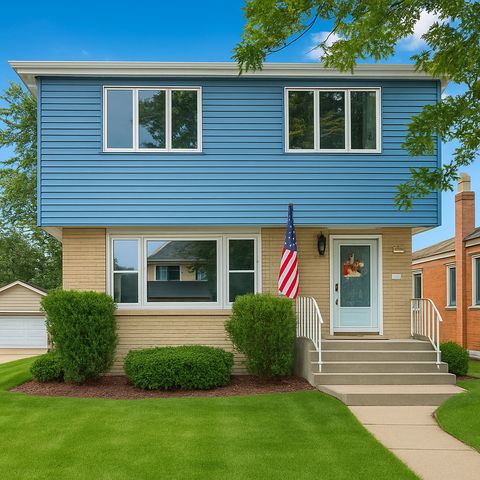
$102,000
3
bds
|
1
ba
|
924
sqft
|
built
1913
1532 Shields Ave, Chicago Heights, IL 60411
$400
Cash flow
20.5%
Cash-on-Cash Return
10.4%
Cap rate
1.6%
Rent to Value Ratio
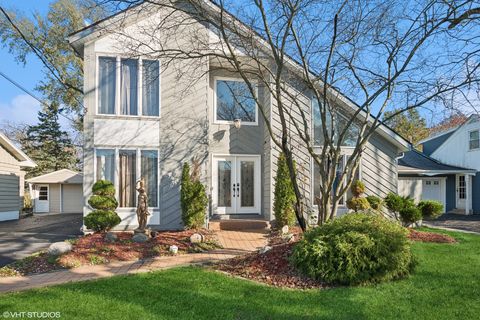
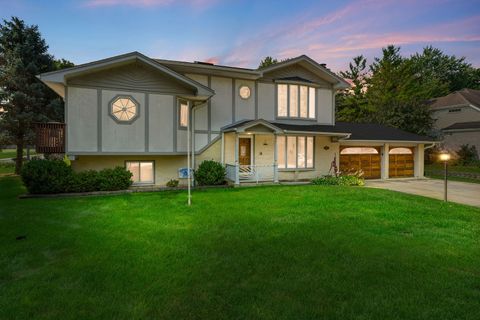
Active
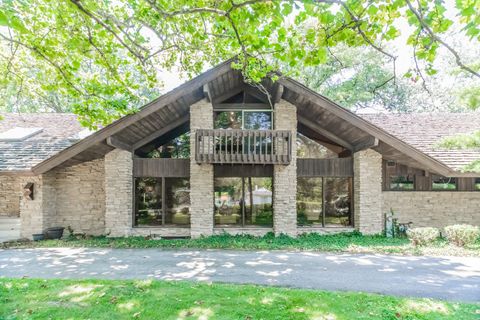
$635,000
3
bds
|
3
ba
|
0
sqft
|
built
2001
1540 N Claremont Ave, Chicago, IL 60622
$-1,639
Cash flow
-13.5%
Cash-on-Cash Return
2.6%
Cap rate
0.5%
Rent to Value Ratio
Active
$385,000
6
bds
|
3
ba
|
0
sqft
|
built
1920
6632 S Maplewood Ave, Chicago, IL 60629
$-777
Cash flow
-10.5%
Cash-on-Cash Return
3.3%
Cap rate
0.5%
Rent to Value Ratio
Active
$239,700
3
bds
|
2
ba
|
1,699
sqft
|
built
1928
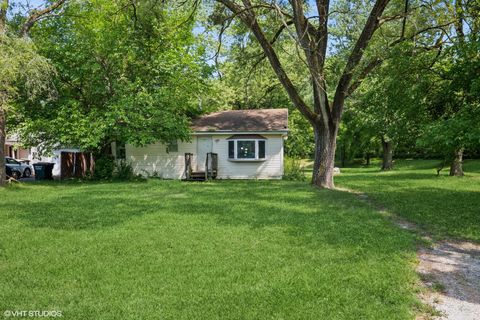
16929 Wood St, Hazel Crest, IL 60429
$203
Cash flow
4.4%
Cash-on-Cash Return
6.7%
Cap rate
1.0%
Rent to Value Ratio
Active
$295,000
3
bds
|
3
ba
|
1,919
sqft
|
built
1983
315 Leverette St, Thornton, IL 60476
$69
Cash flow
1.2%
Cash-on-Cash Return
6.0%
Cap rate
1.1%
Rent to Value Ratio
Active
$180,000
3
bds
|
1
ba
|
1,166
sqft
|
built
1953
3636 172nd St, Lansing, IL 60438
$-265
Cash flow
-7.7%
Cash-on-Cash Return
3.9%
Cap rate
0.9%
Rent to Value Ratio

Active
$215,000
3
bds
|
2
ba
|
2,300
sqft
|
built
1925
6727 S Merrill Ave, Chicago, IL 60649
$-422
Cash flow
-10.2%
Cash-on-Cash Return
3.3%
Cap rate
1.0%
Rent to Value Ratio
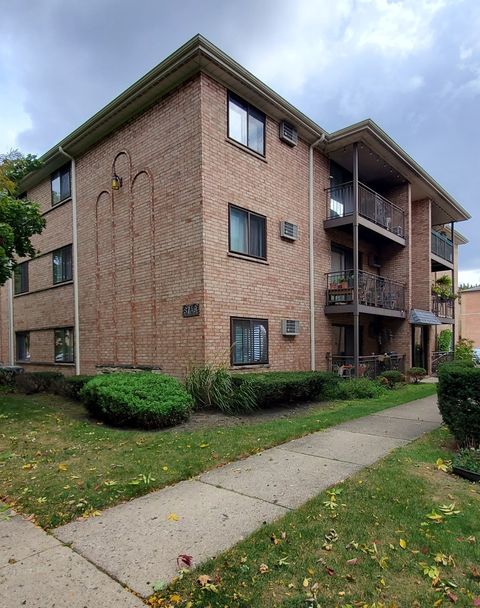
Active
$195,000
2
bds
|
1
ba
|
1,000
sqft
|
built
1979
8749 W Summerdale Ave, Chicago, IL 60656
$-151
Cash flow
-4.0%
Cash-on-Cash Return
4.8%
Cap rate
0.9%
Rent to Value Ratio
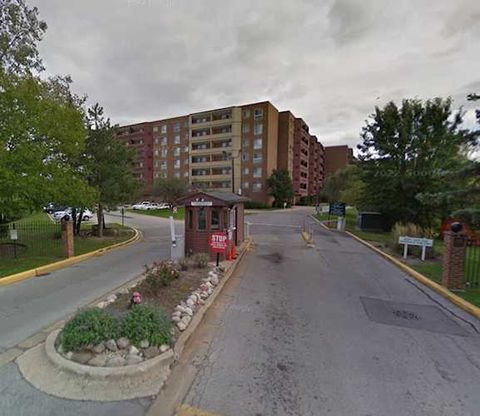
Active
$100,000
2
bds
|
2
ba
|
1,100
sqft
|
built
1971
100 Park Ave, Calumet City, IL 60409
$479
Cash flow
25.0%
Cash-on-Cash Return
11.4%
Cap rate
1.8%
Rent to Value Ratio
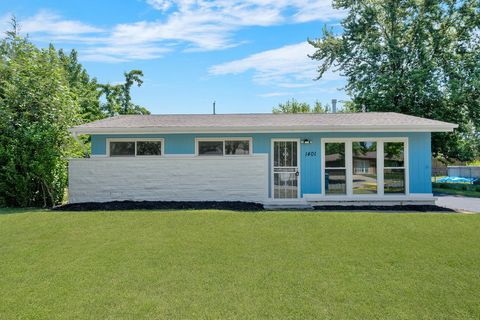
Active
$219,900
4
bds
|
2
ba
|
1,389
sqft
|
built
1960
1401 Stanley Blvd, Calumet City, IL 60409
$-137
Cash flow
-3.3%
Cash-on-Cash Return
4.9%
Cap rate
0.9%
Rent to Value Ratio
Active
$310,000
3
bds
|
2
ba
|
1,624
sqft
|
built
1928
2715 Oak Park Ave, Berwyn, IL 60402
$-339
Cash flow
-5.7%
Cash-on-Cash Return
4.4%
Cap rate
0.9%
Rent to Value Ratio
Active
$524,900
4
bds
|
3
ba
|
2,510
sqft
|
built
1942
5643 S Meade Ave, Chicago, IL 60638
$-1,266
Cash flow
-12.6%
Cash-on-Cash Return
2.8%
Cap rate
0.5%
Rent to Value Ratio
Active
$89,999
6
bds
|
2
ba
|
0
sqft
|
built
1865
347 W 59th Pl, Chicago, IL 60621
$602
Cash flow
34.9%
Cash-on-Cash Return
13.7%
Cap rate
1.8%
Rent to Value Ratio
Active
$315,000
3
bds
|
2
ba
|
1,400
sqft
|
built
1929
7426 S Oakley Ave, Chicago, IL 60636
$-270
Cash flow
-4.5%
Cash-on-Cash Return
4.7%
Cap rate
0.6%
Rent to Value Ratio
Active
$499,000
3
bds
|
3
ba
|
2,204
sqft
|
built
2005
7507 Frontage Rd, Skokie, IL 60077
$-850
Cash flow
-8.9%
Cash-on-Cash Return
3.6%
Cap rate
0.7%
Rent to Value Ratio
Active
$298,000
5
bds
|
2
ba
|
1,476
sqft
|
built
1925
1635 Linden Rd, Homewood, IL 60430
$-317
Cash flow
-5.6%
Cash-on-Cash Return
4.4%
Cap rate
0.8%
Rent to Value Ratio
Active
$547,000
5
bds
|
3
ba
|
2,550
sqft
|
built
1985
4901 Emerson Ave, Rolling Meadows, IL 60067
$-775
Cash flow
-7.4%
Cash-on-Cash Return
4.0%
Cap rate
0.7%
Rent to Value Ratio
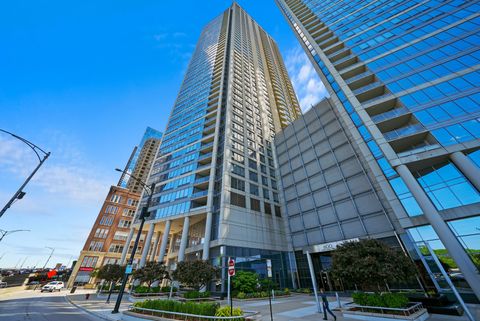
Active
$1,474,000
3
bds
|
4
ba
|
2,540
sqft
|
built
2008
600 N Lake Shore Dr, Chicago, IL 60611
$-5,401
Cash flow
-19.1%
Cash-on-Cash Return
1.3%
Cap rate
0.5%
Rent to Value Ratio
Active
$675,000
3
bds
|
4
ba
|
2,700
sqft
|
built
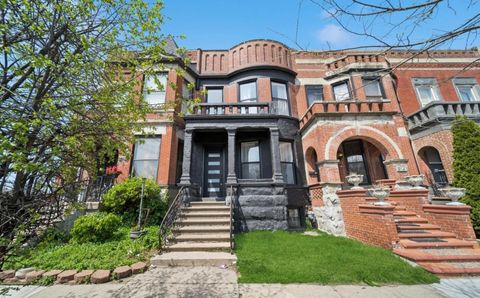
1894
814 E 48th St, Chicago, IL 60615
$-1,963
Cash flow
-15.2%
Cash-on-Cash Return
2.2%
Cap rate
0.4%
Rent to Value Ratio
Active
$249,000
1
bds
|
1
ba
|
750
sqft
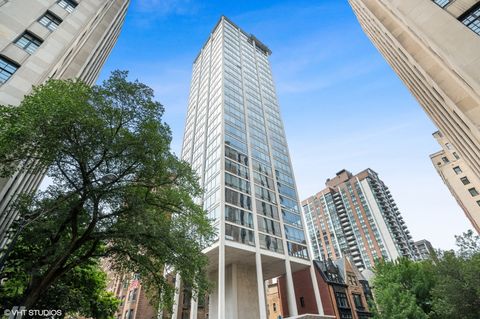
|
built
1962
1300 N Astor St, Chicago, IL 60610
$-1,144
Cash flow
-24.0%
Cash-on-Cash Return
0.2%
Cap rate
0.9%
Rent to Value Ratio
Active
$183,900
2
bds
|
1
ba
|
1,080
sqft
|
built
1983
814 N River Rd, Mount Prospect, IL 60056
$-31
Cash flow
-0.9%
Cash-on-Cash Return
5.5%
Cap rate
1.1%
Rent to Value Ratio
Active
$194,900
3
bds
|
3
ba
|
1,265
sqft
|
built
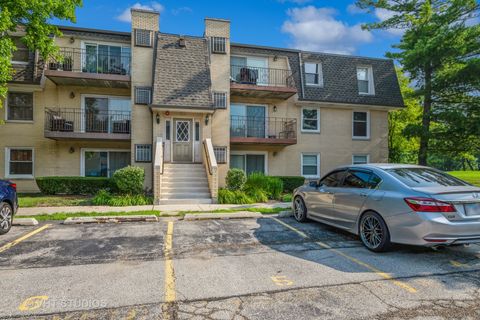
1958
135 Westwood Dr, Park Forest, IL 60466
$97
Cash flow
2.6%
Cash-on-Cash Return
6.3%
Cap rate
1.3%
Rent to Value Ratio
Active
$515,000
4
bds
|
3
ba
|
3,200
sqft
|
built
1999
6201 Old Plank Blvd, Matteson, IL 60443
$-1,101
Cash flow
-11.2%
Cash-on-Cash Return
3.1%
Cap rate
0.7%
Rent to Value Ratio
Active
$157,500
2
bds
|
2
ba
|
1,224
sqft
|
built
1972
3704 215th St, Matteson, IL 60443
$-40
Cash flow
-1.3%
Cash-on-Cash Return
5.4%
Cap rate
1.1%
Rent to Value Ratio
Active
$399,900
2
bds
|
2
ba
|
860
sqft
|
built
1915
1019 W Winona St, Chicago, IL 60640
$-872
Cash flow
-11.4%
Cash-on-Cash Return
3.1%
Cap rate
0.6%
Rent to Value Ratio
Active
$675,000
3
bds
|
2
ba
|
1,231
sqft
|
built
1918
4326 W School St, Chicago, IL 60641
$-2,013
Cash flow
-15.6%
Cash-on-Cash Return
2.1%
Cap rate
0.5%
Rent to Value Ratio
Active
$225,000
3
bds
|
2
ba
|
1,200
sqft
|
built
1944
8617 S Bennett Ave, Chicago, IL 60617
$104
Cash flow
2.4%
Cash-on-Cash Return
6.2%
Cap rate
0.9%
Rent to Value Ratio
Active
$519,000
2
bds
|
2
ba
|
1,630
sqft
|
built
2009
520 S State St, Chicago, IL 60605
$-1,482
Cash flow
-14.9%
Cash-on-Cash Return
2.3%
Cap rate
0.8%
Rent to Value Ratio
Active
$468,880
4
bds
|
2
ba
|
1,800
sqft
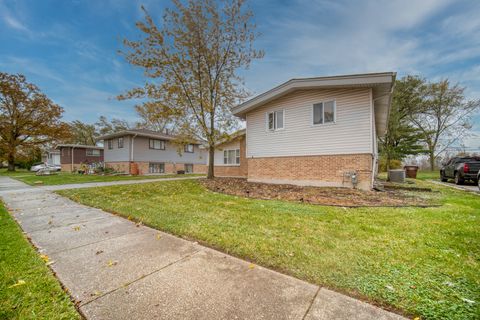
|
built
1955
3857 W 107th Pl, Chicago, IL 60655
$-292
Cash flow
-3.2%
Cash-on-Cash Return
4.9%
Cap rate
0.7%
Rent to Value Ratio
Active
$1,399,900
6
bds
|
5
ba
|
4,000
sqft
|
built
1978
8080 Wolf Rd, Burr Ridge, IL 60527
$-4,666
Cash flow
-17.4%
Cash-on-Cash Return
1.7%
Cap rate
0.4%
Rent to Value Ratio
Active
$274,900
2
bds
|
1
ba
|
950
sqft
|
built
1900
25 S La Grange Rd, La Grange, IL 60525
$-907
Cash flow
-17.2%
Cash-on-Cash Return
1.7%
Cap rate
0.6%
Rent to Value Ratio
Active
$329,900
1
bds
|
1
ba
|
790
sqft
|
built
2008
123 S Green St, Chicago, IL 60607
$-882
Cash flow
-13.9%
Cash-on-Cash Return
2.5%
Cap rate
0.9%
Rent to Value Ratio
Active
$290,000
1
bds
|
1
ba
|
0
sqft
|
built
2008
50 E 16th St, Chicago, IL 60616
$-708
Cash flow
-12.7%
Cash-on-Cash Return
2.7%
Cap rate
1.0%
Rent to Value Ratio
Active
$270,000
3
bds
|
1
ba
|
1,080
sqft
|
built
1945
3631 W 86th Pl, Chicago, IL 60652
$-123
Cash flow
-2.4%
Cash-on-Cash Return
5.1%
Cap rate
0.7%
Rent to Value Ratio
Active
$395,000
6
bds
|
4
ba
|
0
sqft
|
built
1922
1657 N Austin Ave, Chicago, IL 60639
$-1,014
Cash flow
-13.4%
Cash-on-Cash Return
2.6%
Cap rate
0.5%
Rent to Value Ratio
Active
$229,000
2
bds
|
2
ba
|
1,480
sqft
|
built
2001
5311 W Mint Julip Dr, Alsip, IL 60803
$-129
Cash flow
-2.9%
Cash-on-Cash Return
5.0%
Cap rate
0.9%
Rent to Value Ratio
Active
$349,999
5
bds
|
3
ba
|
1,759
sqft
|
built
1913
2017 W 68th St, Chicago, IL 60636
$-474
Cash flow
-7.1%
Cash-on-Cash Return
4.1%
Cap rate
0.5%
Rent to Value Ratio