Cook County Investment Properties for Sale
Browse homes for sale and investment properties in Cook County. Refine your search by price, property type, or more.
Best cash flowing properties in Cook County
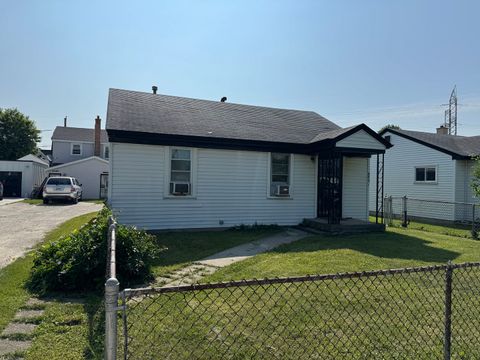
Active
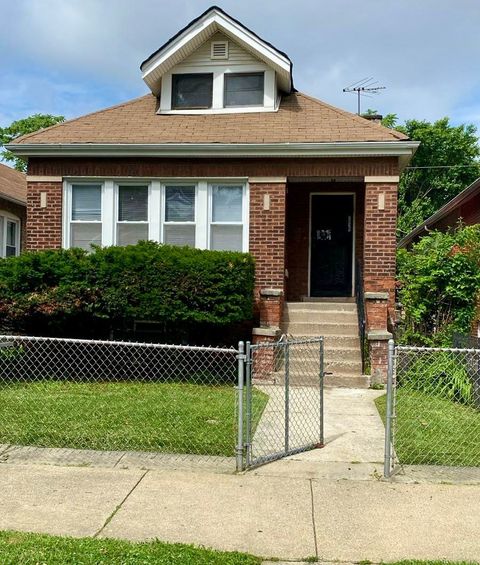
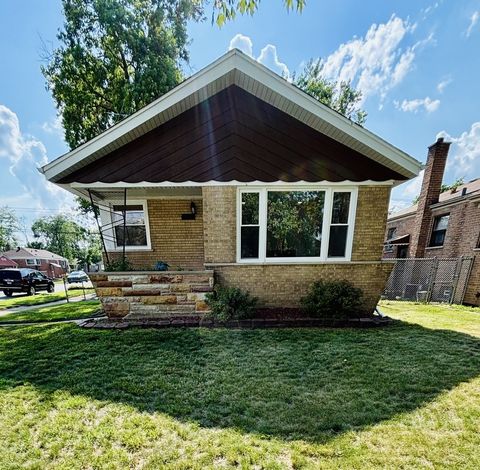
$159,000
3
bds
|
1
ba
|
1,309
sqft
|
built
1922
7534 S Morgan St, Chicago, IL 60620
$561
Cash flow
18.4%
Cash-on-Cash Return
9.9%
Cap rate
1.4%
Rent to Value Ratio
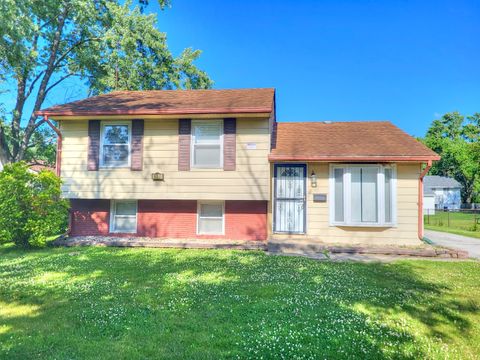
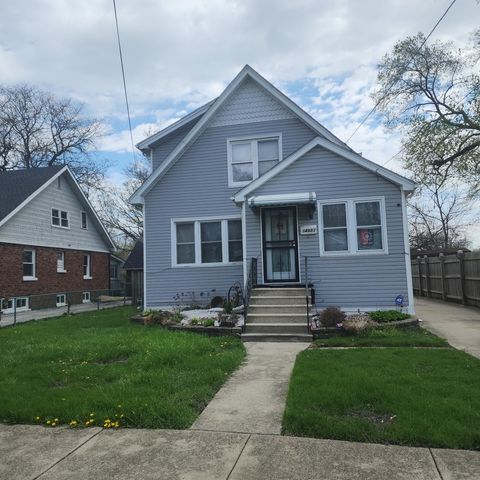
Active
$202,000
4
bds
|
2
ba
|
1,500
sqft
|
built
1970
127 N Cedar Ln, Glenwood, IL 60425
$500
Cash flow
12.9%
Cash-on-Cash Return
8.6%
Cap rate
1.4%
Rent to Value Ratio
4,034 out of 4,728 properties for sale in Cook County
Limited Results Shown
Create a free account, or log in to reveal all property listings and enjoy the complete experience.
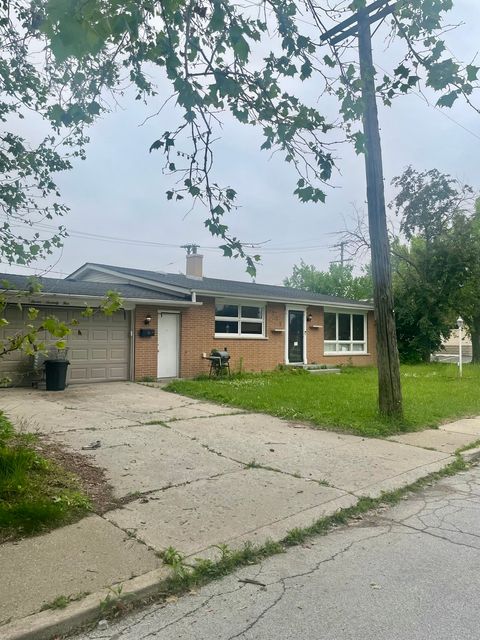
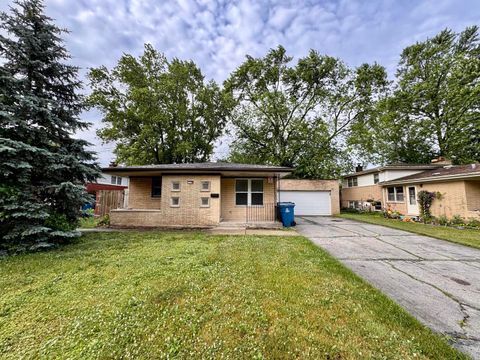
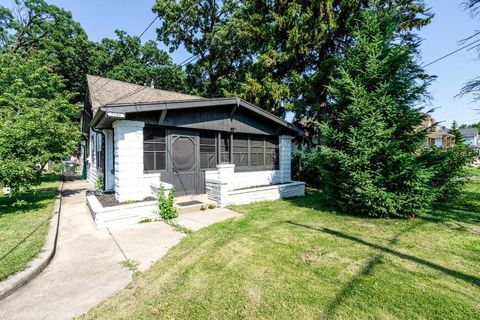
Active
$145,000
3
bds
|
2
ba
|
1,655
sqft
|
built
1981
775 Greenbay Ave, Calumet City, IL 60409
$147
Cash flow
5.3%
Cash-on-Cash Return
6.9%
Cap rate
1.5%
Rent to Value Ratio
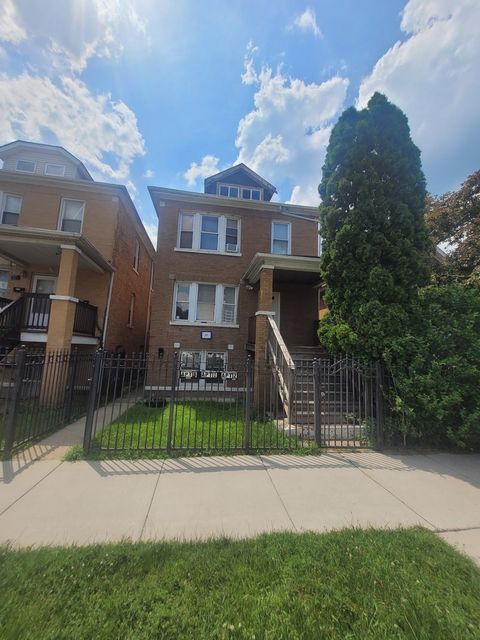
Active
$325,000
6
bds
|
3
ba
|
0
sqft
|
built
1928
8344 S Mackinaw Ave, Chicago, IL 60617
$-437
Cash flow
-7.0%
Cash-on-Cash Return
4.1%
Cap rate
0.6%
Rent to Value Ratio
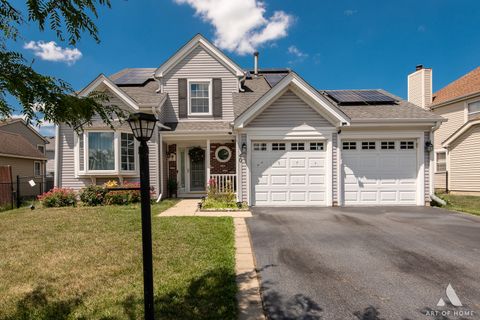
Active
$459,000
4
bds
|
3
ba
|
2,000
sqft
|
built
1984
40 Jackson Ln, Streamwood, IL 60107
$-777
Cash flow
-8.8%
Cash-on-Cash Return
3.6%
Cap rate
0.7%
Rent to Value Ratio
Active
$287,914
3
bds
|
2
ba
|
1,584
sqft
|
built
1908
3651 W 64th Pl, Chicago, IL 60629
$12
Cash flow
0.2%
Cash-on-Cash Return
5.7%
Cap rate
0.8%
Rent to Value Ratio

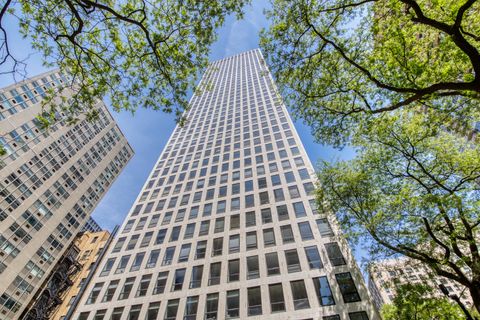
Active
$339,000
1
bds
|
1
ba
|
934
sqft
|
built
2006
1235 S Prairie Ave, Chicago, IL 60605
$-547
Cash flow
-8.4%
Cash-on-Cash Return
3.7%
Cap rate
0.9%
Rent to Value Ratio
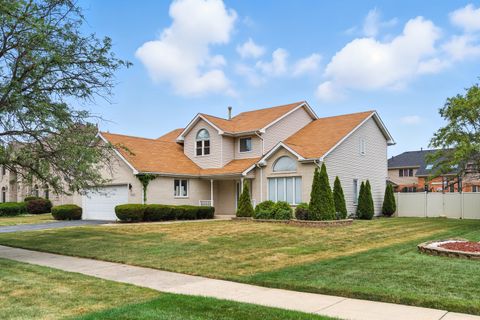
Active
$460,000
4
bds
|
4
ba
|
3,400
sqft
|
built
1993
4550 Columbine Ln, Matteson, IL 60443
$-1,026
Cash flow
-11.6%
Cash-on-Cash Return
3.0%
Cap rate
0.7%
Rent to Value Ratio
Active
$195,000
3
bds
|
2
ba
|
1,171
sqft
|
built
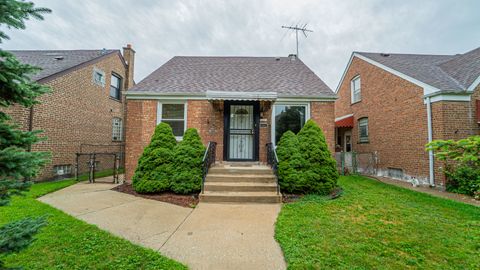
1959
110 Judith Ln, Chicago Heights, IL 60411
$-27
Cash flow
-0.7%
Cash-on-Cash Return
5.5%
Cap rate
1.1%
Rent to Value Ratio

Active
$156,900
3
bds
|
2
ba
|
1,125
sqft
|
built
1951
1532 State Line Rd, Calumet City, IL 60409
$-281
Cash flow
-9.3%
Cash-on-Cash Return
3.5%
Cap rate
1.1%
Rent to Value Ratio
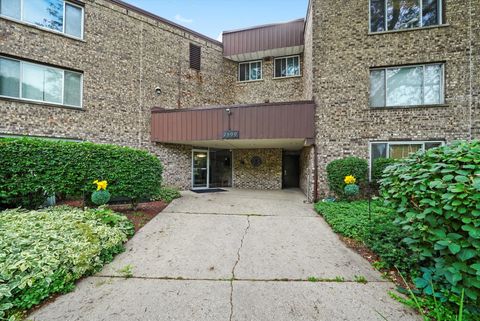
Active
$245,000
2
bds
|
2
ba
|
1,100
sqft
|
built
1974
1450 Sandpebble Dr, Wheeling, IL 60090
$-78
Cash flow
-1.7%
Cash-on-Cash Return
5.3%
Cap rate
0.8%
Rent to Value Ratio
Active
$1,150,000
3
bds
|
4
ba
|
3,750
sqft
|
built
2005
909 Red Oak Dr, Western Springs, IL 60558
$-3,292
Cash flow
-14.9%
Cash-on-Cash Return
2.2%
Cap rate
0.4%
Rent to Value Ratio
Active
$159,000
5
bds
|
2
ba
|
0
sqft
|
built
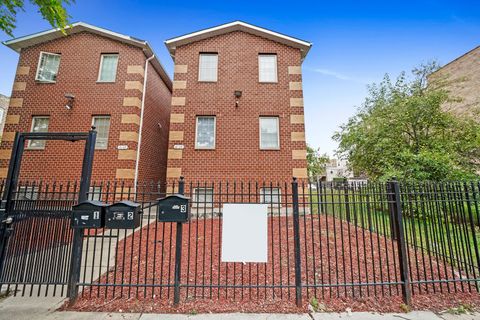
1895
4036 W Lexington St, Chicago, IL 60624
$287
Cash flow
9.4%
Cash-on-Cash Return
7.8%
Cap rate
1.0%
Rent to Value Ratio
Active
$1,575,000
5
bds
|
8
ba
|
6,600
sqft
|
built
1989
85 Ela Rd, Inverness, IL 60067
$-5,857
Cash flow
-19.4%
Cash-on-Cash Return
1.2%
Cap rate
0.3%
Rent to Value Ratio
Active
$216,000
3
bds
|
2
ba
|
1,037
sqft
|
built
1957
14248 Avalon Ave, Dolton, IL 60419
$-6
Cash flow
-0.1%
Cash-on-Cash Return
5.6%
Cap rate
1.0%
Rent to Value Ratio
Active
$215,000
2
bds
|
2
ba
|
0
sqft
|
built
1973
2600 Brookwood Way Dr, Rolling Meadows, IL 60008
$-332
Cash flow
-8.1%
Cash-on-Cash Return
3.8%
Cap rate
0.8%
Rent to Value Ratio
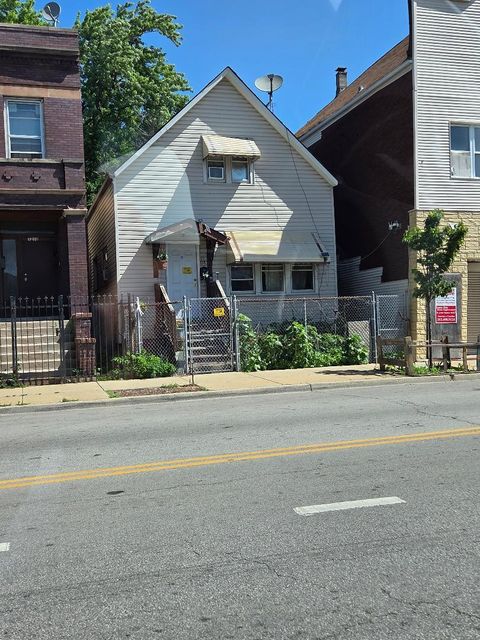
Active
$169,900
3
bds
|
2
ba
|
966
sqft
|
built
1884
1208 W 51st St, Chicago, IL 60609
$385
Cash flow
11.8%
Cash-on-Cash Return
8.4%
Cap rate
1.1%
Rent to Value Ratio
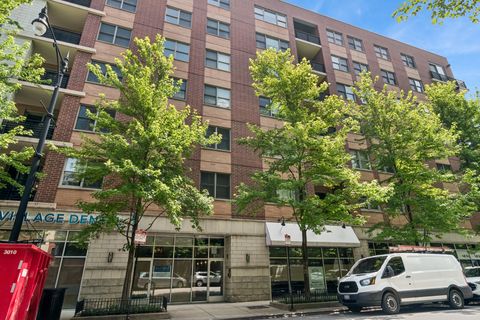
Active
$390,000
2
bds
|
2
ba
|
1,100
sqft
|
built
2006
873 N Larrabee St, Chicago, IL 60610
$-747
Cash flow
-10.0%
Cash-on-Cash Return
3.4%
Cap rate
0.8%
Rent to Value Ratio
Active
$185,000
3
bds
|
2
ba
|
912
sqft
|
built
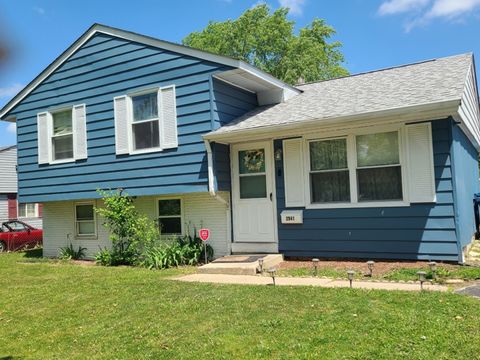
1971
2941 225th St, Sauk Village, IL 60411
$47
Cash flow
1.3%
Cash-on-Cash Return
6.0%
Cap rate
1.0%
Rent to Value Ratio
Active
$329,999
3
bds
|
3
ba
|
3,300
sqft
|
built
1974
324 E 173rd Pl, South Holland, IL 60473
$-83
Cash flow
-1.3%
Cash-on-Cash Return
5.4%
Cap rate
1.0%
Rent to Value Ratio
Active
$295,000
4
bds
|
3
ba
|
0
sqft
|
built
1925
10837 S Normal Ave, Chicago, IL 60628
$68
Cash flow
1.2%
Cash-on-Cash Return
6.0%
Cap rate
0.8%
Rent to Value Ratio

Active
$240,000
3
bds
|
2
ba
|
1,224
sqft
|
built
1954
8559 S Drexel Ave, Chicago, IL 60619
$-132
Cash flow
-2.9%
Cash-on-Cash Return
5.0%
Cap rate
0.7%
Rent to Value Ratio
Active
$95,900
2
bds
|
1
ba
|
858
sqft
|
built
1975
2304 Holiday Ter, Lansing, IL 60438
$450
Cash flow
24.5%
Cash-on-Cash Return
11.3%
Cap rate
1.8%
Rent to Value Ratio
Active
$320,000
4
bds
|
3
ba
|
0
sqft
|
built
1951
6607 Conrad Ave, Hodgkins, IL 60525
$-1,010
Cash flow
-16.5%
Cash-on-Cash Return
1.9%
Cap rate
0.5%
Rent to Value Ratio

Active
$399,900
2
bds
|
2
ba
|
1,117
sqft
|
built
1913
865 W Cornelia Ave, Chicago, IL 60657
$-705
Cash flow
-9.2%
Cash-on-Cash Return
3.6%
Cap rate
0.8%
Rent to Value Ratio
Active
$250,000
3
bds
|
2
ba
|
1,135
sqft
|
built
1927
14951 Riverside Dr, South Holland, IL 60473
$421
Cash flow
8.8%
Cash-on-Cash Return
7.7%
Cap rate
1.0%
Rent to Value Ratio
Active
$339,000
5
bds
|
1
ba
|
1,776
sqft
|
built
1921
7700 Garden Ln, Justice, IL 60458
$-450
Cash flow
-6.9%
Cash-on-Cash Return
4.1%
Cap rate
0.8%
Rent to Value Ratio
Active
$500,000
2
bds
|
2
ba
|
1,600
sqft
|
built
1964
260 E Chestnut St, Chicago, IL 60611
$-1,706
Cash flow
-17.8%
Cash-on-Cash Return
1.6%
Cap rate
0.8%
Rent to Value Ratio
Active
$625,000
12
bds
|
6
ba
|
0
sqft
|
built
2004
6139 S King Dr, Chicago, IL 60637
$-2,265
Cash flow
-18.9%
Cash-on-Cash Return
1.3%
Cap rate
0.3%
Rent to Value Ratio
Active
$219,900
3
bds
|
2
ba
|
1,400
sqft
|
built
1954
11318 S Avenue J, Chicago, IL 60617
$174
Cash flow
4.1%
Cash-on-Cash Return
6.6%
Cap rate
0.9%
Rent to Value Ratio
Active
$1,300,000
10
bds
|
5
ba
|
0
sqft
|
built
1892
420 N Marion St, Oak Park, IL 60302
$-8,013
Cash flow
-32.2%
Cash-on-Cash Return
-1.7%
Cap rate
0.2%
Rent to Value Ratio
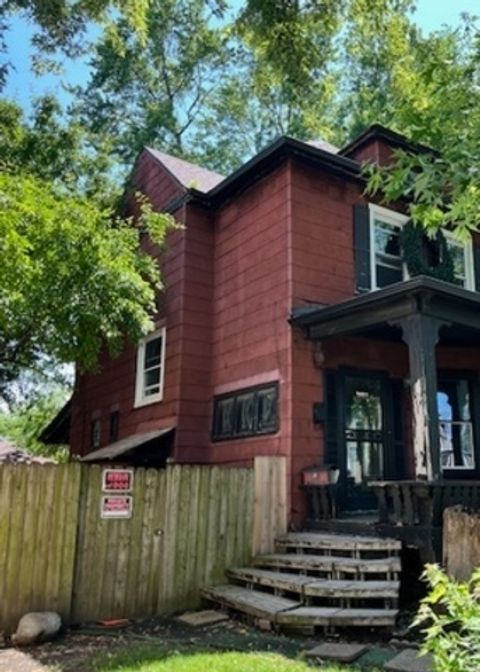
Active
$399,900
7
bds
|
6
ba
|
0
sqft
|
built
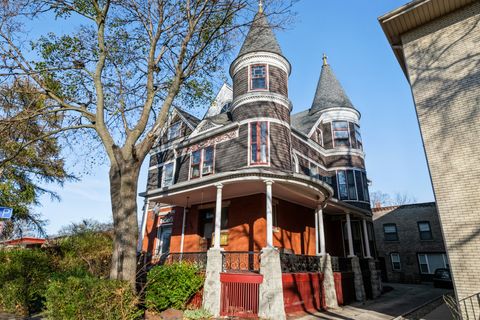
1888
2933 W Wilcox St, Chicago, IL 60612
$-757
Cash flow
-9.9%
Cash-on-Cash Return
3.4%
Cap rate
0.6%
Rent to Value Ratio

Active
$74,900
1
bds
|
1
ba
|
750
sqft
|
built
1976
500 Park Ave, Calumet City, IL 60409
$223
Cash flow
3.5%
Cash-on-Cash Return
3.6%
Cap rate
1.9%
Rent to Value Ratio
Active
$289,999
2
bds
|
2
ba
|
1,750
sqft
|
built
1976
9529 Bronx Ave, Skokie, IL 60077
$-923
Cash flow
-16.6%
Cash-on-Cash Return
1.9%
Cap rate
0.7%
Rent to Value Ratio
Active
$289,000
2
bds
|
2
ba
|
1,300
sqft
|
built
1917
4829 N Kimball Ave, Chicago, IL 60625
$-649
Cash flow
-11.7%
Cash-on-Cash Return
3.0%
Cap rate
0.8%
Rent to Value Ratio

Active
$239,900
3
bds
|
2
ba
|
1,619
sqft
|
built
1961
12949 S Exchange Ave, Chicago, IL 60633
$57
Cash flow
1.2%
Cash-on-Cash Return
6.0%
Cap rate
0.8%
Rent to Value Ratio

Active
$250,000
5
bds
|
2
ba
|
0
sqft
|
built
1885
307 E 136th Pl, Chicago, IL 60827
$6
Cash flow
0.1%
Cash-on-Cash Return
5.7%
Cap rate
0.7%
Rent to Value Ratio
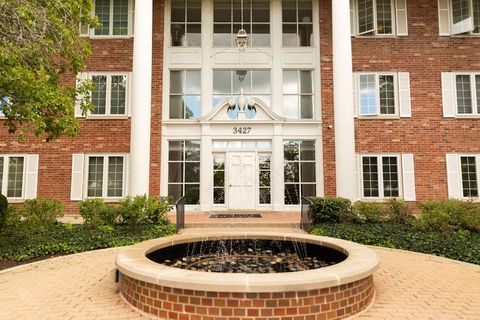
Active
$269,900
3
bds
|
2
ba
|
1,400
sqft
|
built
1974
3427 Vollmer Rd, Flossmoor, IL 60422
$-699
Cash flow
-13.5%
Cash-on-Cash Return
2.6%
Cap rate
0.9%
Rent to Value Ratio

Active
$334,900
3
bds
|
2
ba
|
1,625
sqft
|
built
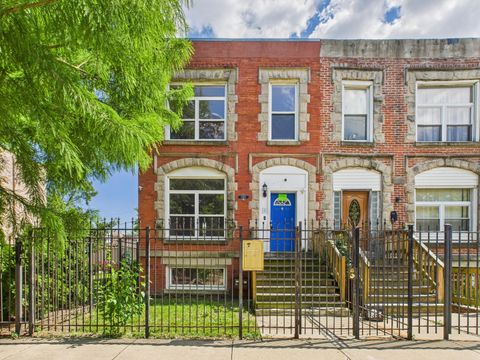
1903
4817 W 28th St, Cicero, IL 60804
$-469
Cash flow
-7.3%
Cash-on-Cash Return
4.0%
Cap rate
0.6%
Rent to Value Ratio

Active
$205,000
2
bds
|
1
ba
|
900
sqft
|
built
1964
345 E Eastgate Pl, Chicago, IL 60616
$-312
Cash flow
-7.9%
Cash-on-Cash Return
3.9%
Cap rate
1.0%
Rent to Value Ratio