Cook County Investment Properties for Sale
Browse homes for sale and investment properties in Cook County. Refine your search by price, property type, or more.
Best cash flowing properties in Cook County
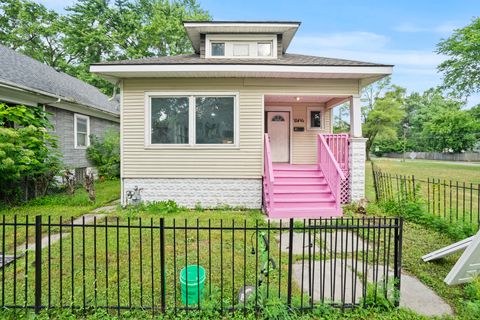
Active
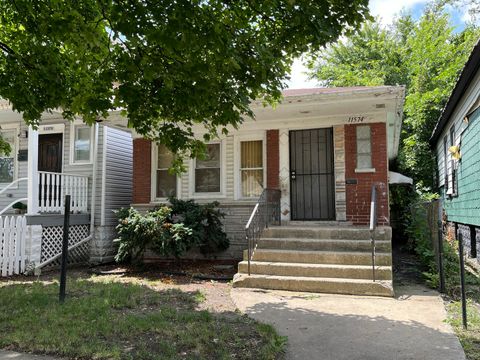
$54,000
2
bds
|
1
ba
|
1,060
sqft
|
built
1965
11574 S Lafayette Ave, Chicago, IL 60628
$1,180
Cash flow
25.5%
Cash-on-Cash Return
26.2%
Cap rate
3.3%
Rent to Value Ratio
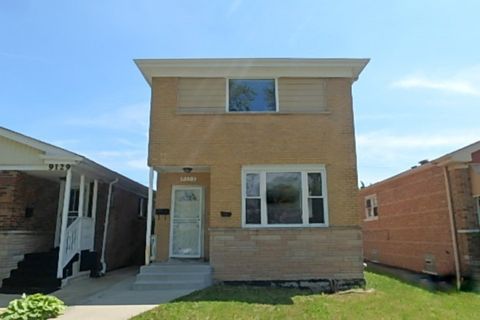
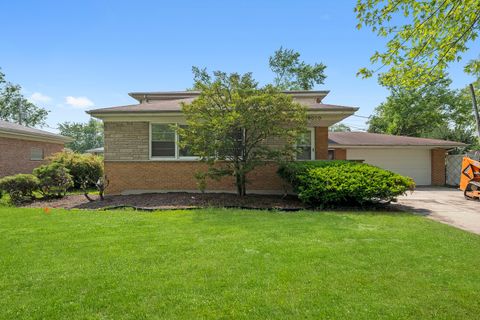
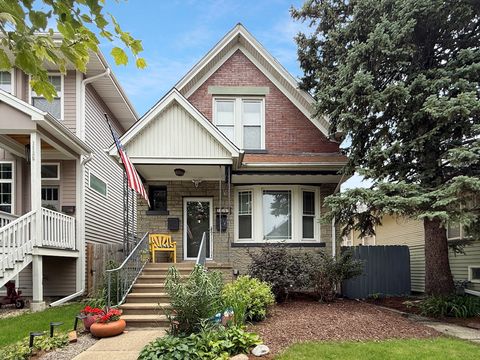
Active
$159,900
3
bds
|
2
ba
|
1,366
sqft
|
built
1961
9131 S Parnell Ave, Chicago, IL 60620
$642
Cash flow
20.9%
Cash-on-Cash Return
10.5%
Cap rate
1.4%
Rent to Value Ratio
4,811 out of 5,592 properties for sale in Cook County
Limited Results Shown
Create a free account, or log in to reveal all property listings and enjoy the complete experience.
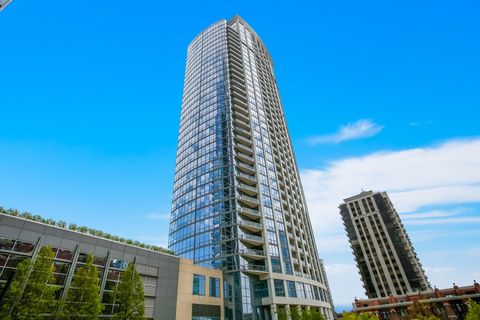
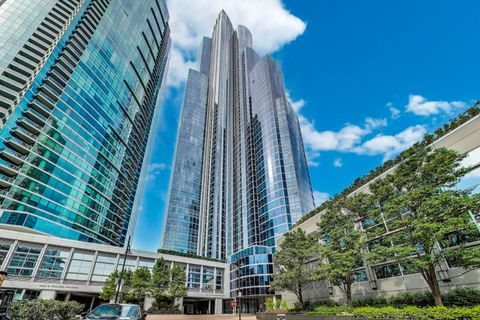
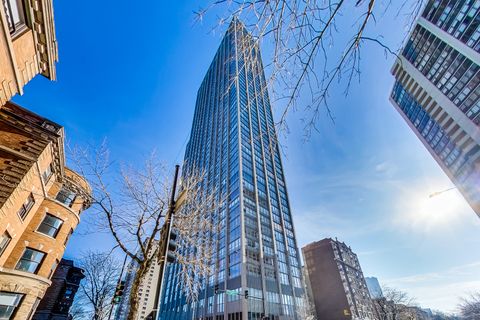
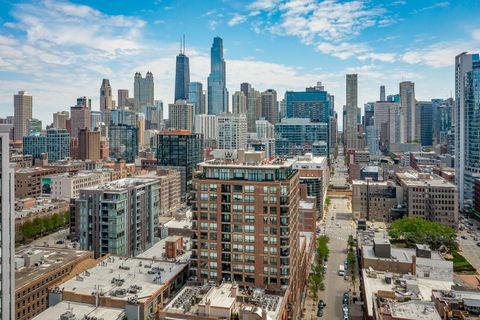
Active
$594,900
2
bds
|
2
ba
|
1,560
sqft
|
built
2006
1235 S Prairie Ave, Chicago, IL 60605
$-1,665
Cash flow
-14.6%
Cash-on-Cash Return
2.3%
Cap rate
0.7%
Rent to Value Ratio
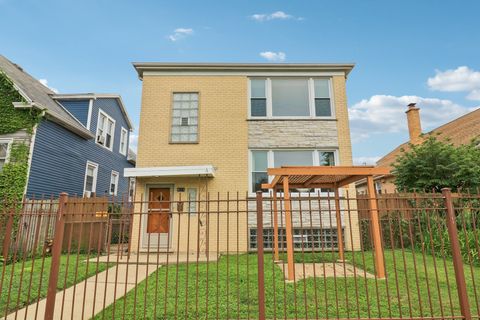
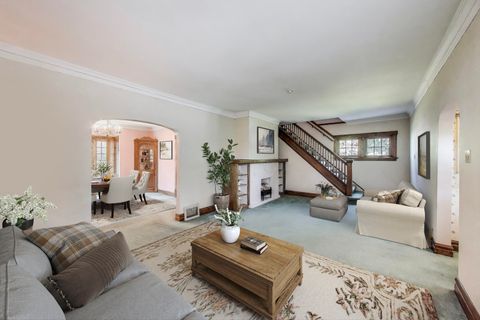
Active
$799,900
7
bds
|
5
ba
|
0
sqft
|
built
1973
5111 W Waveland Ave, Chicago, IL 60641
$-3,124
Cash flow
-20.4%
Cash-on-Cash Return
1.0%
Cap rate
0.3%
Rent to Value Ratio
Active
$309,900
2
bds
|
1
ba
|
1,000
sqft
|
built
1925
906 W Sunnyside Ave, Chicago, IL 60640
$-579
Cash flow
-9.7%
Cash-on-Cash Return
3.4%
Cap rate
0.8%
Rent to Value Ratio
Active
$389,000
3
bds
|
2
ba
|
1,776
sqft
|
built
1966
4 Exeter On Oxford, Rolling Meadows, IL 60008
$-724
Cash flow
-9.7%
Cash-on-Cash Return
3.4%
Cap rate
0.7%
Rent to Value Ratio
Active
$850,000
3
bds
|
2
ba
|
2,571
sqft
|
built
1926
38 Brier St, Winnetka, IL 60093
$-1,334
Cash flow
-8.2%
Cash-on-Cash Return
3.8%
Cap rate
0.6%
Rent to Value Ratio
Active
$179,000
2
bds
|
2
ba
|
1,000
sqft
|
built
1965
2206 S Goebbert Rd, Arlington Heights, IL 60005
$-714
Cash flow
-20.8%
Cash-on-Cash Return
0.9%
Cap rate
1.0%
Rent to Value Ratio
Active
$298,000
4
bds
|
2
ba
|
1,700
sqft
|
built
1960
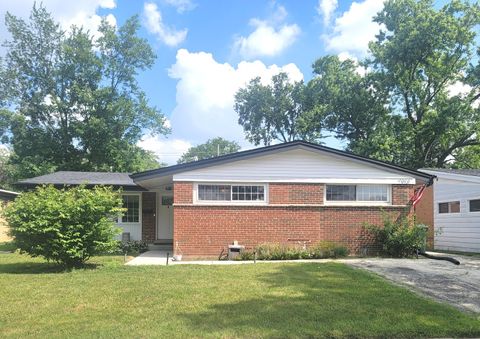
16030 University Ave, South Holland, IL 60473
$-295
Cash flow
-5.2%
Cash-on-Cash Return
4.5%
Cap rate
0.9%
Rent to Value Ratio
Active
$459,999
4
bds
|
2
ba
|
0
sqft
|
built
1928
1842 Elmwood Ave, Berwyn, IL 60402
$-1,221
Cash flow
-13.8%
Cash-on-Cash Return
2.5%
Cap rate
0.6%
Rent to Value Ratio
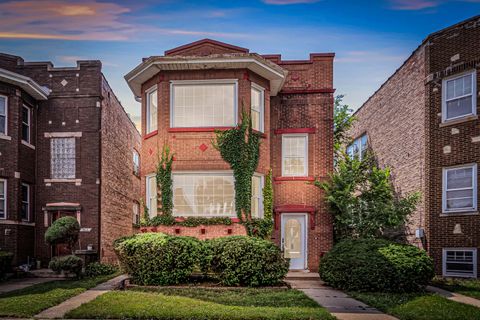
Active
$225,000
5
bds
|
2
ba
|
1,900
sqft
|
built
1916
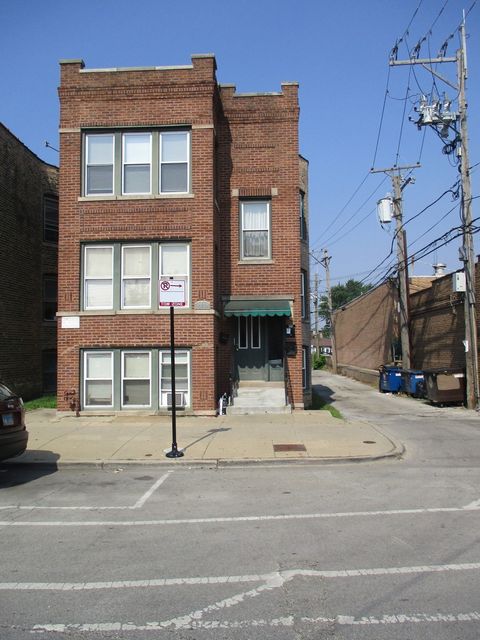
11311 S Wallace St, Chicago, IL 60628
$338
Cash flow
7.8%
Cash-on-Cash Return
7.5%
Cap rate
1.0%
Rent to Value Ratio
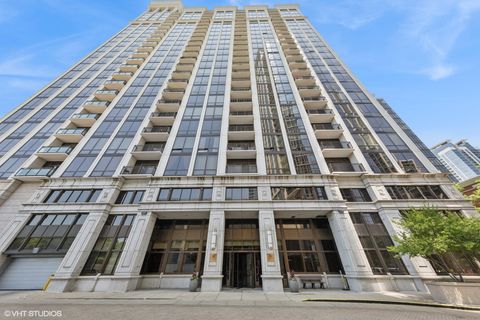
Active
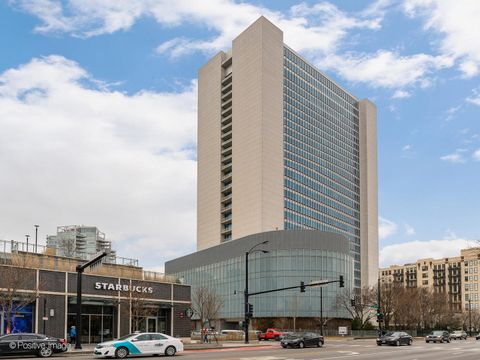
$1,350,000
2
bds
|
3
ba
|
2,197
sqft
|
built
2009
1211 S Prairie Ave, Chicago, IL 60605
$-7,771
Cash flow
-30.0%
Cash-on-Cash Return
-1.2%
Cap rate
0.2%
Rent to Value Ratio
Active
$649,000
5
bds
|
2
ba
|
3,000
sqft
|
built
1896
828 Monroe St, Evanston, IL 60202
$-898
Cash flow
-7.2%
Cash-on-Cash Return
4.0%
Cap rate
0.8%
Rent to Value Ratio
Active
$435,000
4
bds
|
2
ba
|
2,000
sqft
|
built
1958
316 S Mount Prospect Rd, Mount Prospect, IL 60056
$-396
Cash flow
-4.7%
Cash-on-Cash Return
4.6%
Cap rate
0.7%
Rent to Value Ratio
Active
$204,000
3
bds
|
2
ba
|
1,269
sqft
|
built
1955
3004 Longfellow Ave, Hazel Crest, IL 60429
$34
Cash flow
0.9%
Cash-on-Cash Return
5.9%
Cap rate
1.2%
Rent to Value Ratio
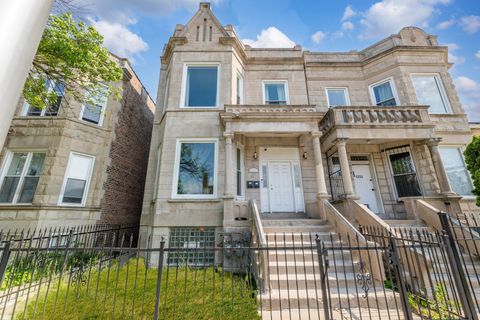
Active
$289,900
4
bds
|
3
ba
|
1,980
sqft
|
built
1923
8101 S Kimbark Ave, Chicago, IL 60619
$-360
Cash flow
-6.5%
Cash-on-Cash Return
4.2%
Cap rate
0.7%
Rent to Value Ratio
Active
$285,000
2
bds
|
2
ba
|
0
sqft
|
built
1925
4103 N Lawndale Ave, Chicago, IL 60618
$-617
Cash flow
-11.3%
Cash-on-Cash Return
3.1%
Cap rate
0.6%
Rent to Value Ratio
Active
$400,000
6
bds
|
2
ba
|
0
sqft
|
built
1899
6621 S Marquette Dr, Chicago, IL 60637
$-815
Cash flow
-10.6%
Cash-on-Cash Return
3.2%
Cap rate
0.5%
Rent to Value Ratio
Active
$1,549,000
5
bds
|
4
ba
|
4,640
sqft
|
built
2018
2847 W Division St, Chicago, IL 60622
$-2,597
Cash flow
-8.7%
Cash-on-Cash Return
3.7%
Cap rate
0.6%
Rent to Value Ratio
Active
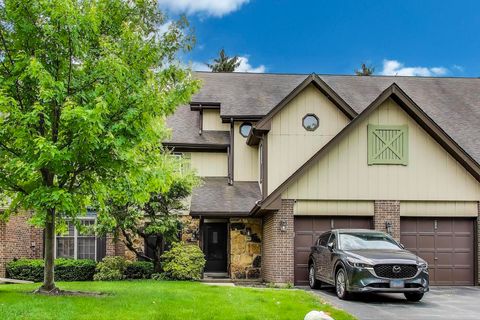
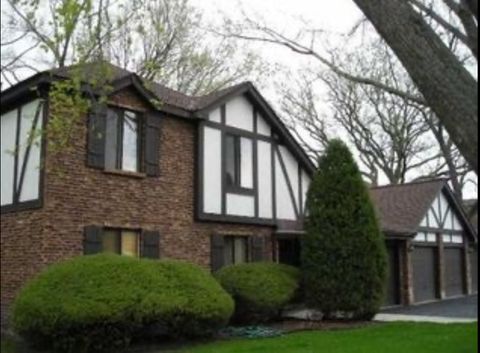
$329,900
3
bds
|
3
ba
|
2,150
sqft
|
built
1988
8459 Edelweiss Dr, Palos Park, IL 60464
$-246
Cash flow
-3.9%
Cash-on-Cash Return
4.8%
Cap rate
0.9%
Rent to Value Ratio
Active
$439,000
3
bds
|
3
ba
|
0
sqft
|
built
1910
1140 S Harvey Ave, Oak Park, IL 60304
$-784
Cash flow
-9.3%
Cash-on-Cash Return
3.5%
Cap rate
0.7%
Rent to Value Ratio
Active
$235,000
1
bds
|
1
ba
|
832
sqft
|
built
1973
655 W Irving Park Rd, Chicago, IL 60613
$-1,047
Cash flow
-23.2%
Cash-on-Cash Return
0.3%
Cap rate
1.0%
Rent to Value Ratio
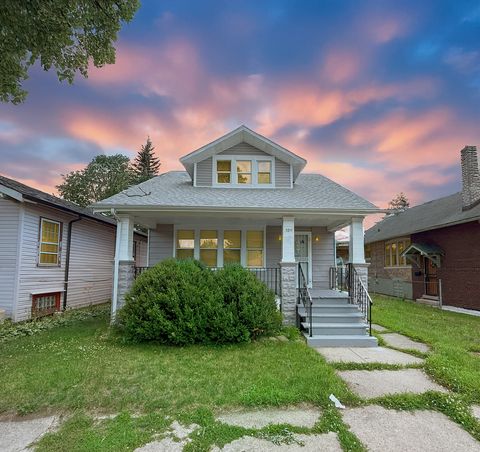
Active
$185,000
5
bds
|
1
ba
|
1,150
sqft
|
built
1930
12410 S Parnell Ave, Chicago, IL 60628
$261
Cash flow
7.4%
Cash-on-Cash Return
7.4%
Cap rate
1.0%
Rent to Value Ratio
Active
$525,000
4
bds
|
2
ba
|
2,033
sqft
|
built
1923
6854 N Osceola Ave, Chicago, IL 60631
$-381
Cash flow
-3.8%
Cash-on-Cash Return
4.8%
Cap rate
0.7%
Rent to Value Ratio
Active
$185,000
1
bds
|
1
ba
|
800
sqft
|
built
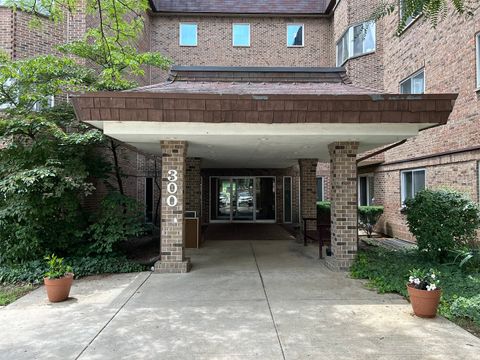
1970
300 S Roselle Rd, Schaumburg, IL 60193
$-372
Cash flow
-10.5%
Cash-on-Cash Return
3.3%
Cap rate
0.8%
Rent to Value Ratio
Active
$299,900
3
bds
|
2
ba
|
1,700
sqft
|
built
1979
181 W 28th St, South Chicago Heights, IL 60411
$-378
Cash flow
-6.6%
Cash-on-Cash Return
4.2%
Cap rate
0.7%
Rent to Value Ratio
Active
$950,000
3
bds
|
3
ba
|
1,803
sqft
|
built
2008
505 N Mc Clurg Ct, Chicago, IL 60611
$-2,678
Cash flow
-14.7%
Cash-on-Cash Return
2.3%
Cap rate
0.7%
Rent to Value Ratio
Active
$285,000
1
bds
|
1
ba
|
800
sqft
|
built
2002
212 E Cullerton St, Chicago, IL 60616
$-134
Cash flow
-2.5%
Cash-on-Cash Return
5.1%
Cap rate
1.0%
Rent to Value Ratio
Active
$465,000
3
bds
|
2
ba
|
1,701
sqft
|
built
1955
7324 Palma Ln, Morton Grove, IL 60053
$-572
Cash flow
-6.4%
Cash-on-Cash Return
4.2%
Cap rate
0.7%
Rent to Value Ratio
Active
$1,199,000
4
bds
|
5
ba
|
3,840
sqft
|
built
2016
6339 N Leona Ave, Chicago, IL 60646
$-1,663
Cash flow
-7.2%
Cash-on-Cash Return
4.0%
Cap rate
0.7%
Rent to Value Ratio
Active
$319,000
2
bds
|
2
ba
|
1,500
sqft
|
built
2217 W Farwell Ave, Chicago, IL 60645
$-433
Cash flow
-7.1%
Cash-on-Cash Return
4.1%
Cap rate
0.8%
Rent to Value Ratio
Active
$1,695,000
2
bds
|
3
ba
|
2,300
sqft
|
built
2000
800 N Michigan Ave, Chicago, IL 60611
$-7,499
Cash flow
-23.1%
Cash-on-Cash Return
0.4%
Cap rate
0.4%
Rent to Value Ratio
Active
$379,900
4
bds
|
3
ba
|
0
sqft
|
built
1918
10614 S Ewing Ave, Chicago, IL 60617
$-768
Cash flow
-10.5%
Cash-on-Cash Return
3.3%
Cap rate
0.5%
Rent to Value Ratio
Active
$415,000
7
bds
|
2
ba
|
0
sqft
|
built
1898
4251 W Jackson Blvd, Chicago, IL 60624
$-578
Cash flow
-7.3%
Cash-on-Cash Return
4.0%
Cap rate
0.5%
Rent to Value Ratio
Active
$3,250,000
4
bds
|
5
ba
|
6,800
sqft
|
built
1999
400 W Ontario St, Chicago, IL 60654
$-15,714
Cash flow
-25.2%
Cash-on-Cash Return
-0.1%
Cap rate
0.3%
Rent to Value Ratio
Active
$419,900
2
bds
|
2
ba
|
0
sqft
|
built
2005
233 E 13th St, Chicago, IL 60605
$-1,359
Cash flow
-16.9%
Cash-on-Cash Return
1.8%
Cap rate
0.7%
Rent to Value Ratio
Active
$499,000
2
bds
|
2
ba
|
1,200
sqft
|
built
2005
500 W Superior St, Chicago, IL 60654
$-1,433
Cash flow
-15.0%
Cash-on-Cash Return
2.2%
Cap rate
0.9%
Rent to Value Ratio
Active
$349,000
2
bds
|
2
ba
|
1,228
sqft
|
built
1989
206 Country Ln, Des Plaines, IL 60016
$-799
Cash flow
-11.9%
Cash-on-Cash Return
2.9%
Cap rate
0.6%
Rent to Value Ratio
Active
$249,000
2
bds
|
2
ba
|
1,480
sqft
|
built
1964
8234 Chestnut Dr, Palos Hills, IL 60465
$-383
Cash flow
-8.0%
Cash-on-Cash Return
3.8%
Cap rate
0.8%
Rent to Value Ratio
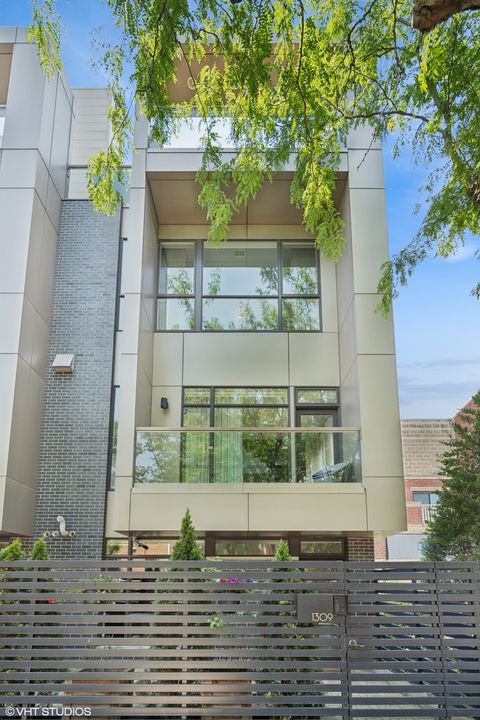
Active
$1,975,000
3
bds
|
4
ba
|
3,750
sqft
|
built
2014
1309 W Diversey Pkwy, Chicago, IL 60614
$-6,570
Cash flow
-17.4%
Cash-on-Cash Return
1.7%
Cap rate
0.4%
Rent to Value Ratio