Grundy County Investment Properties for Sale
Browse homes for sale and investment properties in Grundy County. Refine your search by price, property type, or more.
Best cash flowing properties in Grundy County
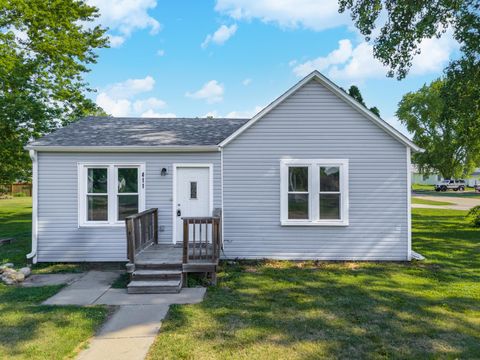
Active
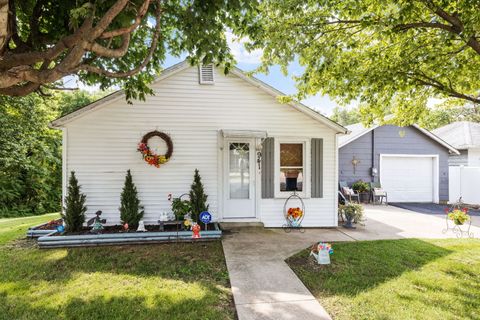
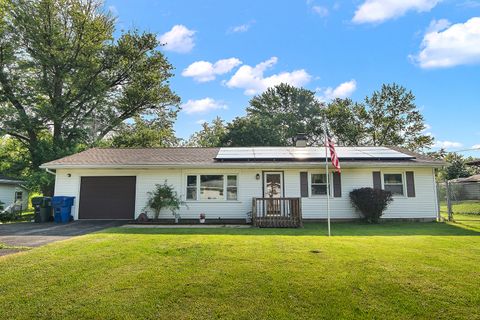
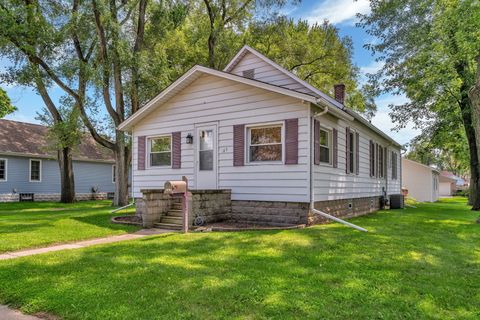
$159,100
2
bds
|
1
ba
|
812
sqft
|
built
1935
941 E Washington St, Morris, IL 60450
$288
Cash flow
9.4%
Cash-on-Cash Return
7.9%
Cap rate
1.0%
Rent to Value Ratio
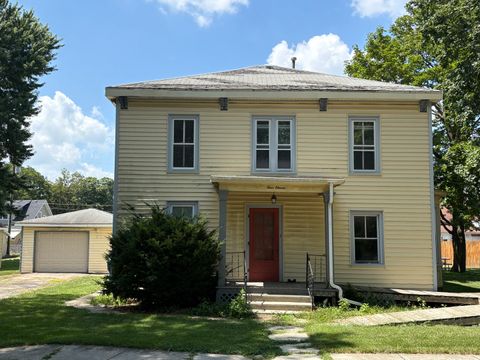
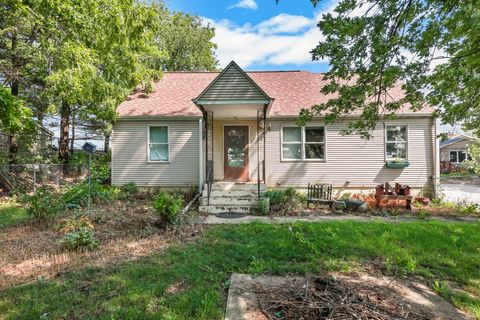
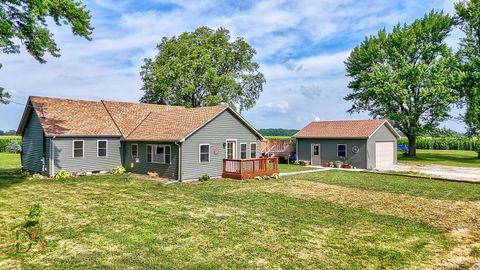
Active
$149,000
3
bds
|
2
ba
|
2,300
sqft
|
built
1900
411 Depot St, Mazon, IL 60444
$234
Cash flow
8.2%
Cash-on-Cash Return
7.6%
Cap rate
1.3%
Rent to Value Ratio
50 out of 54 properties for sale in Grundy County
Limited Results Shown
Create a free account, or log in to reveal all property listings and enjoy the complete experience.
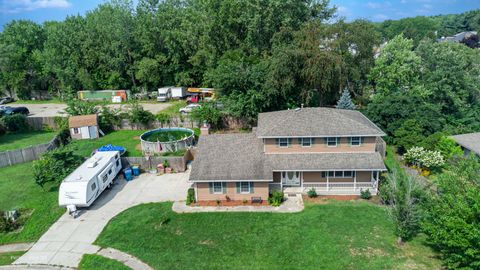
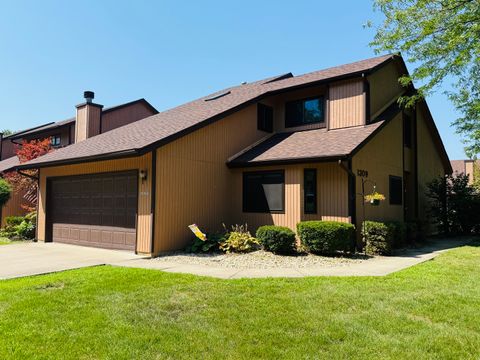
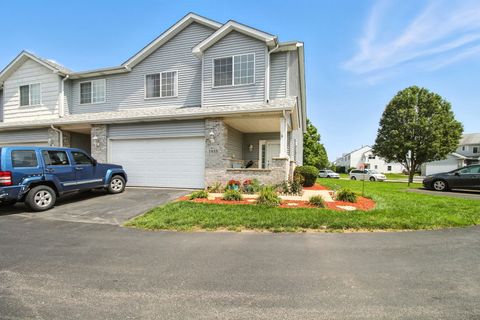
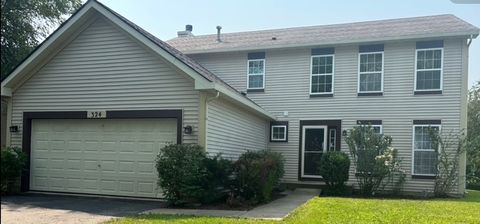
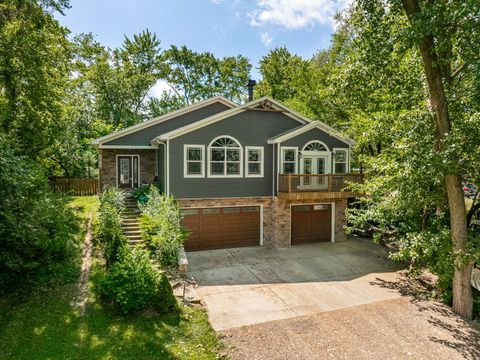
Active
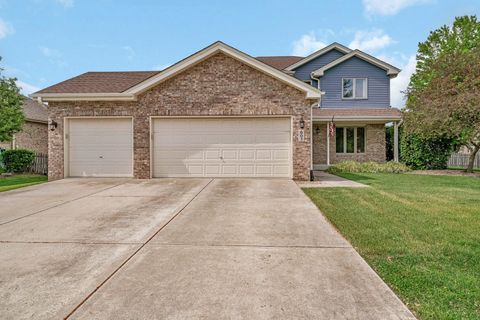
$299,900
3
bds
|
4
ba
|
2,600
sqft
|
built
1991
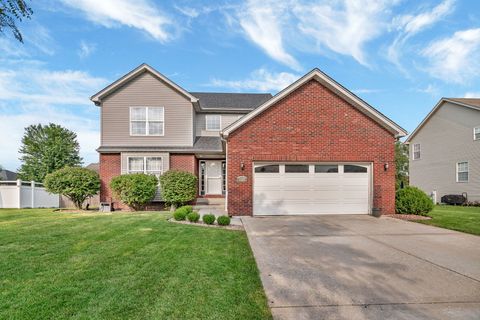
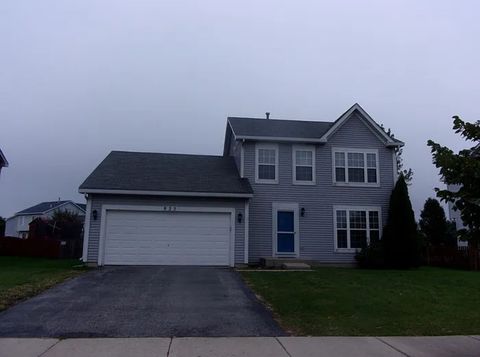
1518 Jodi Ct, Morris, IL 60450
$-137
Cash flow
-2.4%
Cash-on-Cash Return
5.1%
Cap rate
0.9%
Rent to Value Ratio
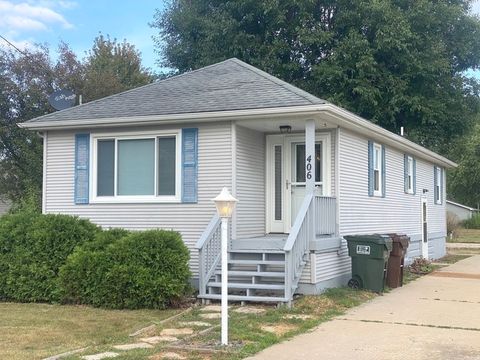
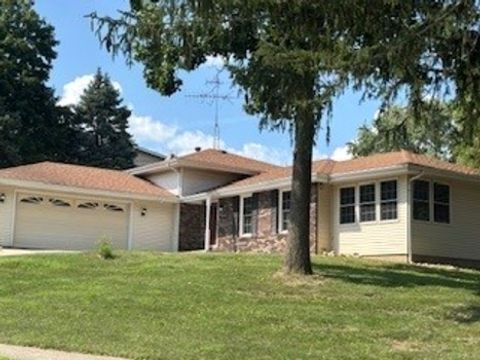
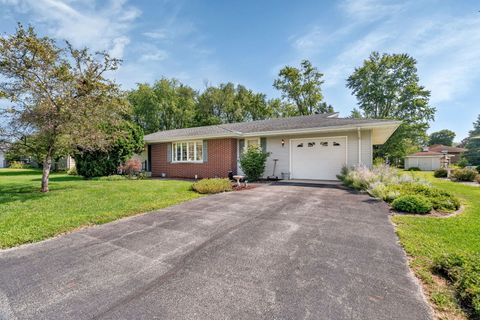
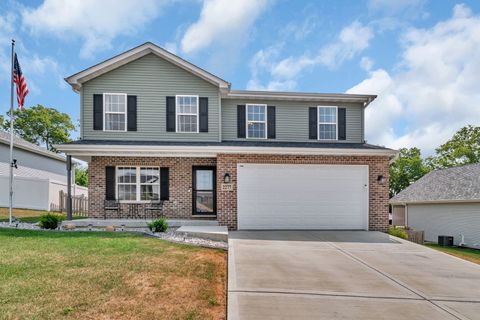
Active
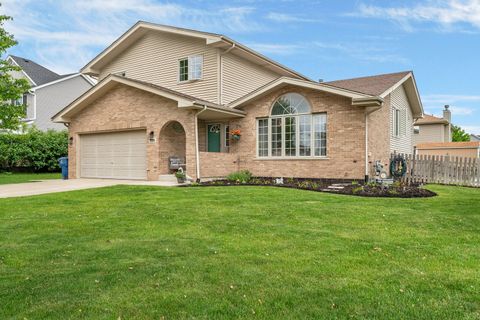
$289,000
3
bds
|
1
ba
|
1,200
sqft
|
built
1900
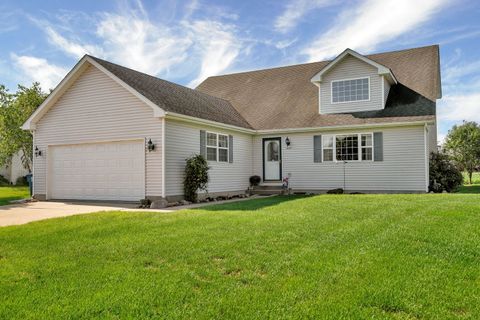
406 S Jackson St, Gardner, IL 60424
$-358
Cash flow
-6.5%
Cash-on-Cash Return
4.2%
Cap rate
0.6%
Rent to Value Ratio
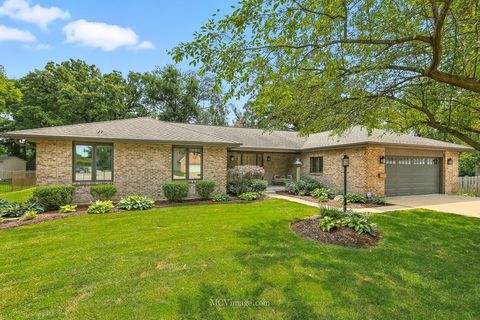
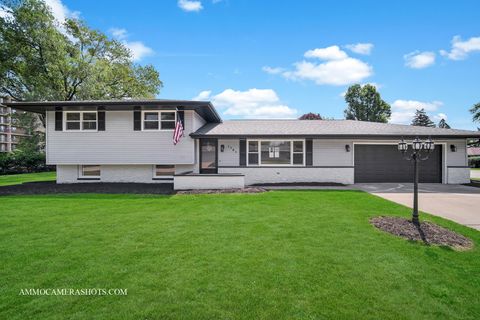
Active
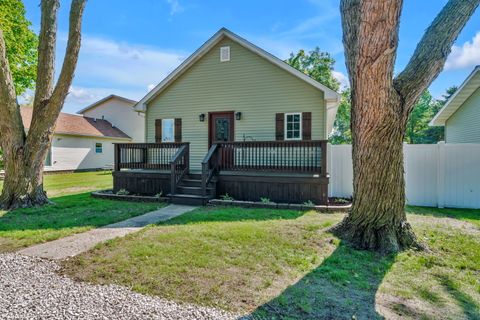
$409,000
3
bds
|
3
ba
|
2,120
sqft
|
built
2005
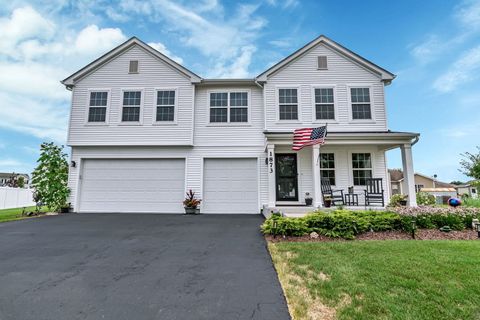
1110 S Sandstone Dr, Coal City, IL 60416
$-638
Cash flow
-8.1%
Cash-on-Cash Return
3.8%
Cap rate
0.5%
Rent to Value Ratio
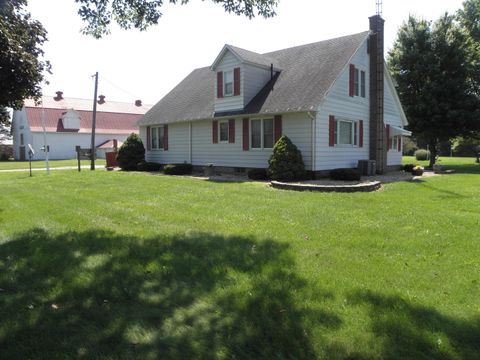
Active
$409,000
3
bds
|
2
ba
|
2,236
sqft
|
built
2006
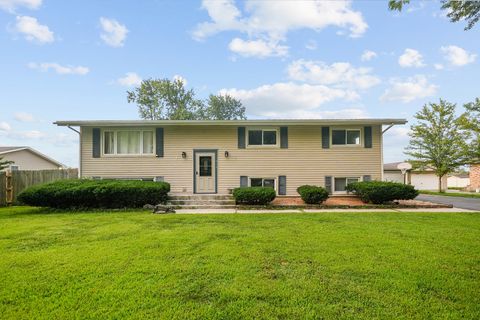
1807 Sunset Ln, Morris, IL 60450
$-613
Cash flow
-7.8%
Cash-on-Cash Return
3.9%
Cap rate
0.7%
Rent to Value Ratio
Active
$475,000
4
bds
|
3
ba
|
3,407
sqft
|
built
2021
1873 Sunflower Ct, Morris, IL 60450
$-794
Cash flow
-8.7%
Cash-on-Cash Return
3.7%
Cap rate
0.7%
Rent to Value Ratio
Active
$330,000
5
bds
|
2
ba
|
2,400
sqft
|
built
1973
1915 E Clark St, Diamond, IL 60416
$-701
Cash flow
-11.1%
Cash-on-Cash Return
3.1%
Cap rate
0.5%
Rent to Value Ratio
Active
$229,900
3
bds
|
1
ba
|
858
sqft
|
built
1965
308 Wabasso Pl, Minooka, IL 60447
$-101
Cash flow
-2.3%
Cash-on-Cash Return
5.2%
Cap rate
0.9%
Rent to Value Ratio
Active
$399,900
4
bds
|
3
ba
|
2,482
sqft
|
built
2005
601 High Grove Dr, Minooka, IL 60447
$-561
Cash flow
-7.3%
Cash-on-Cash Return
4.0%
Cap rate
0.8%
Rent to Value Ratio
Active
$398,500
4
bds
|
3
ba
|
2,254
sqft
|
built
2005
806 Feeney Dr, Minooka, IL 60447
$-667
Cash flow
-8.7%
Cash-on-Cash Return
3.7%
Cap rate
0.7%
Rent to Value Ratio
Active
$319,900
3
bds
|
2
ba
|
1,342
sqft
|
built
1910
75 4th Ave, South Wilmington, IL 60474
$-529
Cash flow
-8.6%
Cash-on-Cash Return
3.7%
Cap rate
0.6%
Rent to Value Ratio
Active
$235,000
3
bds
|
3
ba
|
0
sqft
|
built
1999
1309 Dresden Dr, Morris, IL 60450
$28
Cash flow
0.6%
Cash-on-Cash Return
5.8%
Cap rate
0.9%
Rent to Value Ratio
Active
$370,000
3
bds
|
2
ba
|
2,056
sqft
|
built
1978
102 Hickory Ln, Morris, IL 60450
$-598
Cash flow
-8.4%
Cash-on-Cash Return
3.7%
Cap rate
0.6%
Rent to Value Ratio
Active
$359,900
3
bds
|
3
ba
|
1,916
sqft
|
built
1989
210 Shawnee Dr, Minooka, IL 60447
$-347
Cash flow
-5.0%
Cash-on-Cash Return
4.5%
Cap rate
0.8%
Rent to Value Ratio
Active
$475,000
4
bds
|
3
ba
|
1,807
sqft
|
built
1940
4060 S Old Mazon Rd, Mazon, IL 60444
$-1,555
Cash flow
-17.1%
Cash-on-Cash Return
1.8%
Cap rate
0.4%
Rent to Value Ratio
Active
$235,000
3
bds
|
1
ba
|
1,145
sqft
|
built
1910
185 E Division St, Coal City, IL 60416
$-325
Cash flow
-7.2%
Cash-on-Cash Return
4.0%
Cap rate
0.7%
Rent to Value Ratio
Active
$299,997
3
bds
|
3
ba
|
1,770
sqft
|
built
2006
1935 Waters Edge Dr, Minooka, IL 60447
$-378
Cash flow
-6.6%
Cash-on-Cash Return
4.2%
Cap rate
0.8%
Rent to Value Ratio
Active
$263,000
3
bds
|
2
ba
|
1,608
sqft
|
built
1968
335 N Washington St, Coal City, IL 60416
$-321
Cash flow
-6.4%
Cash-on-Cash Return
4.2%
Cap rate
0.7%
Rent to Value Ratio
Active
$299,900
4
bds
|
2
ba
|
0
sqft
|
built
1968
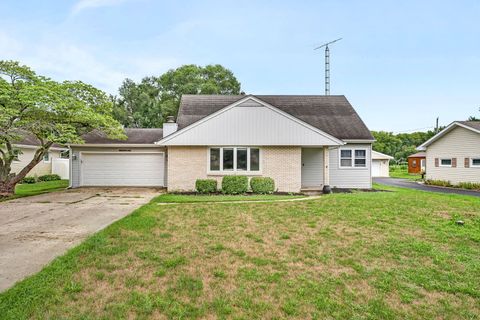
1701 Newton Dr, Morris, IL 60450
$-162
Cash flow
-2.8%
Cash-on-Cash Return
5.0%
Cap rate
0.8%
Rent to Value Ratio
Active
$310,000
3
bds
|
3
ba
|
1,508
sqft
|
built
2002
25724 S Bridle Path, Channahon, IL 60410
$-291
Cash flow
-4.9%
Cash-on-Cash Return
4.6%
Cap rate
0.8%
Rent to Value Ratio
Active
$369,000
3
bds
|
3
ba
|
1,828
sqft
|
built
1990
612 Center St, Mazon, IL 60444
$-451
Cash flow
-6.4%
Cash-on-Cash Return
4.2%
Cap rate
0.8%
Rent to Value Ratio

Active
$389,900
2
bds
|
3
ba
|
2,549
sqft
|
built
2020
27411 W Macura St, Channahon, IL 60410
$-533
Cash flow
-7.1%
Cash-on-Cash Return
4.0%
Cap rate
0.8%
Rent to Value Ratio
Active
$425,000
3
bds
|
3
ba
|
1,768
sqft
|
built
1992
80 E Spring Rd, Coal City, IL 60416
$-841
Cash flow
-10.3%
Cash-on-Cash Return
3.3%
Cap rate
0.5%
Rent to Value Ratio
Active
$240,000
4
bds
|
2
ba
|
1,877
sqft
|
built
1910
8600 S Kinsman Rd, Kinsman, IL 60437
$177
Cash flow
3.8%
Cash-on-Cash Return
6.6%
Cap rate
0.9%
Rent to Value Ratio
Active
$315,000
4
bds
|
4
ba
|
3,123
sqft
|
built
1975
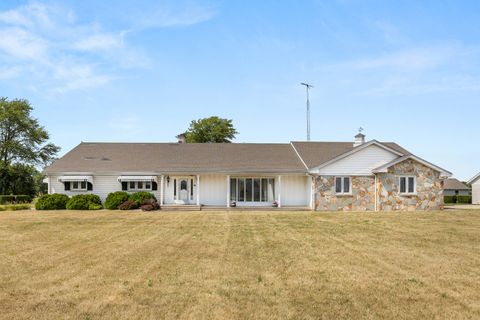
3825 School Dr, Morris, IL 60450
$-327
Cash flow
-5.4%
Cash-on-Cash Return
4.4%
Cap rate
0.8%
Rent to Value Ratio
Active
$549,900
3
bds
|
3
ba
|
4,037
sqft
|
built
1970
20 N Carbon Hill Rd, Coal City, IL 60416
$-2,226
Cash flow
-21.1%
Cash-on-Cash Return
0.8%
Cap rate
0.3%
Rent to Value Ratio
Active
$345,000
3
bds
|
3
ba
|
1,665
sqft
|
built
2005
825 Grant Dr, Minooka, IL 60447
$-451
Cash flow
-6.8%
Cash-on-Cash Return
4.1%
Cap rate
0.7%
Rent to Value Ratio
Active
$825,000
6
bds
|
4
ba
|
4,338
sqft
|
built
1992
3205 W Southmor Rd, Morris, IL 60450
$-780
Cash flow
-4.9%
Cash-on-Cash Return
4.5%
Cap rate
0.7%
Rent to Value Ratio
Active
$367,400
3
bds
|
3
ba
|
2,464
sqft
|
built
2005
324 Wabena Ct, Minooka, IL 60447
$-423
Cash flow
-6.0%
Cash-on-Cash Return
4.3%
Cap rate
0.8%
Rent to Value Ratio
Active
$182,000
2
bds
|
1
ba
|
934
sqft
|
built
1960
180 E US Route 6, Morris, IL 60450
$35
Cash flow
1.0%
Cash-on-Cash Return
5.9%
Cap rate
0.9%
Rent to Value Ratio
Active
$395,000
3
bds
|
4
ba
|
4,770
sqft
|
built
1925
304 Nettle St, Morris, IL 60450
$-259
Cash flow
-3.4%
Cash-on-Cash Return
4.9%
Cap rate
0.9%
Rent to Value Ratio
Active
$285,000
3
bds
|
3
ba
|
1,448
sqft
|
built
2001
1703 Waters Edge Dr, Minooka, IL 60447
$-439
Cash flow
-8.0%
Cash-on-Cash Return
3.8%
Cap rate
0.8%
Rent to Value Ratio
Active
$410,000
4
bds
|
3
ba
|
1,986
sqft
|
built
2017
5765 Muskie Trl, Morris, IL 60450
$-361
Cash flow
-4.6%
Cash-on-Cash Return
4.6%
Cap rate
0.8%
Rent to Value Ratio
Active
$380,000
4
bds
|
3
ba
|
2,200
sqft
|
built
2021
2277 Parklake Dr, Morris, IL 60450
$-385
Cash flow
-5.3%
Cash-on-Cash Return
4.5%
Cap rate
0.8%
Rent to Value Ratio
Active
$337,000
3
bds
|
2
ba
|
0
sqft
|
built
8965 S Holm Rd, Dwight, IL 60420
$-838
Cash flow
-13.0%
Cash-on-Cash Return
2.7%
Cap rate
0.5%
Rent to Value Ratio
Active
$315,000
3
bds
|
1
ba
|
1,200
sqft
|
built
1962
8850 E Mallard Ln, Wilmington, IL 60481
$-560
Cash flow
-9.3%
Cash-on-Cash Return
3.5%
Cap rate
0.6%
Rent to Value Ratio
Active
$139,000
2
bds
|
1
ba
|
1,000
sqft
|
built
411 E Mazon St, Gardner, IL 60424
$132
Cash flow
5.0%
Cash-on-Cash Return
6.8%
Cap rate
1.0%
Rent to Value Ratio
Active
$570,000
3
bds
|
4
ba
|
3,144
sqft
|
built
1994
1020 Gladys Ave, Morris, IL 60450
$-1,385
Cash flow
-12.7%
Cash-on-Cash Return
2.8%
Cap rate
0.5%
Rent to Value Ratio

Active
$1,600,000
4
bds
|
3
ba
|
5,489
sqft
|
built
2003
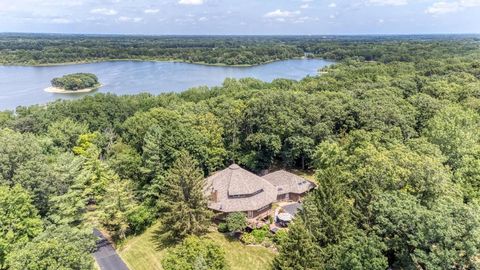
4965 Cemetery Rd, Morris, IL 60450
$-4,562
Cash flow
-14.9%
Cash-on-Cash Return
2.3%
Cap rate
0.4%
Rent to Value Ratio