Lake County Investment Properties for Sale
Browse homes for sale and investment properties in Lake County. Refine your search by price, property type, or more.
Best cash flowing properties in Lake County
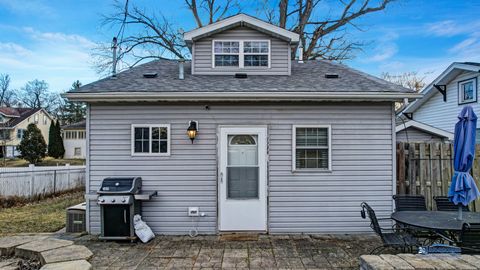
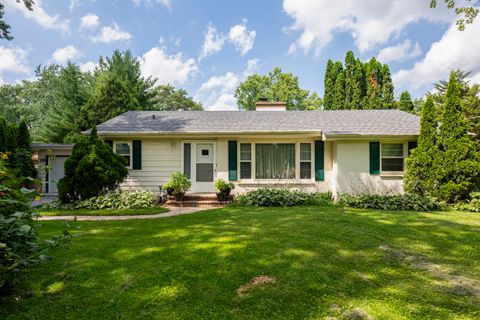
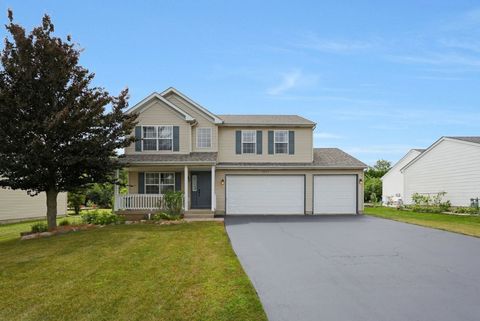
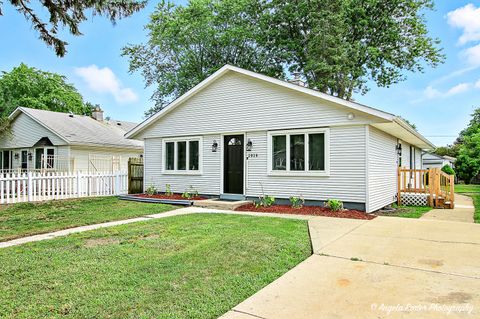
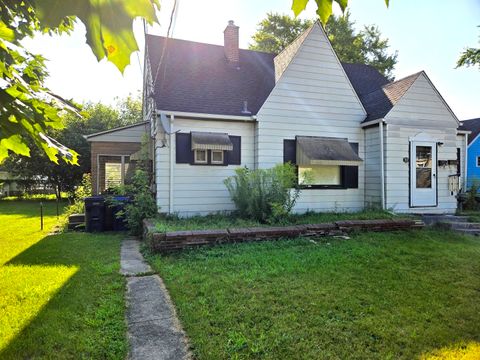
Active
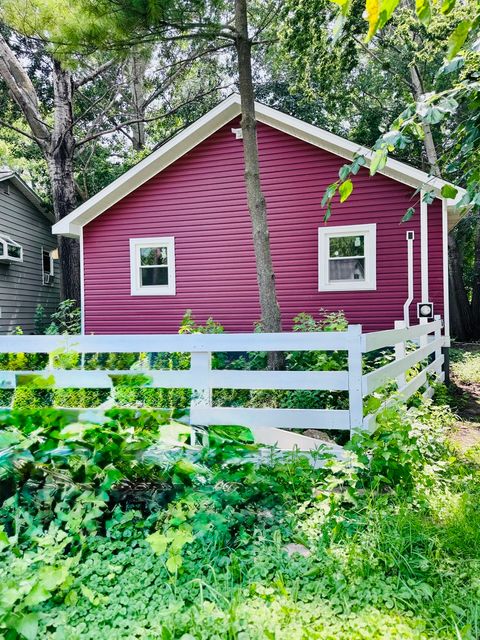
$225,000
3
bds
|
1
ba
|
1,025
sqft
|
built
1965
43247 N Grandview Ter, Antioch, IL 60002
$52
Cash flow
1.2%
Cash-on-Cash Return
6.0%
Cap rate
1.0%
Rent to Value Ratio
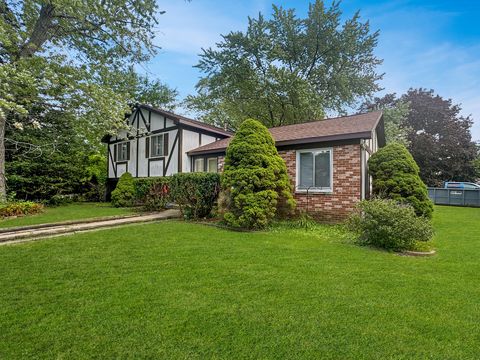
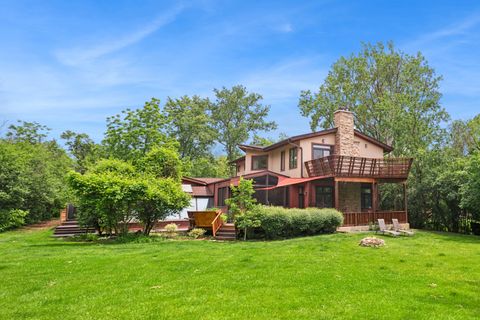
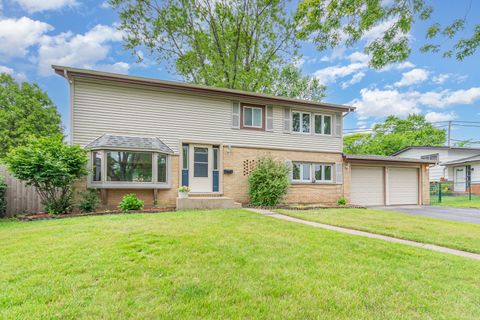
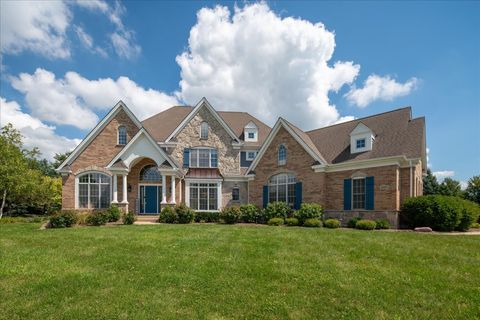
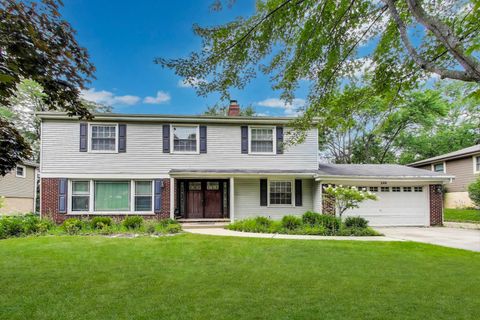
Active
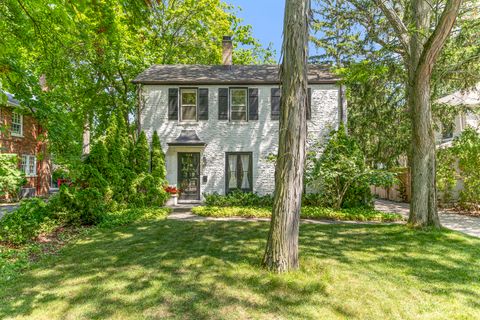
$235,000
3
bds
|
2
ba
|
1,800
sqft
|
built
1972
59 Chestnut Cir, Lindenhurst, IL 60046
$0
Cash flow
0.0%
Cash-on-Cash Return
5.7%
Cap rate
1.1%
Rent to Value Ratio
430 out of 509 properties for sale in Lake County
Limited Results Shown
Create a free account, or log in to reveal all property listings and enjoy the complete experience.
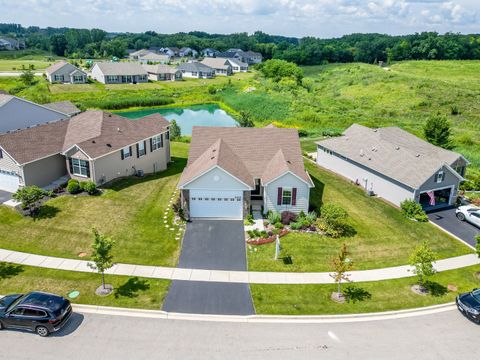
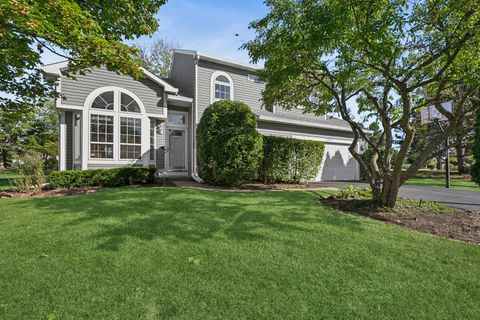
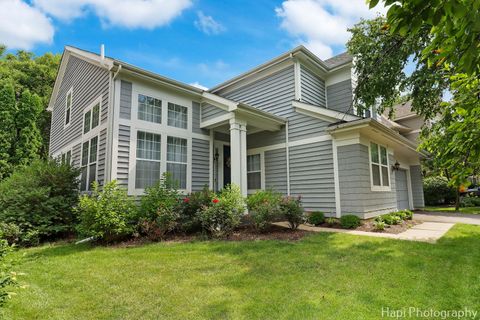
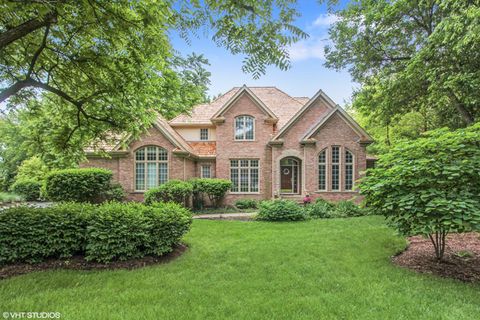
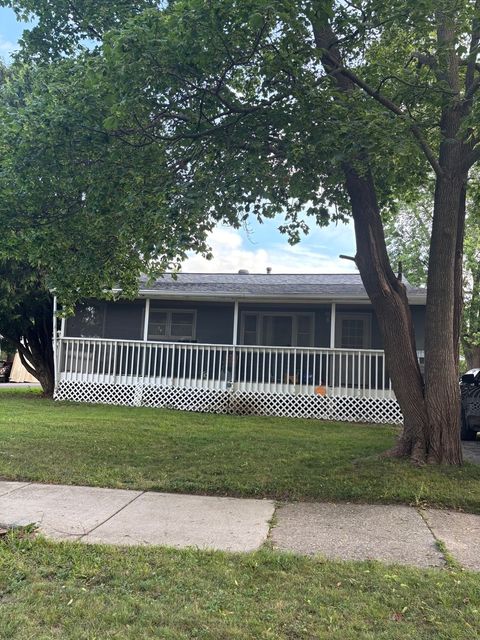
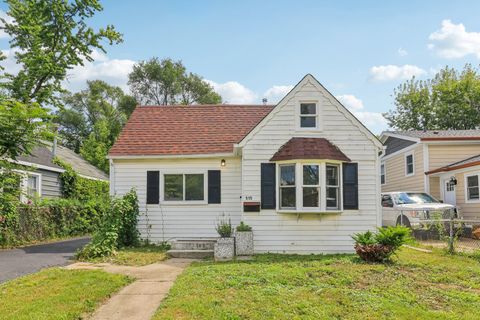
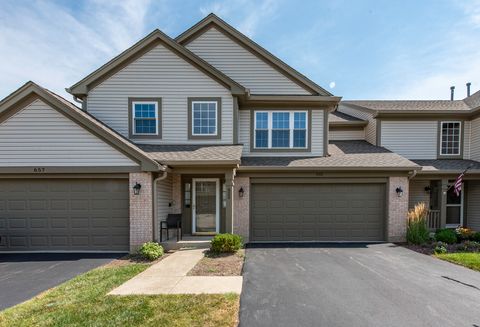
Active
$465,000
3
bds
|
3
ba
|
0
sqft
|
built
2022
2032 Wentworth Dr, Volo, IL 60020
$-952
Cash flow
-10.7%
Cash-on-Cash Return
3.2%
Cap rate
0.7%
Rent to Value Ratio
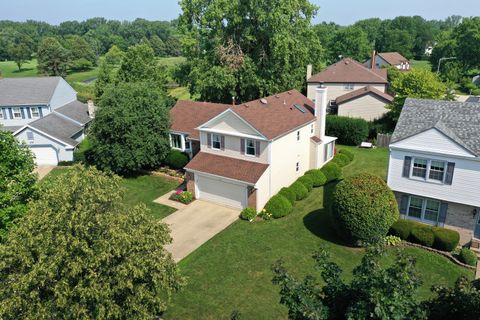
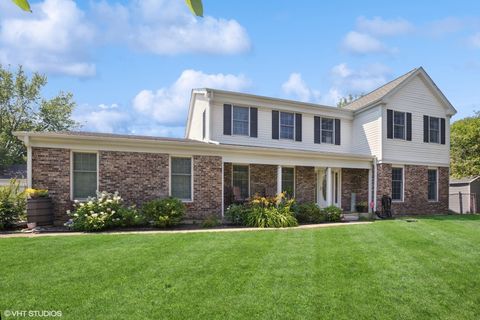
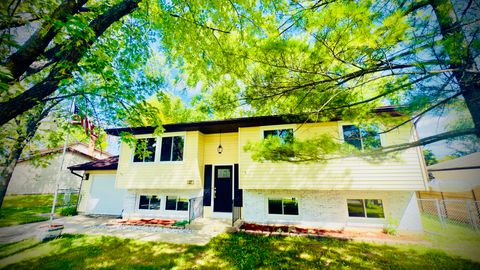
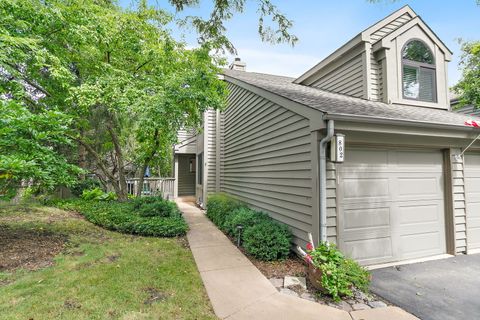
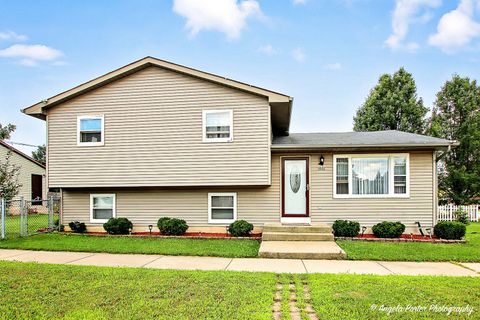
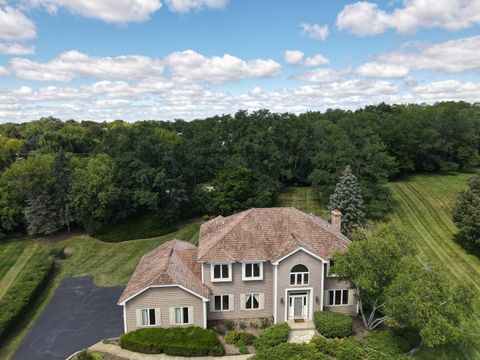
Active
$565,000
3
bds
|
3
ba
|
2,246
sqft
|
built
1988
412 Chateau Dr, Buffalo Grove, IL 60089
$-1,396
Cash flow
-12.9%
Cash-on-Cash Return
2.7%
Cap rate
0.6%
Rent to Value Ratio
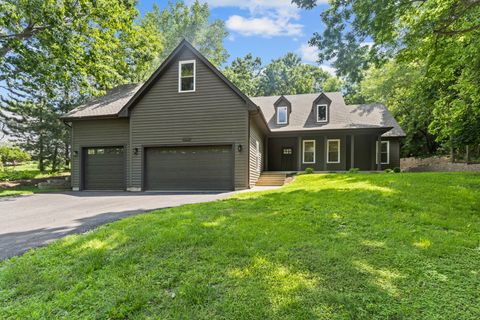
Active
$525,000
3
bds
|
3
ba
|
3,176
sqft
|
built
1975
323 W Golf Rd, Libertyville, IL 60048
$-915
Cash flow
-9.1%
Cash-on-Cash Return
3.6%
Cap rate
0.7%
Rent to Value Ratio
Active
$420,000
3
bds
|
3
ba
|
2,740
sqft
|
built
1991
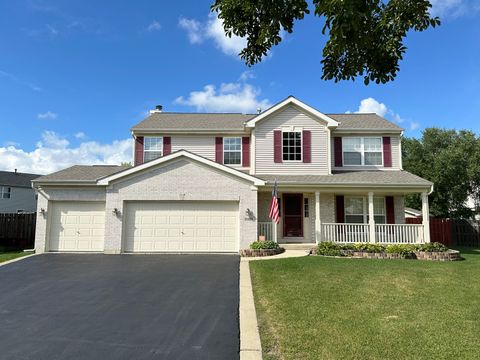
36077 N Bridlewood Ave, Gurnee, IL 60031
$-925
Cash flow
-11.5%
Cash-on-Cash Return
3.0%
Cap rate
0.7%
Rent to Value Ratio
Active
$649,990
4
bds
|
3
ba
|
2,656
sqft
|
built
1974
523 N Ela Rd, Barrington, IL 60010
$-1,432
Cash flow
-11.5%
Cash-on-Cash Return
3.0%
Cap rate
0.6%
Rent to Value Ratio
Active
$549,900
4
bds
|
4
ba
|
3,550
sqft
|
built
2002
38623 N Konen Ave, Spring Grove, IL 60081
$-1,694
Cash flow
-16.1%
Cash-on-Cash Return
2.0%
Cap rate
0.5%
Rent to Value Ratio

Active
$1,300,000
3
bds
|
3
ba
|
5,849
sqft
|
built
2017
26303 W Merton Rd, Barrington, IL 60010
$-4,670
Cash flow
-18.7%
Cash-on-Cash Return
1.4%
Cap rate
0.3%
Rent to Value Ratio
Active
$529,000
3
bds
|
2
ba
|
1,800
sqft
|
built
1956
178 Brookhill Rd, Libertyville, IL 60048
$-1,020
Cash flow
-10.1%
Cash-on-Cash Return
3.4%
Cap rate
0.6%
Rent to Value Ratio

Active
$365,000
4
bds
|
2
ba
|
2,400
sqft
|
built
1969
418 Surrey Ln, Lindenhurst, IL 60046
$-361
Cash flow
-5.2%
Cash-on-Cash Return
4.5%
Cap rate
0.8%
Rent to Value Ratio
Active
$980,000
6
bds
|
6
ba
|
5,628
sqft
|
built
1965
2419 Riverwoods Rd, Riverwoods, IL 60015
$-3,154
Cash flow
-16.8%
Cash-on-Cash Return
1.8%
Cap rate
0.4%
Rent to Value Ratio
Active
$789,000
5
bds
|
3
ba
|
2,711
sqft
|
built
1995
2260 Congressional Ln, Riverwoods, IL 60015
$-2,589
Cash flow
-17.1%
Cash-on-Cash Return
1.7%
Cap rate
0.5%
Rent to Value Ratio
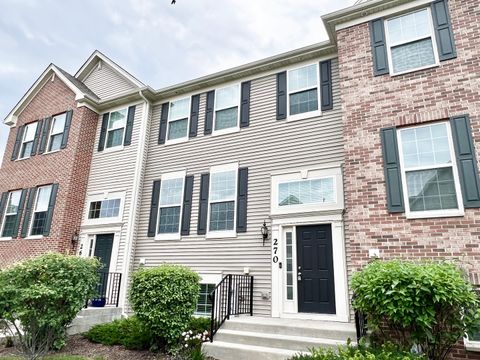
Active
$335,000
3
bds
|
3
ba
|
1,764
sqft
|
built
2017
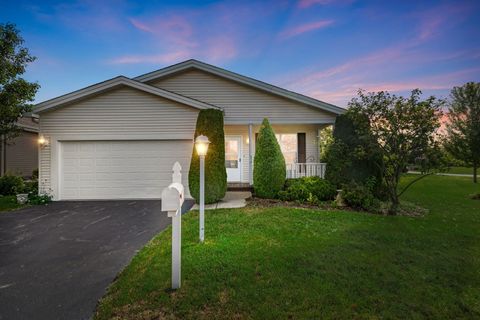
270 Lionel Dr, Grayslake, IL 60030
$-731
Cash flow
-11.4%
Cash-on-Cash Return
3.1%
Cap rate
0.8%
Rent to Value Ratio

Active
$1,089,000
4
bds
|
6
ba
|
4,539
sqft
|
built
1994
12 Riderwood Rd, North Barrington, IL 60010
$-2,918
Cash flow
-14.0%
Cash-on-Cash Return
2.5%
Cap rate
0.6%
Rent to Value Ratio

Active
$839,000
3
bds
|
3
ba
|
2,602
sqft
|
built
1987
1625 Churchill Ct, Libertyville, IL 60048
$-2,595
Cash flow
-16.1%
Cash-on-Cash Return
2.0%
Cap rate
0.4%
Rent to Value Ratio
Active
$299,000
2
bds
|
2
ba
|
765
sqft
|
built
1967
27849 W Lake Shore Dr, Spring Grove, IL 60081
$-503
Cash flow
-8.8%
Cash-on-Cash Return
3.7%
Cap rate
0.6%
Rent to Value Ratio
Active
$749,000
4
bds
|
3
ba
|
2,134
sqft
|
built
1928
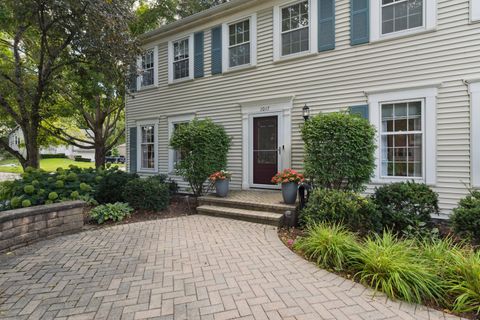
325 Lincolnwood Rd, Highland Park, IL 60035
$-1,677
Cash flow
-11.7%
Cash-on-Cash Return
3.0%
Cap rate
0.6%
Rent to Value Ratio
Active
$895,000
4
bds
|
5
ba
|
4,351
sqft
|
built
1996
26495 Southgate Trl, Port Barrington, IL 60010
$-1,869
Cash flow
-10.9%
Cash-on-Cash Return
3.2%
Cap rate
0.6%
Rent to Value Ratio
Active
$389,900
3
bds
|
2
ba
|
1,556
sqft
|
built
1973
527 Northgate Rd, Lindenhurst, IL 60046
$-812
Cash flow
-10.9%
Cash-on-Cash Return
3.2%
Cap rate
0.6%
Rent to Value Ratio
Active
$369,000
3
bds
|
4
ba
|
1,780
sqft
|
built
2003
2031 Dawn Ln, Zion, IL 60099
$-61
Cash flow
-0.9%
Cash-on-Cash Return
5.5%
Cap rate
0.8%
Rent to Value Ratio
Active
$350,000
5
bds
|
2
ba
|
1,872
sqft
|
built
1960
413 Northshore Dr, Mundelein, IL 60060
$-419
Cash flow
-6.2%
Cash-on-Cash Return
4.2%
Cap rate
0.8%
Rent to Value Ratio
Active
$199,000
2
bds
|
2
ba
|
768
sqft
|
built
1954
1635 Ferry St, Waukegan, IL 60087
$-104
Cash flow
-2.7%
Cash-on-Cash Return
5.1%
Cap rate
0.9%
Rent to Value Ratio
Active
$410,000
2
bds
|
3
ba
|
2,450
sqft
|
built
1990
802 Golf Ln, Lake Barrington, IL 60010
$-1,316
Cash flow
-16.7%
Cash-on-Cash Return
1.8%
Cap rate
0.7%
Rent to Value Ratio
Active
$265,000
4
bds
|
1
ba
|
1,247
sqft
|
built
1970
2029 Gideon Ave, Zion, IL 60099
$-440
Cash flow
-8.7%
Cash-on-Cash Return
3.7%
Cap rate
0.8%
Rent to Value Ratio
Active
$810,000
5
bds
|
4
ba
|
3,037
sqft
|
built
2003
28413 W Harvest Glen Cir, Cary, IL 60013
$-1,801
Cash flow
-11.6%
Cash-on-Cash Return
3.0%
Cap rate
0.6%
Rent to Value Ratio
Active
$210,000
2
bds
|
1
ba
|
716
sqft
|
built
1940
515 Catalpa Dr, Round Lake, IL 60073
$-119
Cash flow
-3.0%
Cash-on-Cash Return
5.0%
Cap rate
0.8%
Rent to Value Ratio
Active
$265,000
3
bds
|
2
ba
|
1,800
sqft
|
built
1993
1901 Gilboa Ave, Zion, IL 60099
$-273
Cash flow
-5.4%
Cash-on-Cash Return
4.4%
Cap rate
0.9%
Rent to Value Ratio
Active
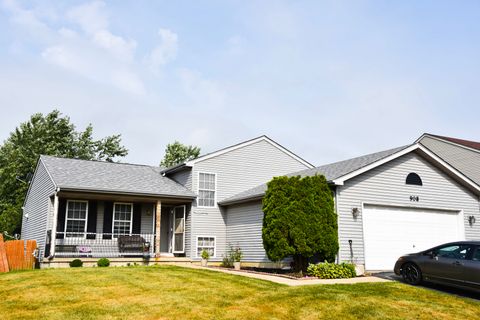
$300,000
3
bds
|
3
ba
|
2,543
sqft
|
built
1999
908 Countrywood Dr, Zion, IL 60099
$-590
Cash flow
-10.3%
Cash-on-Cash Return
3.3%
Cap rate
0.8%
Rent to Value Ratio
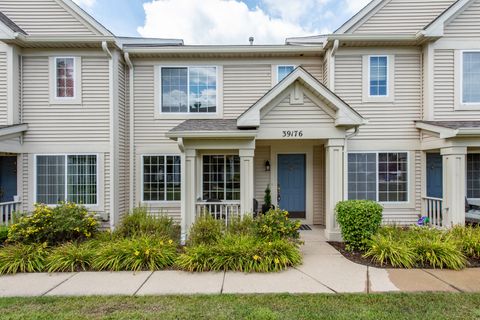
Active
$235,000
2
bds
|
3
ba
|
1,318
sqft
|
built
2005
39176 Welsh Ln, Beach Park, IL 60083
$-436
Cash flow
-9.7%
Cash-on-Cash Return
3.5%
Cap rate
0.9%
Rent to Value Ratio
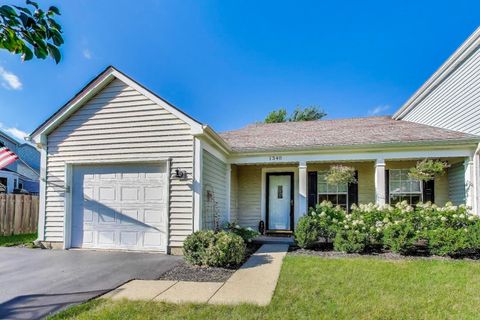
Active
$320,000
2
bds
|
2
ba
|
1,369
sqft
|
built
1988
1340 Spalding Dr, Mundelein, IL 60060
$-380
Cash flow
-6.2%
Cash-on-Cash Return
4.3%
Cap rate
0.8%
Rent to Value Ratio
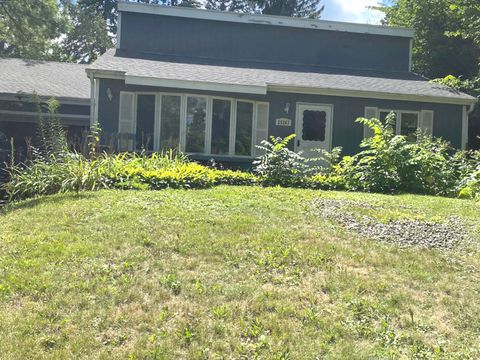
Active
$275,000
3
bds
|
2
ba
|
1,186
sqft
|
built
1958
25267 W Timber Ln, Lake Villa, IL 60046
$-103
Cash flow
-2.0%
Cash-on-Cash Return
5.2%
Cap rate
0.8%
Rent to Value Ratio
Active
$695,000
4
bds
|
3
ba
|
2,238
sqft
|
built
1963
248 Beverly Rd, Barrington, IL 60010
$-1,719
Cash flow
-12.9%
Cash-on-Cash Return
2.7%
Cap rate
0.5%
Rent to Value Ratio
Active
$720,000
4
bds
|
5
ba
|
3,446
sqft
|
built
1989
25410 N Cayuga Trl, Lake Barrington, IL 60010
$-1,770
Cash flow
-12.8%
Cash-on-Cash Return
2.7%
Cap rate
0.5%
Rent to Value Ratio
Active
$236,000
5
bds
|
3
ba
|
0
sqft
|
built
1902
1117 Judge Ave, Waukegan, IL 60085
$-125
Cash flow
-2.8%
Cash-on-Cash Return
5.0%
Cap rate
0.8%
Rent to Value Ratio
Active
$274,900
3
bds
|
2
ba
|
1,404
sqft
|
built
1996
655 Arrowwood Ct, Lindenhurst, IL 60046
$-553
Cash flow
-10.5%
Cash-on-Cash Return
3.3%
Cap rate
0.8%
Rent to Value Ratio
Active
$430,000
4
bds
|
3
ba
|
1,946
sqft
|
built
1999
32526 Pilgrims Ct, Lakemoor, IL 60051
$-1,071
Cash flow
-13.0%
Cash-on-Cash Return
2.7%
Cap rate
0.6%
Rent to Value Ratio
Active
$225,000
2
bds
|
2
ba
|
1,776
sqft
|
built
2005
1 Rocking Horse Ln, Grayslake, IL 60030
$-791
Cash flow
-18.3%
Cash-on-Cash Return
1.5%
Cap rate
1.0%
Rent to Value Ratio
Active
$475,000
3
bds
|
4
ba
|
2,700
sqft
|
built
1994
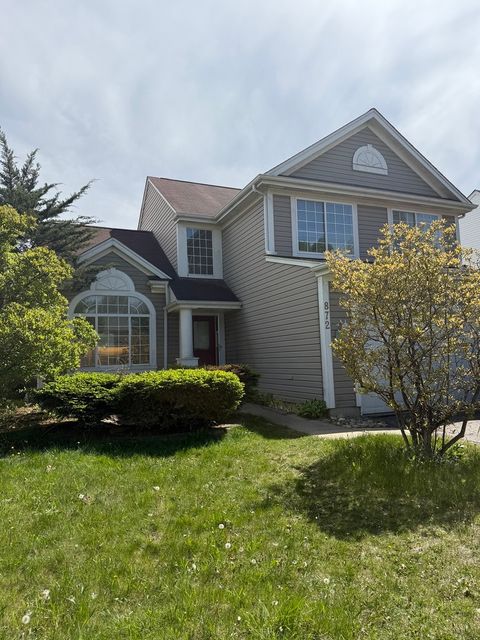
872 Tylerton Cir, Grayslake, IL 60030
$-1,052
Cash flow
-11.6%
Cash-on-Cash Return
3.0%
Cap rate
0.7%
Rent to Value Ratio
Active
$680,000
4
bds
|
3
ba
|
2,618
sqft
|
built
1973
1017 Dawes St, Libertyville, IL 60048
$-1,595
Cash flow
-12.2%
Cash-on-Cash Return
2.9%
Cap rate
0.6%
Rent to Value Ratio