Lee County Investment Properties for Sale
Browse homes for sale and investment properties in Lee County. Refine your search by price, property type, or more.
Best cash flowing properties in Lee County
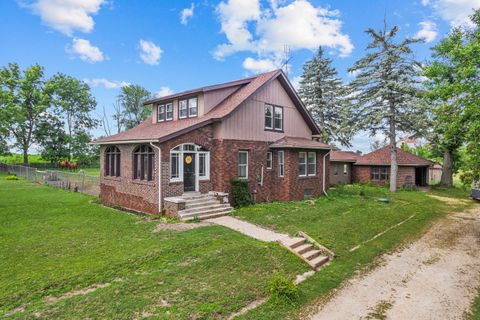
Active
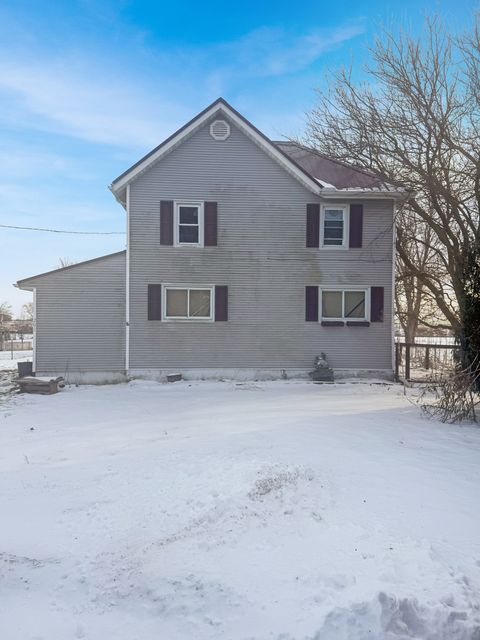
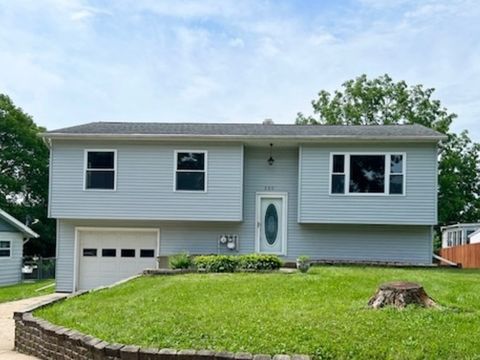
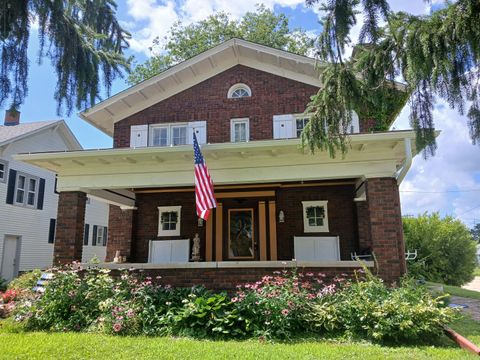
$60,500
3
bds
|
2
ba
|
1,488
sqft
|
built
1911
205 W Shellhammer St, Harmon, IL 61042
$1,106
Cash flow
21.3%
Cash-on-Cash Return
21.9%
Cap rate
3.0%
Rent to Value Ratio
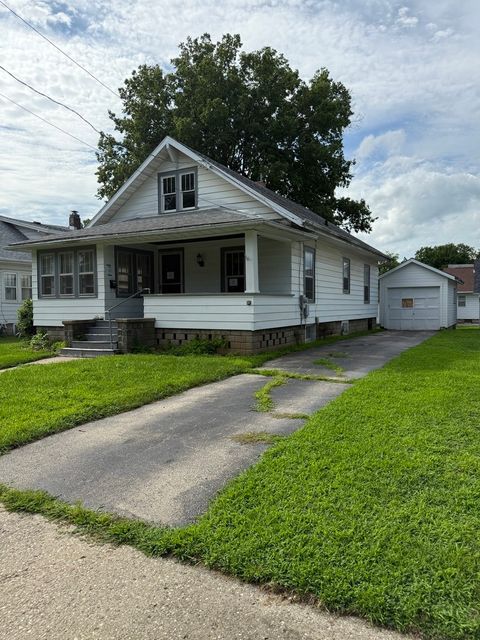
Active
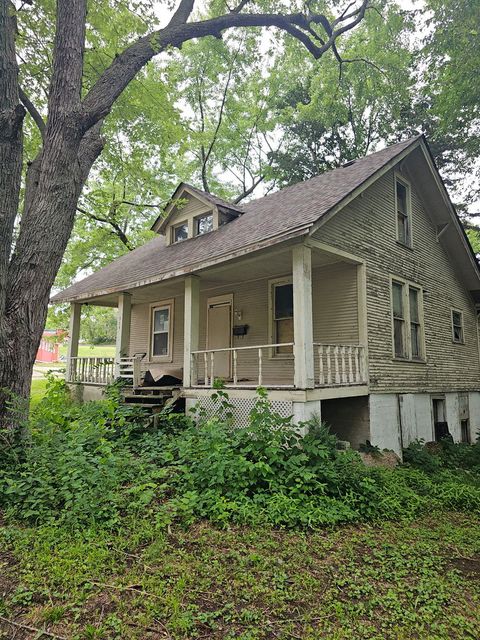
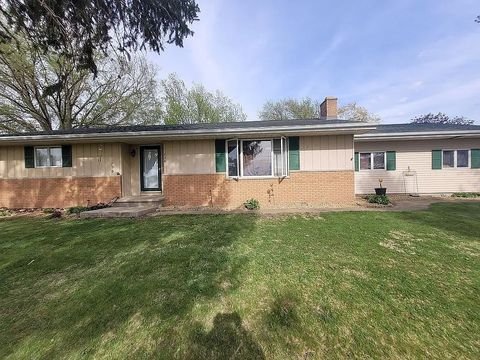
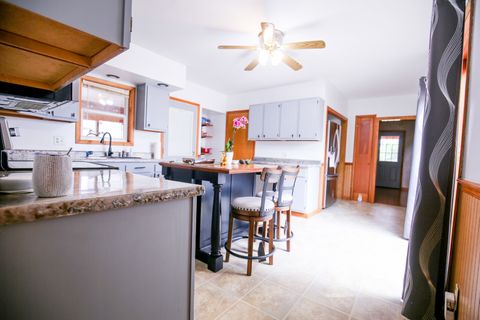
$37,900
3
bds
|
1
ba
|
1,080
sqft
|
built
1910
904 Walnut Ave, Dixon, IL 61021
$690
Cash flow
21.2%
Cash-on-Cash Return
21.8%
Cap rate
3.2%
Rent to Value Ratio
39 out of 41 properties for sale in Lee County
Limited Results Shown
Create a free account, or log in to reveal all property listings and enjoy the complete experience.
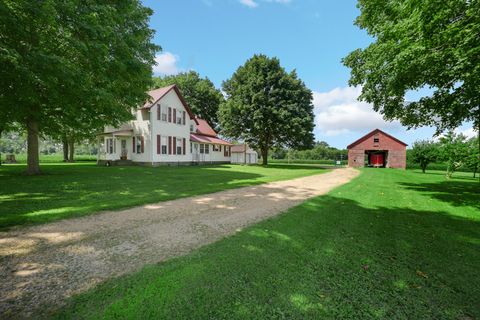
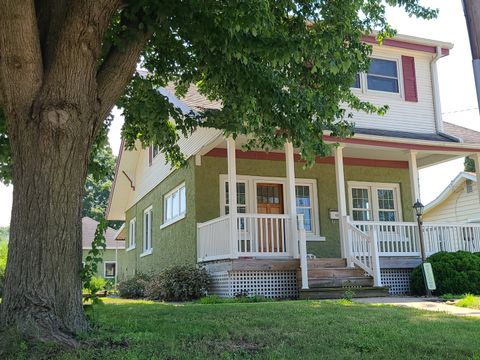
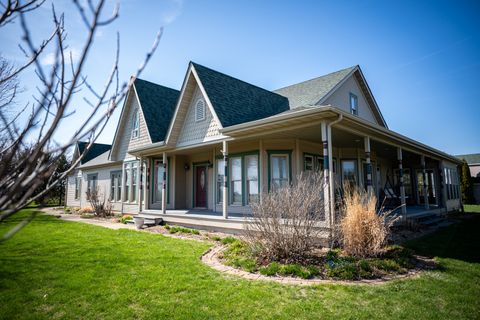
Active
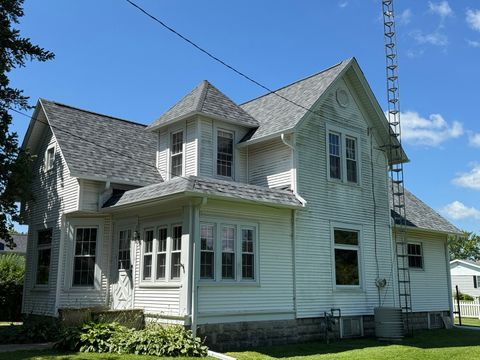
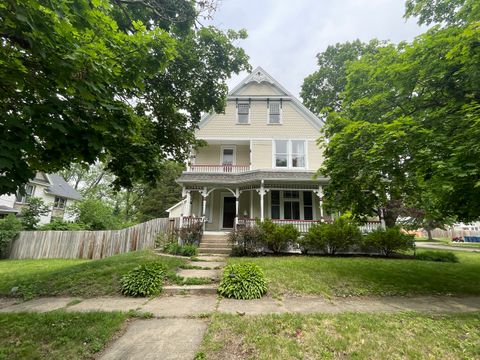
$350,000
3
bds
|
2
ba
|
1,167
sqft
|
built
1890
1061 Robbins Rd, Amboy, IL 61310
$-852
Cash flow
-12.7%
Cash-on-Cash Return
2.8%
Cap rate
0.5%
Rent to Value Ratio
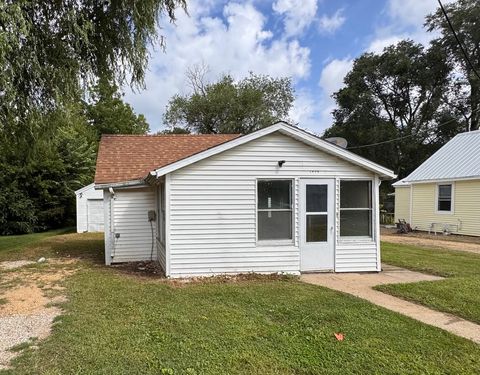
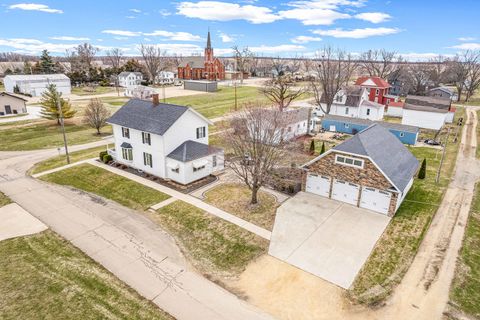
Active
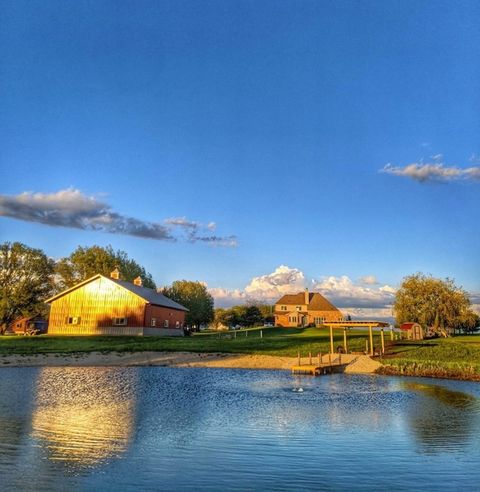
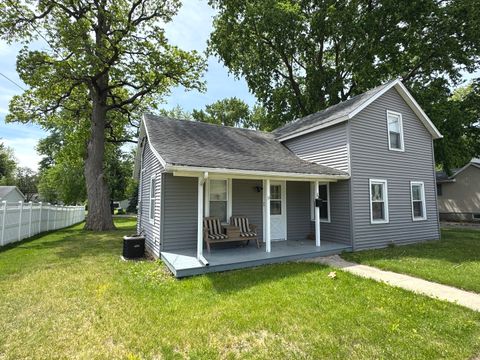
$69,000
2
bds
|
1
ba
|
516
sqft
|
built
1941
1323 Woodlawn St, Dixon, IL 61021
$634
Cash flow
10.7%
Cash-on-Cash Return
11.0%
Cap rate
1.6%
Rent to Value Ratio
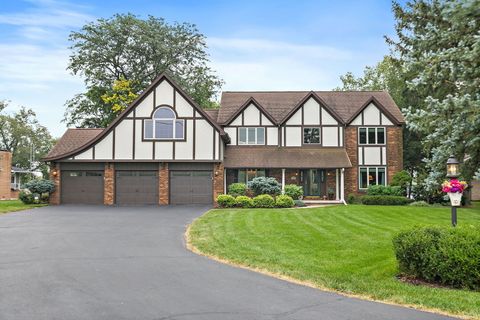
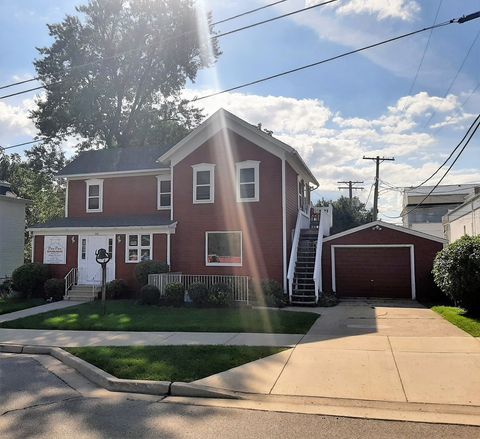
Active
$365,000
2
bds
|
3
ba
|
1,532
sqft
|
built
2021
705 Yingling Dr, Dixon, IL 61021
$-1,114
Cash flow
-15.9%
Cash-on-Cash Return
2.0%
Cap rate
0.5%
Rent to Value Ratio
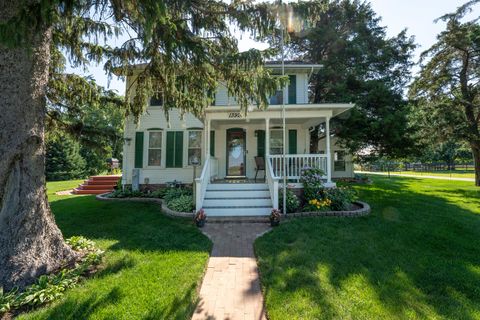
Active
$449,900
4
bds
|
4
ba
|
4,080
sqft
|
built
1861
223 E Boyd St, Dixon, IL 61021
$-1,063
Cash flow
-12.3%
Cash-on-Cash Return
2.8%
Cap rate
0.6%
Rent to Value Ratio
Active
$199,000
1
bds
|
1
ba
|
800
sqft
|
built
2012
186 Peru St, Paw Paw, IL 61353
$-70
Cash flow
-1.8%
Cash-on-Cash Return
5.3%
Cap rate
0.7%
Rent to Value Ratio
Active
$839,900
5
bds
|
3
ba
|
4,594
sqft
|
built
2011
1815 White Pines Dr, Dixon, IL 61021
$-3,190
Cash flow
-19.8%
Cash-on-Cash Return
1.1%
Cap rate
0.3%
Rent to Value Ratio
Active
$105,000
3
bds
|
1
ba
|
1,152
sqft
|
built
1891
415 W Cherry St, Compton, IL 61318
$59
Cash flow
2.9%
Cash-on-Cash Return
6.4%
Cap rate
1.0%
Rent to Value Ratio
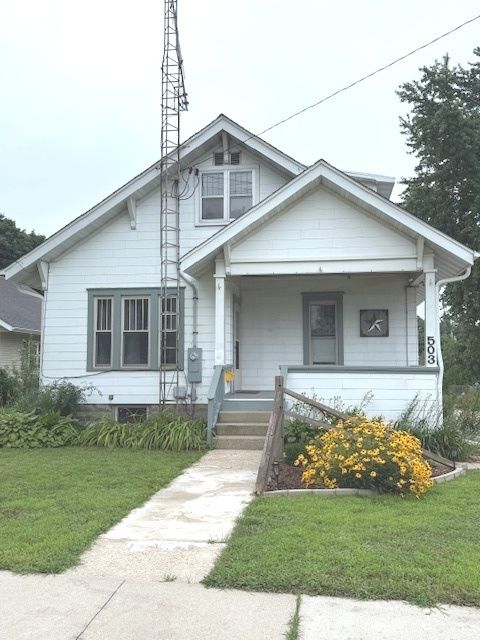
Active
$129,900
3
bds
|
2
ba
|
1,596
sqft
|
built
1924
503 N 1st St, Ashton, IL 61006
$240
Cash flow
9.6%
Cash-on-Cash Return
7.9%
Cap rate
1.2%
Rent to Value Ratio
Active
$469,000
4
bds
|
2
ba
|
2,470
sqft
|
built
1915
706 E Fellows St, Dixon, IL 61021
$-1,346
Cash flow
-15.0%
Cash-on-Cash Return
2.2%
Cap rate
0.5%
Rent to Value Ratio
Active
$229,500
3
bds
|
1
ba
|
1,200
sqft
|
built
1881
191 Peru St, Paw Paw, IL 61353
$-429
Cash flow
-9.8%
Cash-on-Cash Return
3.4%
Cap rate
0.5%
Rent to Value Ratio
Active
$279,000
2
bds
|
3
ba
|
1,348
sqft
|
built
2007
1670 Overlook Dr, Dixon, IL 61021
$-532
Cash flow
-9.9%
Cash-on-Cash Return
3.4%
Cap rate
0.6%
Rent to Value Ratio
Active
$419,000
3
bds
|
4
ba
|
2,231
sqft
|
built
2004
1803 White Pines Dr, Dixon, IL 61021
$-674
Cash flow
-8.4%
Cash-on-Cash Return
3.7%
Cap rate
0.7%
Rent to Value Ratio
Active
$389,900
3
bds
|
3
ba
|
2,754
sqft
|
built
1993
132 Fox Trot, Dixon, IL 61021
$-886
Cash flow
-11.9%
Cash-on-Cash Return
3.0%
Cap rate
0.7%
Rent to Value Ratio
Active
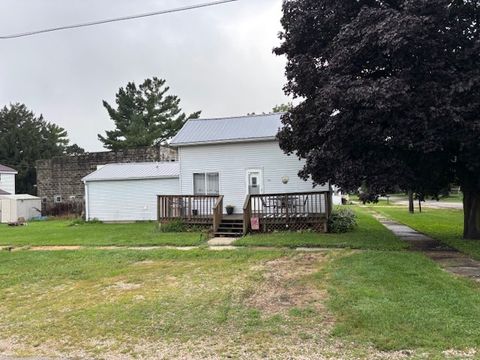
$34,950
3
bds
|
1
ba
|
1,036
sqft
|
built
1960
1312 Christiana Ter, Dixon, IL 61021
$622
Cash flow
20.7%
Cash-on-Cash Return
21.4%
Cap rate
3.1%
Rent to Value Ratio
Active
$85,000
2
bds
|
1
ba
|
1,016
sqft
|
built
1926
1707 W 3rd St, Dixon, IL 61021
$195
Cash flow
12.0%
Cash-on-Cash Return
8.4%
Cap rate
1.3%
Rent to Value Ratio
Active
$175,000
3
bds
|
3
ba
|
1,386
sqft
|
built
1925
1902 W 1st St, Dixon, IL 61021
$80
Cash flow
2.4%
Cash-on-Cash Return
6.2%
Cap rate
1.0%
Rent to Value Ratio
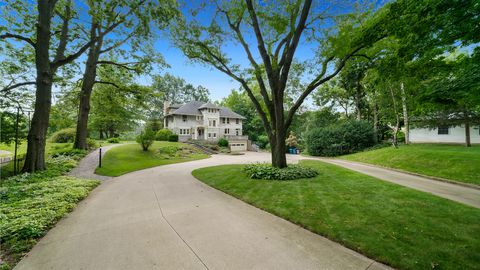
Active
$689,000
4
bds
|
3
ba
|
3,100
sqft
|
built
1981
1606 Gregden Shores Dr, Sterling, IL 61081
$-2,073
Cash flow
-15.7%
Cash-on-Cash Return
2.1%
Cap rate
0.4%
Rent to Value Ratio
Active
$597,500
3
bds
|
2
ba
|
2,224
sqft
|
built
1880
1392 Red Brick Rd, Dixon, IL 61021
$-1,932
Cash flow
-16.9%
Cash-on-Cash Return
1.8%
Cap rate
0.3%
Rent to Value Ratio
Active
$224,900
3
bds
|
2
ba
|
1,610
sqft
|
built
1963
320 Prospect St, Dixon, IL 61021
$-268
Cash flow
-6.2%
Cash-on-Cash Return
4.2%
Cap rate
0.8%
Rent to Value Ratio
Active
$210,000
2
bds
|
2
ba
|
1,440
sqft
|
built
1978
734 1st St, West Brooklyn, IL 61378
$-125
Cash flow
-3.1%
Cash-on-Cash Return
5.0%
Cap rate
0.8%
Rent to Value Ratio
Active
$149,900
4
bds
|
1
ba
|
1,583
sqft
|
built
1915
302 S John St, Sublette, IL 61367
$194
Cash flow
6.8%
Cash-on-Cash Return
7.2%
Cap rate
1.1%
Rent to Value Ratio
Active
$745,000
5
bds
|
3
ba
|
2,943
sqft
|
built
2000
1333 Woodlawn Rd, Lee, IL 60530
$-1,618
Cash flow
-11.3%
Cash-on-Cash Return
3.1%
Cap rate
0.4%
Rent to Value Ratio
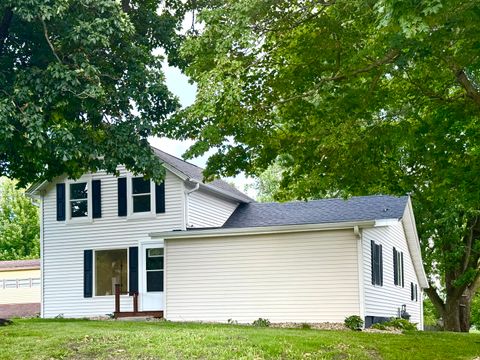
Active
$179,900
3
bds
|
3
ba
|
1,880
sqft
|
built
1920
511 Richardson Ave, Ashton, IL 61006
$-115
Cash flow
-3.3%
Cash-on-Cash Return
4.9%
Cap rate
0.9%
Rent to Value Ratio
Active
$595,000
4
bds
|
2
ba
|
2,650
sqft
|
built
1990
382 Keigwin Rd, Walnut, IL 61376
$-1,704
Cash flow
-14.9%
Cash-on-Cash Return
2.2%
Cap rate
0.4%
Rent to Value Ratio
Active
$249,000
3
bds
|
3
ba
|
2,502
sqft
|
built
1895
322 Crawford Ave, Dixon, IL 61021
$-86
Cash flow
-1.8%
Cash-on-Cash Return
5.3%
Cap rate
1.0%
Rent to Value Ratio
Active
$140,000
2
bds
|
1
ba
|
816
sqft
|
built
1861
25 W Main St, Amboy, IL 61310
$152
Cash flow
5.7%
Cash-on-Cash Return
7.0%
Cap rate
0.9%
Rent to Value Ratio
Active
$625,000
4
bds
|
2
ba
|
2,152
sqft
|
built
1901
2034 Gittleson Rd, Rochelle, IL 61068
$-1,379
Cash flow
-11.5%
Cash-on-Cash Return
3.0%
Cap rate
0.4%
Rent to Value Ratio

Active
$339,000
5
bds
|
3
ba
|
2,718
sqft
|
built
1881
321 E Chamberlin St, Dixon, IL 61021
$-682
Cash flow
-10.5%
Cash-on-Cash Return
3.3%
Cap rate
0.6%
Rent to Value Ratio
Active
$499,000
4
bds
|
5
ba
|
6,152
sqft
|
built
1975
1479 Old Mill Rd, Franklin Grove, IL 61031
$-1,106
Cash flow
-11.6%
Cash-on-Cash Return
3.0%
Cap rate
0.6%
Rent to Value Ratio
Active
$120,500
3
bds
|
2
ba
|
1,759
sqft
|
built
1901
215 W Hughes St, Franklin Grove, IL 61031
$284
Cash flow
12.3%
Cash-on-Cash Return
8.5%
Cap rate
1.3%
Rent to Value Ratio
Active
$219,000
4
bds
|
2
ba
|
1,480
sqft
|
built
1908
2523 Woods St, West Brooklyn, IL 61378
$-77
Cash flow
-1.8%
Cash-on-Cash Return
5.3%
Cap rate
0.8%
Rent to Value Ratio
Active
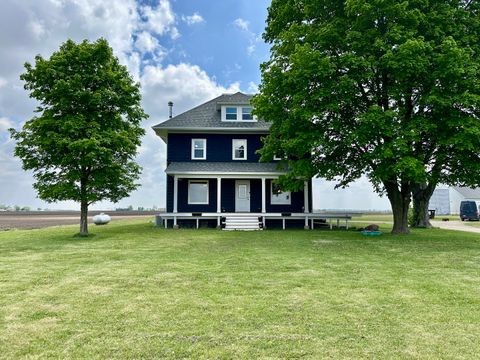
$350,000
5
bds
|
3
ba
|
2,700
sqft
|
built
1916
953 Paw Paw Rd, Paw Paw, IL 61353
$-776
Cash flow
-11.6%
Cash-on-Cash Return
3.0%
Cap rate
0.6%
Rent to Value Ratio
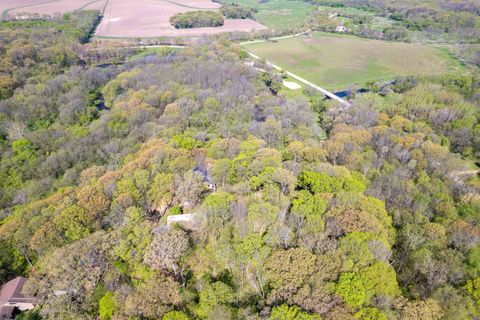
Active
$650,000
4
bds
|
3
ba
|
4,300
sqft
|
built
2003
3402 S Paw Paw Rd, Paw Paw, IL 61353
$-1,823
Cash flow
-14.6%
Cash-on-Cash Return
2.3%
Cap rate
0.4%
Rent to Value Ratio
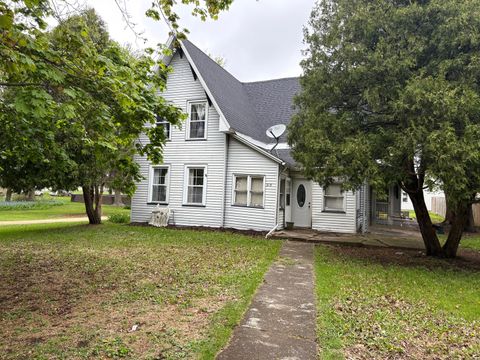
Active
$255,000
3
bds
|
2
ba
|
1,900
sqft
|
built
1880
2513 Woods St, West Brooklyn, IL 61378
$-257
Cash flow
-5.3%
Cash-on-Cash Return
4.5%
Cap rate
0.7%
Rent to Value Ratio
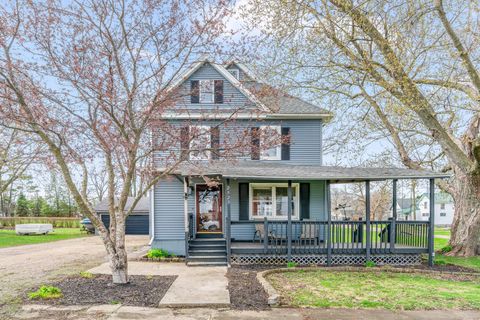
Active
$245,000
2
bds
|
4
ba
|
2,400
sqft
|
built
1891
250 Peru St, Paw Paw, IL 61353
$-184
Cash flow
-3.9%
Cash-on-Cash Return
4.8%
Cap rate
0.8%
Rent to Value Ratio
Active
$35,000
2
bds
|
1
ba
|
1,008
sqft
|
built
1881
344 W Everett St, Dixon, IL 61021
$497
Cash flow
16.5%
Cash-on-Cash Return
17.0%
Cap rate
2.6%
Rent to Value Ratio
Active
$119,000
6
bds
|
2
ba
|
0
sqft
|
built
1860
109 E Chamberlin St, Dixon, IL 61021
$449
Cash flow
19.7%
Cash-on-Cash Return
10.2%
Cap rate
1.5%
Rent to Value Ratio