Peoria County Investment Properties for Sale
Browse homes for sale and investment properties in Peoria County. Refine your search by price, property type, or more.
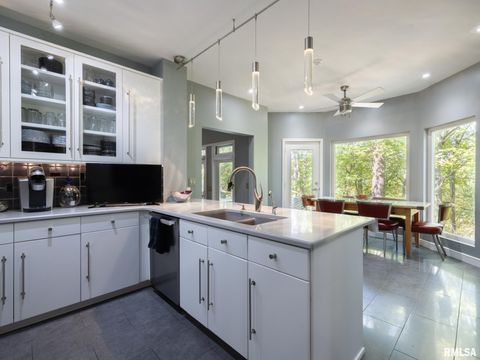
Best cash flowing properties in Peoria County
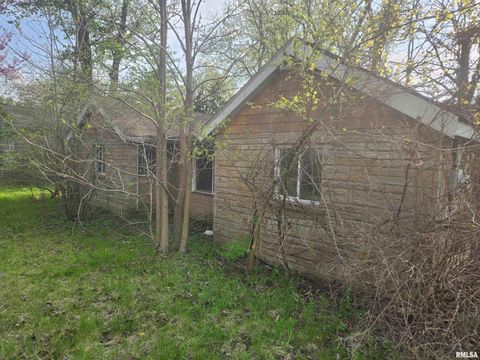
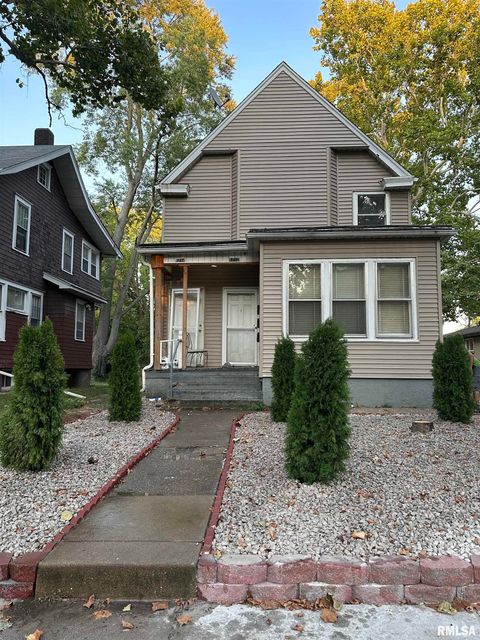
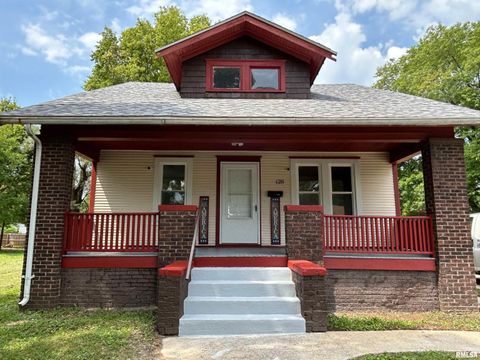
Active
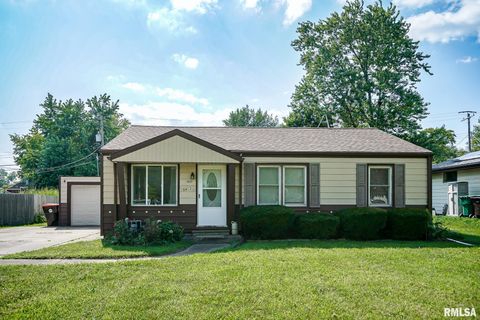
$69,500
3
bds
|
0
ba
|
1,108
sqft
|
built
1949
9915 N Blacksoil Ln, Peoria, IL 61615
$1,033
Cash flow
17.3%
Cash-on-Cash Return
17.8%
Cap rate
2.3%
Rent to Value Ratio
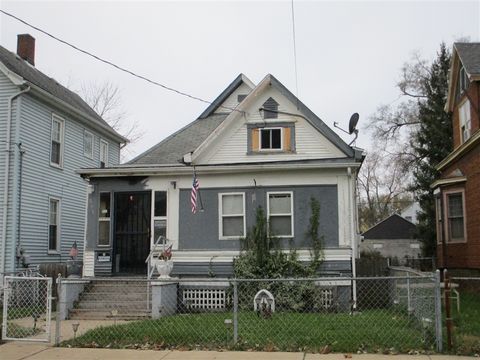
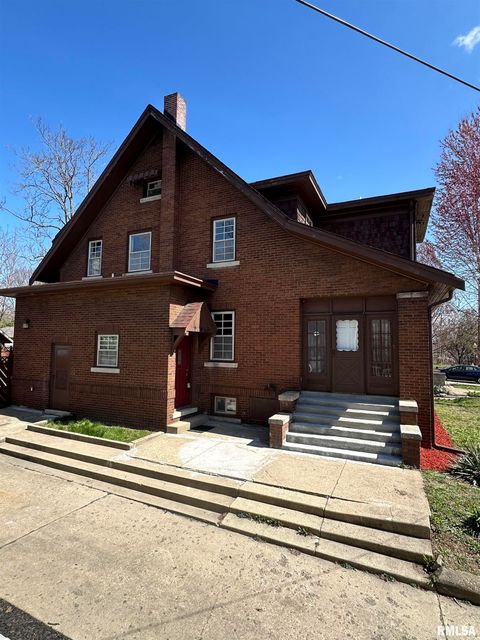
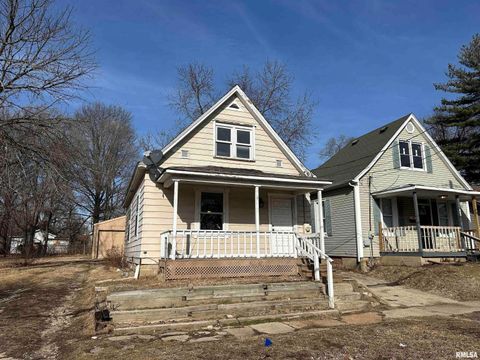
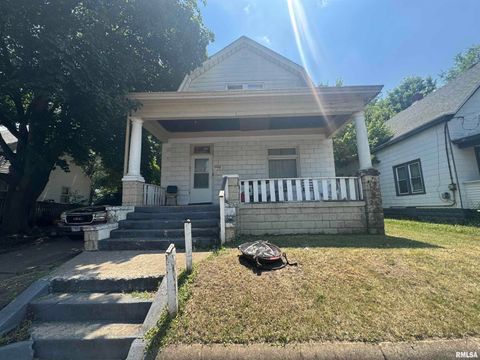
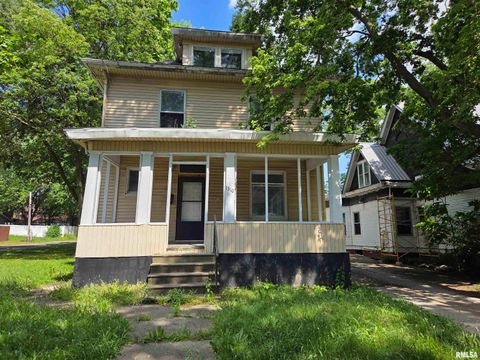
Active
$21,900
3
bds
|
1
ba
|
1,026
sqft
|
built
1906
801 S Warren St, Peoria, IL 61605
$856
Cash flow
45.5%
Cash-on-Cash Return
46.9%
Cap rate
5.9%
Rent to Value Ratio
166 out of 176 properties for sale in Peoria County
Limited Results Shown
Create a free account, or log in to reveal all property listings and enjoy the complete experience.
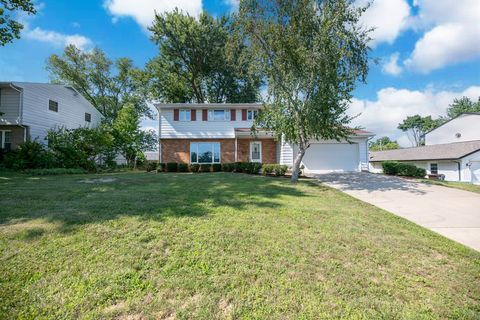
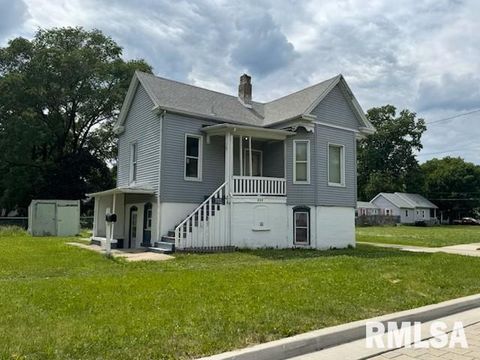
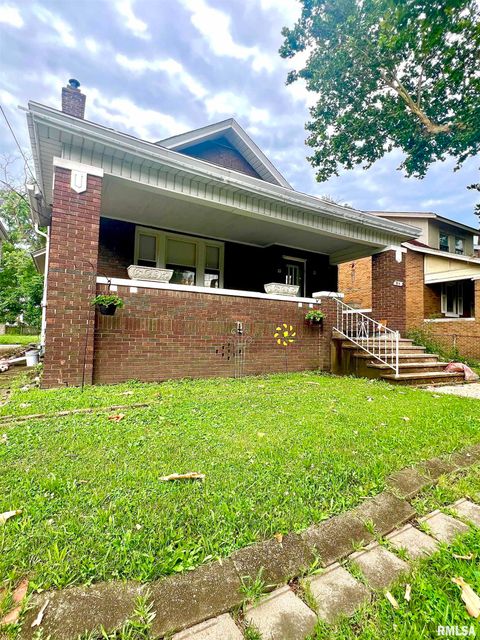
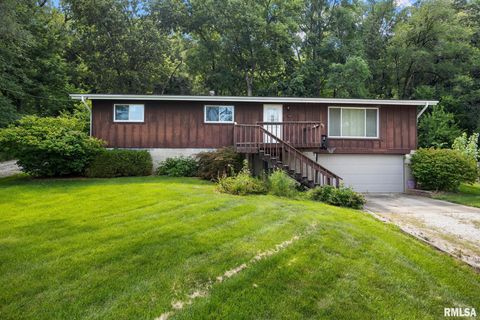
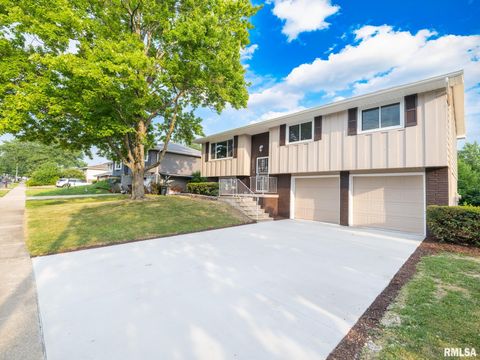
Active
$199,900
3
bds
|
3
ba
|
1,748
sqft
|
built
1961
2301 W Wagner Ln, Peoria, IL 61615
$84
Cash flow
2.2%
Cash-on-Cash Return
6.2%
Cap rate
0.9%
Rent to Value Ratio
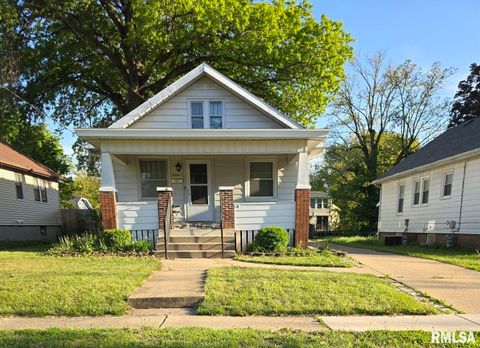
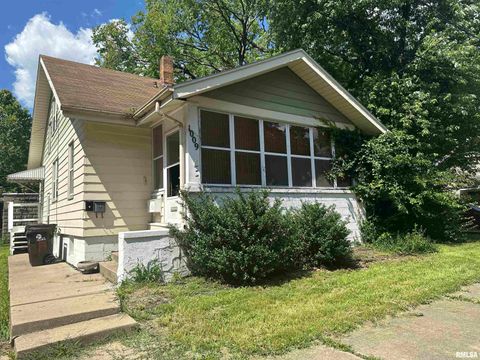
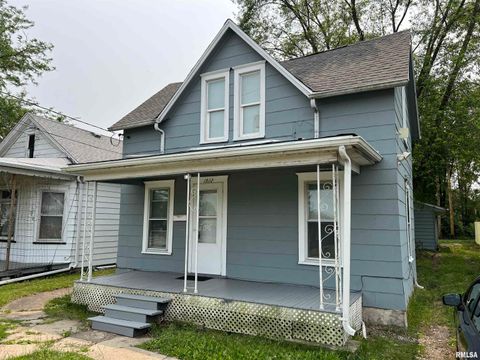
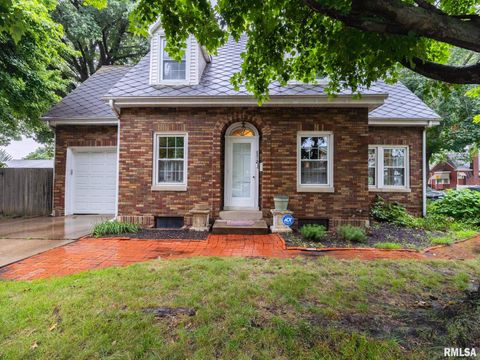
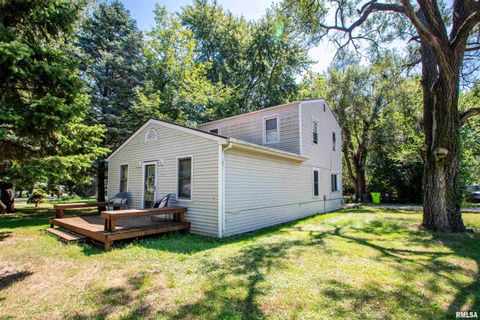
Active
$69,900
2
bds
|
1
ba
|
816
sqft
|
built
1926
718 W Corrington Ave, Peoria, IL 61604
$528
Cash flow
8.8%
Cash-on-Cash Return
9.1%
Cap rate
1.4%
Rent to Value Ratio
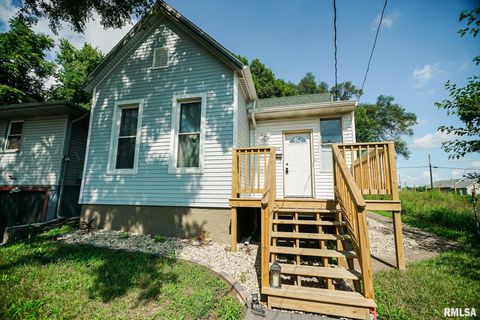
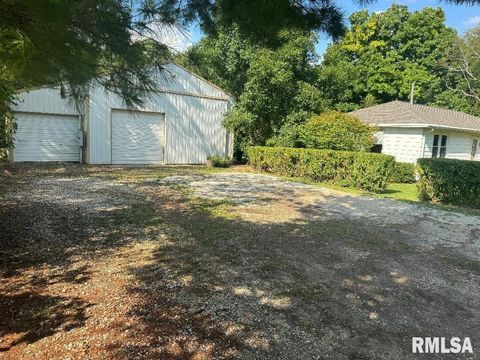
Active
$115,000
4
bds
|
3
ba
|
2,178
sqft
|
built
1930
1712 N Bigelow St, Peoria, IL 61604
$294
Cash flow
13.3%
Cash-on-Cash Return
8.7%
Cap rate
1.1%
Rent to Value Ratio
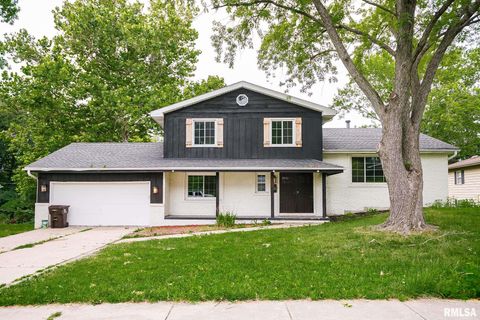
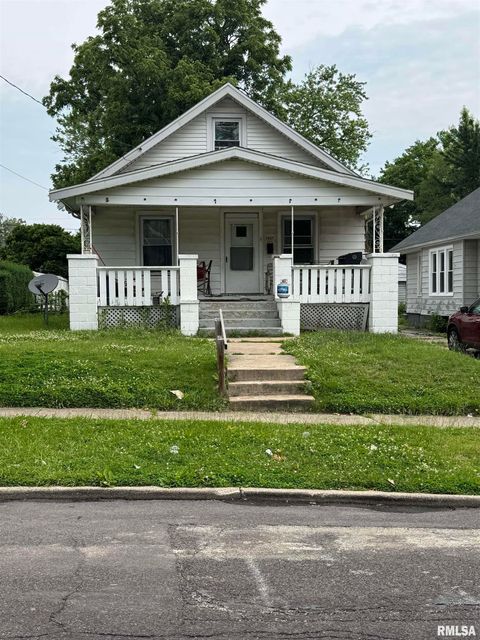
Active
$260,000
5
bds
|
4
ba
|
2,741
sqft
|
built
1915
949 NE Glen Oak Ave, Peoria, IL 61603
$-90
Cash flow
-1.8%
Cash-on-Cash Return
5.3%
Cap rate
1.0%
Rent to Value Ratio
Active
$45,000
2
bds
|
1
ba
|
650
sqft
|
built
1930
511 Laveille St, Peoria, IL 61603
$545
Cash flow
14.1%
Cash-on-Cash Return
14.5%
Cap rate
2.0%
Rent to Value Ratio
Active
$89,900
3
bds
|
2
ba
|
1,310
sqft
|
built
1920
1009 W Armstrong Ave, Peoria, IL 61606
$335
Cash flow
19.4%
Cash-on-Cash Return
10.1%
Cap rate
1.4%
Rent to Value Ratio
Active
$699,900
5
bds
|
5
ba
|
4,929
sqft
|
built
1994
119 W Greystone Ct, Dunlap, IL 61525
$-2,405
Cash flow
-17.9%
Cash-on-Cash Return
1.6%
Cap rate
0.5%
Rent to Value Ratio
Active
$69,000
3
bds
|
1
ba
|
1,284
sqft
|
built
1920
1001 W Brons Ave, Peoria, IL 61604
$568
Cash flow
9.6%
Cash-on-Cash Return
9.9%
Cap rate
1.4%
Rent to Value Ratio
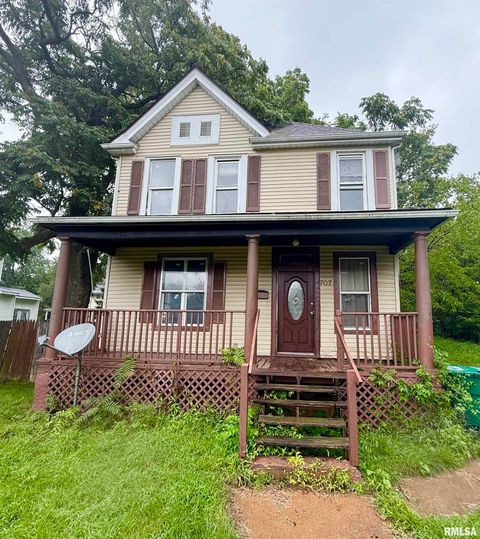
Active
$44,000
3
bds
|
1
ba
|
1,476
sqft
|
built
1925
707 E Ravine Ave, Peoria, IL 61603
$829
Cash flow
22.0%
Cash-on-Cash Return
22.6%
Cap rate
3.0%
Rent to Value Ratio
Active
$49,500
1
bds
|
1
ba
|
696
sqft
|
built
1955
853 S Kim Moor Rd, Peoria, IL 61605
$527
Cash flow
12.4%
Cash-on-Cash Return
12.8%
Cap rate
2.0%
Rent to Value Ratio
Active
$169,900
4
bds
|
2
ba
|
1,512
sqft
|
built
1953
5413 N Hamilton Rd, Peoria, IL 61614
$275
Cash flow
8.4%
Cash-on-Cash Return
7.6%
Cap rate
1.0%
Rent to Value Ratio
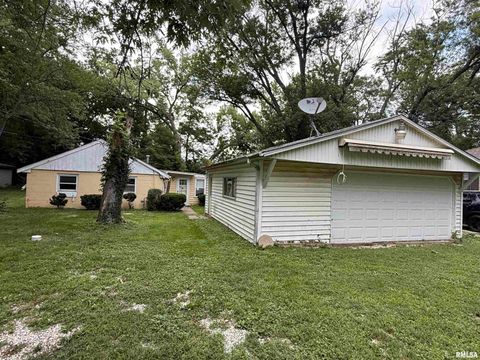
Active
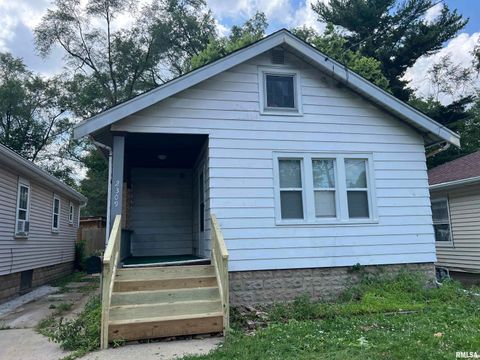
$47,000
1
bds
|
1
ba
|
600
sqft
|
built
1930
2309 N Flora Ave, Peoria, IL 61604
$437
Cash flow
10.8%
Cash-on-Cash Return
11.2%
Cap rate
1.7%
Rent to Value Ratio
Active
$55,000
2
bds
|
1
ba
|
1,584
sqft
|
built
1930
2010 W Garden St, Peoria, IL 61605
$798
Cash flow
16.9%
Cash-on-Cash Return
17.4%
Cap rate
2.4%
Rent to Value Ratio
Active
$89,900
2
bds
|
1
ba
|
876
sqft
|
built
1920
1123 S Maxwell Rd, Peoria, IL 61607
$248
Cash flow
14.4%
Cash-on-Cash Return
9.0%
Cap rate
1.4%
Rent to Value Ratio
Active
$89,900
3
bds
|
2
ba
|
1,970
sqft
|
built
1930
1614 N Missouri Ave, Peoria, IL 61603
$441
Cash flow
25.6%
Cash-on-Cash Return
11.6%
Cap rate
1.7%
Rent to Value Ratio
Active
$56,000
3
bds
|
1
ba
|
857
sqft
|
built
1920
1912 W Ann St, Peoria, IL 61605
$605
Cash flow
12.6%
Cash-on-Cash Return
13.0%
Cap rate
1.8%
Rent to Value Ratio
Active
$69,500
2
bds
|
1
ba
|
812
sqft
|
built
1930
1526 S Lydia Ave, Peoria, IL 61605
$624
Cash flow
10.5%
Cash-on-Cash Return
10.8%
Cap rate
1.4%
Rent to Value Ratio
Active
$259,900
4
bds
|
3
ba
|
2,229
sqft
|
built
1971
5317 N Woodview Ave, Peoria, IL 61614
$-139
Cash flow
-2.8%
Cash-on-Cash Return
5.0%
Cap rate
0.9%
Rent to Value Ratio
Active
$162,000
3
bds
|
3
ba
|
2,060
sqft
|
built
1978
7613 S Jefferson St, Bartonville, IL 61607
$12
Cash flow
0.4%
Cash-on-Cash Return
5.8%
Cap rate
1.0%
Rent to Value Ratio
Active
$164,900
3
bds
|
2
ba
|
2,166
sqft
|
built
1930
2313 W Rohmann Ave, West Peoria, IL 61604
$391
Cash flow
12.4%
Cash-on-Cash Return
8.5%
Cap rate
1.2%
Rent to Value Ratio
Active
$274,900
3
bds
|
1
ba
|
1,248
sqft
|
built
1955
10800 N Trigger Rd, Dunlap, IL 61525
$-362
Cash flow
-6.9%
Cash-on-Cash Return
4.1%
Cap rate
0.7%
Rent to Value Ratio
Active
$79,900
3
bds
|
1
ba
|
2,153
sqft
|
built
1920
1207 W Mc Clure Ave, Peoria, IL 61604
$359
Cash flow
23.4%
Cash-on-Cash Return
11.1%
Cap rate
1.6%
Rent to Value Ratio
Active
$42,000
2
bds
|
1
ba
|
576
sqft
|
built
1930
3620 NE Brevis St, Peoria, IL 61603
$478
Cash flow
13.3%
Cash-on-Cash Return
13.7%
Cap rate
1.9%
Rent to Value Ratio
Active
$207,000
3
bds
|
2
ba
|
2,450
sqft
|
built
1955
621 E Sciota Ave, Peoria Heights, IL 61616
$111
Cash flow
2.8%
Cash-on-Cash Return
6.3%
Cap rate
1.1%
Rent to Value Ratio
Active
$65,000
4
bds
|
1
ba
|
1,324
sqft
|
built
1915
2005 W Antoinette St, Peoria, IL 61605
$761
Cash flow
13.6%
Cash-on-Cash Return
14.0%
Cap rate
1.8%
Rent to Value Ratio
Active
$44,900
1
bds
|
1
ba
|
1,144
sqft
|
built
1921
909 W Mc Clure Ave, Peoria, IL 61604
$422
Cash flow
10.9%
Cash-on-Cash Return
11.3%
Cap rate
1.6%
Rent to Value Ratio
Active
$750,000
5
bds
|
5
ba
|
5,909
sqft
|
built
2002
4904 N Deermeadow Dr, Peoria, IL 61615
$-3,035
Cash flow
-21.1%
Cash-on-Cash Return
0.8%
Cap rate
0.4%
Rent to Value Ratio
Active
$499,900
3
bds
|
3
ba
|
2,112
sqft
|
built
1999
17327 W Route 24, Glasford, IL 61533
$-1,226
Cash flow
-12.8%
Cash-on-Cash Return
2.7%
Cap rate
0.5%
Rent to Value Ratio
Active
$360,000
4
bds
|
3
ba
|
3,541
sqft
|
built
1966
202 W Wolf Rd, Peoria, IL 61614
$-601
Cash flow
-8.7%
Cash-on-Cash Return
3.7%
Cap rate
0.7%
Rent to Value Ratio
Active
$154,000
2
bds
|
1
ba
|
1,132
sqft
|
built
1965
11405 W Farmington Rd, Hanna City, IL 61536
$-17
Cash flow
-0.6%
Cash-on-Cash Return
5.5%
Cap rate
0.9%
Rent to Value Ratio
Active
$449,900
5
bds
|
3
ba
|
2,739
sqft
|
built
2003
21501 N Berchtold Rd, Chillicothe, IL 61523
$-1,339
Cash flow
-15.5%
Cash-on-Cash Return
2.1%
Cap rate
0.4%
Rent to Value Ratio
Active
$49,900
2
bds
|
1
ba
|
856
sqft
|
built
1920
316 E Thrush Ave, Peoria, IL 61603
$601
Cash flow
14.0%
Cash-on-Cash Return
14.5%
Cap rate
2.0%
Rent to Value Ratio
Active
$374,900
4
bds
|
3
ba
|
3,246
sqft
|
built
2003
4815 N Weaverridge Blvd, Peoria, IL 61615
$-699
Cash flow
-9.7%
Cash-on-Cash Return
3.4%
Cap rate
0.7%
Rent to Value Ratio
Active
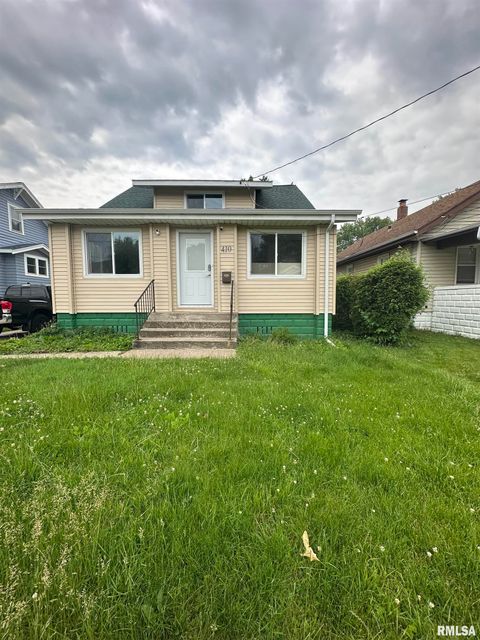
$140,000
4
bds
|
2
ba
|
1,152
sqft
|
built
1929
410 E Virginia Ave, Peoria, IL 61603
$113
Cash flow
4.2%
Cash-on-Cash Return
6.7%
Cap rate
0.9%
Rent to Value Ratio
Active
$97,000
5
bds
|
2
ba
|
1,383
sqft
|
built
1925
1211 N Ellis St, Peoria, IL 61606
$177
Cash flow
9.5%
Cash-on-Cash Return
7.9%
Cap rate
1.1%
Rent to Value Ratio
Active
$279,900
4
bds
|
3
ba
|
1,824
sqft
|
built
1976
2922 W Larchmont Ln, Peoria, IL 61615
$-390
Cash flow
-7.3%
Cash-on-Cash Return
4.0%
Cap rate
0.6%
Rent to Value Ratio
Active
$55,000
3
bds
|
1
ba
|
1,344
sqft
|
built
1900
1310 N Sheridan Rd, Peoria, IL 61606
$560
Cash flow
11.9%
Cash-on-Cash Return
12.2%
Cap rate
1.8%
Rent to Value Ratio
Active
$102,900
2
bds
|
2
ba
|
1,460
sqft
|
built
1939
2036 W Richwoods Blvd, Peoria, IL 61604
$223
Cash flow
11.3%
Cash-on-Cash Return
8.3%
Cap rate
1.3%
Rent to Value Ratio